TRADERUN
MOODUL TRADERUN
MODULE BUSINESS PECULIARITIES IN THE EU,
RUSSIA AND
EASTERN PARTNERSHIP COUNTRIES
ÄRI ERIPÄRAD EUROOPA LIIDUS, VENEMAAL JA IDAPARTNERLUSRIIKIDES
Lecturers: Ryhor Nizhnikau (
responsible ) Giorgi Gaganidze,
Sergei Proskura, Andres Assor
P2EC.00.202 (UT
code ), RIE 7044 (TLU code)
Reading materials: Business peculiarities in
Ukraine and
Belarus Lugemismatejal: Äri eripärad Ukrainas ja Valgenenes
Created by Andres Assor Tartu 2013
TABLE OF CONTENTS
INTRODUCTION ................................................................................................................... 4
1.
UKRAINE ...................................................................................................................... 5
1.1.
General information ..................................................................................................... 5
1.1.1. Country Profile ..................................................................................................... 5
1.1.2. Post-Independent Ukraine. Economy and politics ............................................... 6
1.1.3. Key Macroeconomic indicators ......................................................................... 14
1.1.4. Foreign Direct Investments ................................................................................ 16
1.1.5. Demographics and labor force .......................................................................... 17
1.1.6. New emerging industry ....................................................................................... 19
1.2.
The Business Environment ........................................................................................ 23
1.3.
Banking system.......................................................................................................... 27
1.4.
Starting a business in Ukraine ................................................................................... 32
1.5.
Market entry strategies .............................................................................................. 33
1.5.1. Direct Sales ........................................................................................................ 33
1.5.2. Agency and Commission arrangements ............................................................. 34
1.5.3. Joint venture with a Ukrainian partner .............................................................. 34
1.5.4. Representative office (commercial and non-commercial) ................................. 34
1.5.5. Ukrainian subsidiary .......................................................................................... 35
1.6.
Foreign investment treatment .................................................................................... 35
1.7.
Corporate forms ......................................................................................................... 37
1.8.
Taxation ..................................................................................................................... 39
1.8.1. Corporate income tax (CIT) ............................................................................... 39
1.8.2. Withholding Tax (WHT) ..................................................................................... 41
1.8.3. Value Added Tax (VAT) ...................................................................................... 42
1.8.4. Transfer Pricing (TP) ......................................................................................... 43
1.8.5. Personal taxation ............................................................................................... 44
1.9.
Financial Reporting ................................................................................................... 45
1.10.
Currency regulations .............................................................................................. 46
1.11.
Risk of UAH devaluation ....................................................................................... 48
2.
BELARUS .....................................................................................................................51
2.1.
General information ................................................................................................... 51
2.1.1. Country Profile ................................................................................................... 51
2.1.2. Overview of Belarusian economy ....................................................................... 52
2.2.
Customs Union of Belarus,
Russia and Kazakhstan.................................................. 55
2.3.
The Business Environment ........................................................................................ 58
2.4.
Banking system.......................................................................................................... 59
2.5.
Development of Private
Sector .................................................................................. 61
2.5.1. Starting a business in Belarus ............................................................................ 63
2.6.
Foreign Investment treatment .................................................................................... 66
2.7.
Corporate forms ......................................................................................................... 71
2.7.1. Limited Liability Company ................................................................................. 72
2.7.2. Joint- Stock Company .......................................................................................... 73
2.7.3. Private unitary enterprise .................................................................................. 74
2.7.4. Registration of the companies in Belarus .......................................................... 75
2.8.
Taxation ..................................................................................................................... 75
2.8.1. Corporate income tax (CIT) ............................................................................... 75
2.8.2. Withholding tax (WHT) ...................................................................................... 78
2
2.8.3. Value Added Tax (VAT) ...................................................................................... 80
2.8.4. Transfer Pricing (TP) ......................................................................................... 82
2.8.5. Personal Taxation .............................................................................................. 82
2.9.
Financial Reporting ................................................................................................... 83
2.10.
Currency Regulations ............................................................................................. 86
Appendix 1. Ukraine. Key macroeconomic
forecasts . ...........................................................89
Appendix 2. Ukraine. Development of IT
Outsourcing industry - selected charts ..................90
Appendix 3. Ukraine. Summary of Doing Business indicators...............................................92
Appendix 4. Ukraine.
Chart of withholding tax rates. ............................................................96
Appendix 5. Belarus. Summary of Doing Business indicators. ..............................................99
Appendix 6. Belarus. Chart of withholding tax rates. ........................................................... 103
References ......................................................................................................................... 104
ABOUT TRADERUN
PROGRAMME .................................................................................. 106
3
INTRODUCTION The
current reading
material focuses on business peculiarities in Ukraine and Belarus.
***
The aim of the Traderun programme course “FUNDING PROJECTS IN RUSSIA AND EASTERN
PARTNERSHIP COUNTRIES” is to provide the students with comprehensive and practical
overview of the fundraising possibilities in EU and Estonia. The course gives an overview of
EU structural support and regional implementing agencies, that are available for a
businessman to apply for a fund.
A successful student will be aware of and understand the EU fundraising possibilities in the
frames of cooperation with Russian and Eastern Partnership countries, and able to define the
financing criteria and priorities.
The current reading material summarises the main aspects covered by lectures and
structurises the information channels for the future.
The course supports the other Traderun courses, especially the course related to EU
cooperation with Russia and Eastern Partnership Countries.
4
1. UKRAINE 1.1. General information 1.1.1. Country Profile
Capital: Kyiv.
Total area: 603,550 sq. km (the largest country in
Europe by area that is physically
within Europe entirely).
Population: ~ 45 million (
declining).
Major cities and
estimated population (
Good news
! Not all the business and capital concentrated in the capital):
Kyiv (
Kiev ) – 2.8 million,
Kharkiv (Kharkov) – 1.5 million,
Lviv (
Lvov ) - 1.5 million,
Donetsk – 1 million,
Dnipropetrovsk (Dnepropetrovsk) - 1 million,
Odesa (Odessa) – 1 million.
Zaporizhzhya (Zaporozhye) – 0.8 million.
5
GDP
growth , %: 1.0 (2013
forecast EBRD – downward revision from previously projected
2.5%).
Official language : Ukrainian (
although Russian is widely used in business
communication ).
Currency: Hryvnya (UAH).
Government type:
republic .
Membership: the United Nations, the International Monetary Fund (IMF), the World
Bank , the European Bank for
Reconstruction and Development (EBRD), the World Trade
Organization (WTO), etc.
Ukraine is bordered by Russia in the
east , the
Black Sea in the
south ,
Moldova , Romania,
Hungary,
Slovakia and
Poland in the
west , and Belarus in the
north . The country is
rich in
mineral resources:
iron ore,
coal , manganese, natural gas (
shale – costly and dangerous to
extract), oil,
sulfur , graphite,
titanium , magnesium, kaolin, nickel,
mercury , timber and
others .
It’s commonly
known that Ukraine is politically
divided between its
Western and Eastern
regions . Ukraine's geography and history have played an
important role in the country's
current
political crisis . Western parts of the country at
times belonged to Poland, Austro-
Hungary, and Czechoslovakia,
while eastern and
southern parts belonged to Russian
Empire .
Only after World War II did Ukraine attain its
present borders as a republic within the
Soviet Union. That history
partly explains Ukraine's voting
patterns , political sympathies, and
outlook on the future.
Population of Western Ukraine largely supports politics paying EU card (Yusteshenko,
Tymoshenko), while
industrial Eastern regions support Yanukovych as Politian closely
associated with better relation / integration with Russia.
1.1.2. Post-Independent Ukraine. Economy and politics
1990-s
When Ukraine
became independent in 1991,
there were
expectations that it would in the
near future become a wealthy free market
democracy and a
full member of the European
and Euro-
Atlantic communities. Ukraine
never fulfilled those expectations. Instead, it is
seen as an underachiever, sometimes as a sick man of Europe, and
perhaps even as a potentially
failed state thanks to its geopolitical situation, historical burdens, and the mistakes made in
institutional development and
policy .
Economically, Ukraine has
grown along with the
region . As
such , growth rates have not been
low, but they
come after the economically devastating
1990s and are not
built on a
6
sustainable foundation. For
years Russia
provided Ukraine with underpriced gas while
Ukraine’s
export prices increased rapidly. Over the decades Ukraine,
however , grew
dependent on oil and gas
coming from Russia, at
almost no
cost .
Today , 70
percent of gas
consumed in the country is imported.
In 1991 Ukraine was one of the poorest Soviet republics. Statistics for the time are
notoriously uncertain, but the
best ones available show Ukraine’s GDP at just $1,307 per
capita . Only
Azerbaijan ,
Georgia , Kyrgyzstan, Tajikistan, and Uzbekistan lagged
behind Ukraine; even Moldova and Turkmenistan, generally regarded as very
poor Soviet republics,
were
ahead of Ukraine.
Ukraine’s economy contracted annually between 9.7 and 22.7 percent in 1991–1996. The
country experienced hyperinflation and an exceptionally huge
production decline for a
country not ravaged by a major war. Official GDP collapsed by almost
half from 1990 to
1994, and
slow decline continued throughout the decade.
Economic growth would not
resume again until 2000. The
budget deficit was, at 14.4 percent of GDP, exceptionally large.
Barter and the use of surrogate moneys and foreign currencies
prevailed . Ukraine had
introduced a sovereign currency, the Hryvnia, but it was
little used. A
shadow economy
swelled and compensated for an unknown
share of the economic collapse.
2001-2008
Between 2001 and 2008, the Ukrainian economy picked up significantly. Many of Ukraine’s
large-
scale capitalists—the oligarchs—are
former Soviet-era industrial managers who
succeeded on a grand scale when industries were privatized. Their
wealth was originally
based on a
traditional ,
simple formula :
convert cheap energy and raw materials into
metals and manufactured
goods . The six richest Ukrainians are all metallurgy magnates.
In Ukraine—like in Russia—incumbent managers (
there is a special term in Russian for such
executives/ owners – Red Director ) were present at the
birth of private property and
could harness privatization. The political atmosphere of
nation building helped
keep foreigners —
Russians and Westerners alike—mostly out of the
game . The major exception was the
financial system;
several banks both from the West and the East have entered Ukrainian
markets .
Crucially for Ukraine’s survival, between 2001 and 2008, as metals and
chemicals prices
boomed on the
back of
fast international economic growth while the
price of gas imported
from Russia remained low,
terms of trade
improved by 50 percent. Monetization also helped
to drive this boom, as the
ratio of
credit to GDP grew extremely fast—from 7 to almost 80
percent over just several years.
7
In less
than a decade, Ukraine leaped from an economy not based on
money to
having a
banking sector comparable in relative
size to that of many well-
established market
economies . Credit was at last available, and not only from state-controlled and other
politically connected banks, but from reputable foreign banks channeling
easy international
liquidity to Ukraine as they did to other emerging economies.
From 2000 to 2007, Ukraine’s
real growth averaged 7.4 percent and was thus very
similar to
Russia’s. In both countries, this growth was driven by
domestic demand : orientation
toward consumption , other structural
change , and financial development. In Ukraine, domestic
demand grew in
constant prices by almost 15 percent annually. It was supported by
expansionary—pro-cyclical—fiscal policy generally driven by populism for
perceived short-
term political
gain .
Further , industrial
capacity left idle in the 1990s was
brought into use, capital inflows surged
after 2005, and credit growth was fueled by
external borrowing. In terms of markets, in
2000, the EU was
already the largest, purchasing almost a third of Ukraine’s exports. It was
followed by Russia and
Asia , with a share of just under a
quarter for both. In 2009, Asia
passed the EU, but together they
still accounted for 55 percent of exports. Fast-
growing Asian economies are now the
basic consumers of Ukrainian metallurgy
products , and
Russia’s exports of oil and gas suffer from low growth in Europe more than Ukraine’s exports
do.
Meanwhile , the price of gas remained low. In 2008, the price
paid by Ukraine for gas was still
less than half of that paid by Western European countries. Over a longer
period , this growth
pattern was
bound to be unsustainable. This is the most important
single fact of Ukraine’s
economic prospects. The improving terms of trade of the 2000s were a
positive windfall, but
Ukraine did not
know how to use that windfall wisely. Ukraine’s economy and its growth
prospects ultimately suffered from its nationalism and inefficiency.
The windfall Ukraine enjoyed meant that industry did not have to diversify or become more
sophisticated—two
characteristics that are
necessary for
competition in today’s markets. In
2000, metals and mineral products accounted for half of Ukraine’s exports.
Adding agro-food
and chemicals
took the
proportion to just over 70 percent. In 2008, the
shares remained
quite similar, with agro-food increasing from 11 to 16 percent.
Steel export
unit value grew
more than
four times between 2000 and 2008, while steel export
volume grew only little
between 2000 and 2004, and then stagnated.
Missteps in Domestic Economy
With a windfall to rely on, Ukraine not only failed to diversify its exports but also
mismanaged its domestic economy.
Since 1992 Ukraine has had just one
year , 2002, with a
8
balanced budget. Income growth has been huge, and the ratio of domestic savings declined
as consumption boomed. Since 2001 annual growth in
average monthly earnings has always
surpassed
consumer price inflation, until 2008 quite frequently by more than 20 percentage
points and never much
below that. Such income growth was supported by the country’s high
export, especially steel, prices.
Boosted by rapidly improving terms of trade,
import volumes grew much faster than export
volumes and the net growth impact of foreign trade was
negative by some 5 percent
annually. As imports were liberalized in the 1990s, consumers and investors alike
preferred the
superior quality ,
choice , and
brands available from world markets. By the 2000s an
increasing share of
them could afford foreign goods. Cheap imports from Asian and other
countries also became available. The trade
balance has been consistently negative since
2005, and the current
account has followed since 2006.
Imports contribute to
welfare , but for that to be sustainable, any country also has to be able
to
cover the import bill with exports,
running down reserves, inward investment (direct or
other), or raising foreign credit. But exports, of course, were not
providing the necessary
boost. And Ukraine had to
begin with in
practice no official reserves or foreign
assets and
liabilities, as Russia had taken responsibility for the Soviet bequest. Ukraine inherited no
assets to run down. And no
reserve funds were built to
sustain the fiscal situation over a
longer term. Thus, Ukraine’s dependence on foreign,
usually short-term, funding increased
(which would
prove dangerous in the 2008 crisis and will threaten Ukraine in the future as
well).
Net inward foreign direct investment (FDI) has been positive since 1992, varying in 2005–
2010 between $5 and $10
billion annually. But most foreign direct investment has
gone to
closed-sector
services such as retail trade and
finance , while the industries inherited from
the Soviet Union were privatized to domestic owners and are controlled by oligarchs.
These industries have
typically failed to become more
competitive in more than a decade. Major
needs for infrastructure investment have accumulated.
In
contrast to traditional industries, foreign entry into financial services was encouraged. Up
to 40 percent of bank assets have been controlled by foreign entities, but the share is now
declining with only Russian banks penetrating the market. Some Western banks are
downsizing their
activities , and a few at
least wish to
exit , if they only could
without losing
their past investments.
In spite of inevitably worsening demographics, a huge
pension burden was created. In a
nation of 46 million inhabitants, the pensions of 14 million pensioners grew from 9.2 percent
of GDP in 2003 to almost 18 percent in 2009. This is one of the heaviest pension burdens
9
globally, and negative demographics will
continue to worsen the situation if needed
measures , like increasing the general pension age, are not taken.
The end of cheap gas
By the mid-2000s, Russia had reached several conclusions on energy and money that
started to rock Ukraine’s
position . The much-needed energy efficiency demanded a huge change in
the
whole of economy and society—as in Ukraine—a
process known in Russia as
modernization.
The
first necessary
condition for modernization was to
raise domestic gas and consequently
power prices. A roadmap for doing that was accepted in
late 2006, and an evident
conclusion emerged. If Russians had to pay more, there was no
reason why Belarusians,
Ukrainians, and others should continue to be subsidized.
The simple Russian
proposition has had dramatic consequences for Ukraine. Ukraine’s terms
of trade would change from a windfall to a downpour of cold rain. And Ukraine had not
made the necessary domestic reforms to
prepare for such a
turn of
events .
There have been aspiring political leaders who have thought that the Russian
decision may
be turned or at least postponed by playing on the Slavic or Eurasian Union cards: Ukrainians
will continue to entertain prospects of Eastern integration if Russia continues postponing
inevitable price hikes. Trying to
avoid the price
revolution is surely seen by some inside
Ukraine as a potent argument for
joining post-Soviet reintegration schemes, like Belarus has
done .
Others in Kiev
found virtue in necessity. In the end the price revolution would
benefit Ukraine by
making long-postponed reforms inevitable. Perhaps as well, excessive
dependence on Russia could be minimized by
developing domestic
sources of energy, like
unconventional gas. Others took solace in the possibility that Ukraine’s export prices might
in the end
increase faster than those of Russia’s exports.
Possibilities for the future have been explored, but meanwhile populist policies have
continued unabated. The Yanukovych government has refused to increase gas prices for
households, as demanded by the International Monetary Fund (IMF) as a key condition for
continued financial support.
Waste of energy by households thus continues unabated. There
has also been no progress in reducing the burden posed by excessive pension expenditures
on the budget—now and especially in the future.
Debt builds
10
Compounding this was the financial crisis that rocked the international economic system in
2007–2008. Ukraine’s
lack of sound domestic economic
structures and debt
accumulation made it especially difficult for the country to weather the financial storm. Gross reserves
have grown from less than a
month ’s imports to around
five months’ worth from 2005 to
2010, still a modest level. Public and private foreign debt has recently risen fast from more
than $10 billion in 1997–2002 to over $100 billion in 2008–2009. The 2008 level was 56.4
percent of GDP and 118.7 percent of exports.
In 2009, as GDP declined and the UAH weakened, external debt stock was 91.5 percent of
GDP and 191.6 percent of annual exports—
clearly an unsustainable level for Ukraine. In late
2011, Ukraine’s official reserves were some $30 billion. Paying back its debt—barring a
further accelerated depletion of foreign
exchange reserves—would be
close to impossible
without
fresh foreign finance, preferably in the form of disbursements from the IMF.
A two-year IMF
stand -by arrangement, put in
place in 2008, provided exceptional
access to
financing that was
crucial in helping Ukraine
through the Great Recession. In
particular , it
helped to
prevent a banking crisis. In many respects, however, Ukraine reneged on its
commitments, and the
program went off-
track very soon, as a 2011 IMF evaluation
concludes. This holds for fiscal, exchange
rate , and monetary policies, but in particular for
the energy sector.
In 2008, Ukraine committed itself to phasing out all gas subsidies in three years, but little
was done on that
front . For some
specific industries, gas prices were actually decreased in
2009. Ukrainian households still pay traditionally extremely little for the gas their
everyday life depends on. At end of the year, gas prices for households accounted for about one-fifth
and those for
utilities for one-third of import prices. Officially the low gas prices are justified
as poverty alleviation, but it is difficult to imagine a less effective and less equitable pro-poor
policy.
The chart below illustrates
dynamic of gas prices in Ukraine – import
vs household prices.
11
Source: Ukraine Macro Outlook for 2013 by UkrSibbank (BNP Paribas Group)
Following this, there was little left of Ukraine’s credibility as a policy program partner. Yet,
another stand-by arrangement amounting to $15.3 billion was somewhat surprisingly
approved by the IMF on
July 28, 2010.
2013 is extremely challenging year for Ukraine in terms of servicing its debt. The table below
summarizes Ukraine’s FX (foreign currency) denominated debt repayment schedule for 2013
is billion $.
12
Source: Ukraine Macro Outlook for 2013 by UkrSibbank (BNP Paribas Group)
Not all bad news
Ukraine could be a rich country. No other European country can boast its resources of coal,
iron, gas, and rich agrarian
land . Almost three-quarters of its area is agricultural land, more
than half arable. Though the quality of legendary black earth deteriorated
during the Soviet
decades, it remains
among the best globally.
The country has some oil and conventional gas, and perhaps more importantly, possesses as
much as 4 percent of
global coal reserves. Though more than half of energy consumed is
imported, reserves of unconventional gas are estimated to be several trillions of cubic
meters in size, promising gas independence from Russia in about two decades. Indeed,
Ukraine’s growth rate in 2001–2008, boosted by exceptional improvement in terms of trade,
was fully comparable with Eurasian hydrocarbon
producers at some 7 percent annually.
Infrastructure is in spite of deterioration in relatively good
shape . The Soviet Union left
industries, for
instance in crucially important metallurgy, that are generally taken to be in
better condition than in Russia.
Ukraine was a potentially rich country made poor by a tragic history. During the years
following independence, Ukraine has grown with the region, but relative to many
expectations, this has been a bitter disappointment. Ukraine is seen as an underachiever.
Source: http://carnegieendowment.org/2012/03/09/underachiever-ukraine-s-economy -since-1991/a1nf# 13
1.1.3. Key Macroeconomic indicators For Key Macroeconomic indicators and forecasts
please refer to Appendix 1.
Ukraine’s economic sectors are
diverse , but in need of new capital and investments to
compete with sectors in the West. The country’s major export categories
include :
ferrous and non-ferrous metals,
steel products and steel structures;
chemical products (
including fertilizers;
plastics and
rubber );
agricultural products and food (mainly
grains , cereals; food
processing and packaging).
As seen from the list
above , Ukrainian economy is strongly dependent on various
commodities and as
result of price fluctuations of those commodities. Perhaps, the only
commodity group, which is in long-run
rather immune (not 100% though) to cyclical
changes are agricultural products.
Taking into account growing population
worldwide and gradual
income growth, particularly in food importing Asia and
Africa , it’s rather
safe assumption
that demand and prices for agricultural products will continue upwards trend. Ukraine with
Europe’s best and largest
areas for
agriculture is very well positioned to benefit from the
World’s growing demand for food.
Other commodities exported by Ukraine (such as steel, coal, chemicals etc) are and will
continue to be
affected by cycles of the global economy – there will be periods of growing
demand and prices hikes as well as periods of
slowing demand and declining price.
Ukraine’s dependence on energy supplies and the lack of significant structural reform have
made the Ukrainian economy vulnerable to external shocks. Ukraine depends on imports to
meet about 75% of its annual oil and natural gas
requirements and 100% of its
nuclear fuel
needs.
The
strong correlation between world commodity prices and Ukraine’s economic growth can
be seen in
Figure below.
14
A
drop in steel prices - Ukraine’s top export - and Ukraine’s exposure to the global financial
crisis because of
aggressive foreign borrowing lowered the GDP growth rate in 2008.
Ukraine reached an agreement with the IMF for a USD 16.4 billion Stand-By Arrangement in
November 2008 to deal with the economic crisis, but the program quickly stalled because
little progress was made in implementing reforms. The economy contracted
nearly 15% in
2009 - one of the worst economic performances in the world.
In April 2010, Ukraine negotiated a price discount on Russian gas imports in exchange for
extending Russia’s
lease on its
naval base in Crimea. In August 2010, Ukraine reached a new
agreement with the IMF for a USD 15.1 billion Stand-By Agreement to put the country on the
path to fiscal sustainability, reform the gas sector, and
shore up the country’s banking
system. Economic growth resumed in 2010 and 2011, buoyed by exports. After initial
disbursements, the IMF program stalled in
early 2011 due to the lack of progress in
implementing key gas sector reforms, namely gas tariff
increases (
obviously politically very
unpopular measure ).
Agriculture
fell to 9.3% of the total GDP in 2011 compared with 14% in 1999. Industry,
including
mining ,
manufacturing and
construction , continued to account for 34.7% in this
period. Meanwhile, trade and other services grew from 51 to 56.1 percent.
15
1.1.4. Foreign Direct Investments
Despite having huge potential, Ukrainian economy is critically lacking in foreign investments.
Percentage of FDI to GDP was declining very year since 2007 and, according to BNP Paribas
in Ukraine forecast, projected to continue declining during 2013-2104.
According to State Statistics
Service of Ukraine, foreign direct investment (FDI) in a form of
equity capital slowed substantially in 2012. FDI for the period of
January – September 2012
(3 quarters) amounted to USD 2.6 billion, which was 29.4% down year of a year.
Investments
came from 129 countries and regions. The ten largest
investor countries, which
account for over 82% of total FDI, are Cyprus with $15.076 billion in investment,
Germany with $7.4 billion, the
Netherlands with $5.04 billion, Russia with $3.71 billion, Austria with
$3.3 billion, the United Kingdom with $2.4 billion, the
British Virgin
Islands with $1.81 billion,
France with $1.8 billion,
Sweden with $1.58 billion, and Switzerland with $1.09 billion.
Industrial
enterprises received $16.866 billion in investment, which was 32% of total FID in
Ukraine. In particular, $13.936 billion was
invested in the processing industry $1.51 billion in
the production and distribution of electricity and gas, and the water
supply , and $1.424
billion in the mining industry.
In the processing industry the investment was
split in the following way: the
manufacture of
basic metals and fabricated metalware received $6.137 billion in direct investment, the
production of food,
beverages and tobacco got $2.995 billion, chemical and petrochemical
industry $1.321 billion,
engineering $1.156 billion, while the manufacture of other non-
metallic mineral products $1.013 billion.
Financial
institutions accumulated $15.702 billion in direct investment, which was 29.8% of
total
amount .
A total of $8.523 billion, or 16.2% of total FDI, was invested in
organizations that are
engaged in transactions with real
estate , rent and leasing, engineering, and services to
individuals, while $5.503 billion, or 10.4%, was invested in enterprises engaged in trade,
repairs of motor vehicles, household and personal goods.
Total foreign direct investment (equity and debt
instruments ) as of October 1, 2012 was
$6.252 billion.
The amount of direct investment (equity) from Ukraine in other countries as of October 1,
2012 was $6.428 billion, in particular, EU countries received $6.027 billion (93.7% of total
amount), the CIS countries $306 million (4.8%), and other countries $95 million (1.5%).
16
Direct investment from Ukraine went to 47 countries, the
lion ’s share
going to Cyprus
(90.4%). Total direct investment (equity and debt instruments) by Ukraine in other countries
as of October 1, 2012, amounted to $6.652 billion.
Source: The American Chamber of Commerce in Ukraine
The European Bank for Reconstruction and Development continues to be the largest
financial investor in Ukraine. As of January 1, 2013 the Bank has committed more than EUR
8.2 billion (USD 10.7 billion) in 318 projects. In 2012, the EBRD has invested EUR 934
million (USD 1.2 billion) in 35 projects in Ukraine. About 71 percent of the investment went
into private companies, 29 percent towards projects in the public sector. The EBRD is
committed to continue financing projects in Ukraine at
previous rate – about EUR 1 billion
per year.
Among other investors, multilateral international financial institutions (IFI) directly investing
in Ukraine are for example the IFC (the International Finance
Corporation , investment arm of
the World Bank), based in Washington DC and BTSB (Black Sea Trade and Development
Bank), regional EBRD-like institution, based in Thessaloniki,
Greece .
1.1.5. Demographics and labor force Bad news
! Declining population
The population of Ukraine is about 45 million (July 2012 est.), which is 6.3%
lower than
reported in 2001. To put the population number in prospective – Ukraine is seventh largest
country in Europe by population (after Russia, Germany, France, United Kingdom,
Italy and
Spain ).
Based on official statistics, the Ukrainian population has shrunk by 6.2 million people from
51.8 to 45 million since 1990. By contrast, the
Spanish population has grown by 8.5 million
from 38
.8 to 47.3 million people over the
same period. The
urban population is made up
69% of total population in 2010, with about 3 million people
living in Kyiv.
17
Bad news again
! Ukrainian population is not only declining, but also aging. 18
It is estimated that 77.8% of the population are Ukrainian and 17.3% are Russian. Minorities
include Belarusian, Moldovan, Crimean
Tatar , Bulgarian,
Hungarian , Romanian, Polish,
Jewish and others.
The
majority of the population is a member of one of the branches of the
Orthodox Church
(about 84%). Around 10% are
Catholic , while 4% are
Muslim , represented by Tatar who
mostly reside in the Crimea.
The labor force involved in the economy in 2011 was 22.09 million people with 15.8%; 18.5%
and 65.7% in the agriculture, industry and services sectors, respectively.
Official number
obviously does not include unofficially paid labor as well as Ukrainians working abroad and
sending their wages to support families back home.
Good news
! Among other advantages of investing in or doing business with Ukraine is its
workforce including:
High
scientific and educational potential -
powerful network of
universities and research
centers;
competitive qualified and skilled labor force.
For example, according to research company
Brain Bench, Ukraine ranks the 4th globally in
number of certified professionals in the
field of hi-
tech (being only behind United
States ,
India and Russia). (
http://www.brainbench.com/pdf/globalitiq.pdf )
1.1.6. New emerging industry Ukraine is known to
everybody as major producer of ferrous and nonferrous metals, also for
its coal mining, chemical industry, agriculture products including grain,
sugar beets,
sunflower seeds/ oil, vegetables, beef and
dairy products. It’s less known, though, as
emerging destination for Business Process Outsourcing industry (BPO).
In fact, Ukraine was ranked 32nd in Education on the
Legatum Prosperity Index of 104
countries – ahead of India, China,
Indonesia , Malaysia,
Mexico , Brazil,
Chile and other
popular outsourcing destinations. Ukraine has more than 800 universities and colleges
(
higher education institutions), over 1,000 IT companies and over 25,000
specialists involved
in IT outsourcing. According to Ukrainian Hi-Tech Initiative research, 16,000 IT specialists
graduate in Ukraine each year. Only 4,000-5,000 of them are
employed in companies that
provide professional IT services. The potential
remain huge, this number can easily be
doubled and Ukrainian government
takes strong initiative
aimed towards creating favorable
conditions for IT outsourcing business development. The chart below illustrates
development of Ukrainian IT industry measured by specialists employed in IT companies.
19
Source: Report Exploring Ukraine IT Outsourcing Industry 2012 Since year 2000 Ukraine has been one of the
leading players in software development
space and has been ranked at the top of IT outsourcing service providers in the global market.
According to BPM Watch, BPO sector (primarily in IT services) in Ukraine has grown
tremendously during the last 10 years (showing annual growth rate of 20-25%). By industry
experts estimations IT outsourcing sector reached USD 1.1 billion in 2011 (see
graph of the
volume of IT Outsorcing services 2003-2011) and
expected to
grow further in the next 5
years. Compared to other CEE countries strong in outsourcing (Poland, Romania etc as well
as Russia), Ukraine continuously reports the
highest rate of market growth.
Source: Report Exploring Ukraine IT Outsourcing Industry 2012 20
Ukraine entered the
offshore outsourcing market by providing software development
services in the early 1990s. Since then, the BPO market in the country has been showing a
steady growth as a result of demand from US and UK markets. While IT services remain to be
the main source of
revenue generation for the outsourcing industry in Ukraine, other BPO
projects like, FAO, HRO and KPO have also started to generate
considerable revenue for the
industry.
Some of the
reasons as to why outsourcing companies in Ukraine are reporting good
financial growth are discussed below:
Vast talent pool at low cost: The
literacy rate of Ukraine is 98% which is much higher
when compared to other offshore destinations. The country’s large pool of engineering
and IT talents has always been a key
factor in attracting foreign investors. Further, these
talents are available for the BPO companies at a lower cost. The salaries for the BPO
employees in Ukraine are
slightly lower when compared to other European BPO
destinations.
Cultural and physical proximity: Ukraine shares similar culture and business values with
that of US and other European countries. These prompt companies in US and Western
Europe to establish outsourcing
links with Ukraine BPO companies. The proximity in
physical
distance also
makes it a favorable near-shore destination for companies in US
and
Canada .
Political climate: Favorable political climate in the country is also a reason for the growth
of BPO sector. Recently the government as a measure to support outsourcing sector
cancelled the VAT for IT outsourcing companies and reduced their employees’ income
tax to 5%. The authorities are also very keen to
invest in infrastructure development
activities to
attract more foreign investments.
IP security : Ukraine is a country which has a high
respect for intellectual property
rights .
The country recently upgraded its IP
laws making them in par with the laws of other
developed nations.
(
http://www.bpmwatch.com/knowledgebase/know-emerging-bpo-destination-ukraine/ )
Language
skills remain the major limitation for Ukraine for BPO industry growth. In my
experience it’s very difficult to
hire a
person with right set of skills and good command in
English on top.
Seems that all foreign language speaking Ukrainians are already recruited by
call centers.
21
Regional Structure of Ukraine’s IT Outsourcing Industry
Source: Report Exploring Ukraine IT Outsourcing Industry 2012 Kiev
Kyiv region is the largest outsourcing and software development
center in Ukraine. A great
number of outsourcing companies operate
here , while 40 % of all ITO resources in Ukraine
are centered here. Kyiv boasts Ukraine’s largest IT talent pool. Currently, more than 10,000
highly qualified IT specialists are involved in the IT outsourcing sector. The city has 68
universities that prepare skilled IT personnel to provide outsourcing services.
Moreover , four
top-rated technical universities are
located in Kyiv (NTUU “Kyiv Polytechnic Institute”, Taras
Shevchenko National
University of Kyiv, National University of “Kyiv-Mohyla Academy”, and
National Aviation University).
Lvov
Apart from Kiev, I would only separately highlight Lviv, which is currently ranked as 3rd
outsourcing destination in Ukraine. Lviv, capital of western Ukraine is emerging as the
fastest growing outsourcing destination in Ukraine and one of the fastest growing in Europe.
The city of Lviv is a leading educational center in Ukraine and one of the largest in Central
and Eastern Europe with almost 40 higher education institutions, which
teach roughly
130,000 students. There are 26 top level universities, 5 of which prepare highly skilled
specialists in computer technologies. Over 1,000 IT graduates are supplied by
local 22
universities to the market annually. Currently, over 4,000 IT specialists are involved in the
Lviv’s IT outsourcing sector. According to the experts, this number is expected to grow by at
least 20 % annually, until 2015.
Comprehensive report on IT outsourcing industry in Ukraine is available for download at:
http://hi-tech.org.ua/wp-content/uploads/2012/08/Exploring-Ukraine-IT-Outsourcing -
Industry-20121.pdf
1.2. The Business Environment The World Bank and the IFC (International Finance Corporation) regularly analyze and
measure business environment in most of the countries. The
results of their research are
summarized in annual publications called Doing Business. It measures and tracks changes in
regulations affecting 11 areas in the life cycle of a business: starting a business, dealing with
construction permits, getting electricity, registering property, getting credit, protecting
investors, paying
taxes , trading
across borders, enforcing contracts, resolving insolvency and
employing
workers .
These publications
rank countries world-
wide (across 185 economies) by how easy of
difficult to
open and run a small to
medium -size business complying with
relevant legislation . Doing Business 2013 country specific reports, are available for download on the
Doing Business
website at
http://www.doingbusiness.org According to Doing Business 2013, Ukraine ranks 137 in the world on the
ease of doing
business benchmark.
Good news
! Ukraine’s rank improved 15 places
compare to 152 in 2012.
23
Source: Doing Business database.
The increase of Ukraine’s rank measured by Doing Business methodology is to great extent
related to gradual improvement of regulatory environment. Please review Appendix 2 for
Summary of Doing Business indicators for Ukraine. The summary compares Ukraine with the
closest peers and Best Performers globally.
In real life, however,
decisions to enter a new market or to start a business in a new country
are often made by businessmen taking into account other measures and factors, such as size
and proximity of the new market, expected demand, ease and cost of
logistics , price
arbitration , closeness of culture and
traditions etc. Quite often those reasons could also be
emotional like “jumping on bandwagon”, for example, fellow businessmen are running
successful operations in the
given market, a market growth or its size providing excessive
optimism, real estate
bubble etc.
Nevertheless, careful
study of the business and regulatory environment is by no
means less
important than a market research. Although, ranks and indicators of Doing Business
database and similar
studies might
seem like dry
figures , they do provide first information on
what to
expect when doing business in a country such as Ukraine or Belarus.
24
Having said that, I do not suggest, that a decision for a new market expansion, or investing
into foreign country should be based primarily on its rank of ease of doing business or
maturity of its business and regulatory environment. Very often business reasons
overweight in decision making. New markets may provide opportunities for foreign
businessmen via larger consumer base, market consolidation potential, low market
saturation or low-level consumption of a product, providing
therefore potential for growth
and so on. Yet, again, thorough
knowledge of the country’s business and regulatory
environment helps to
adjust expectations accordingly and start business prepared to what
otherwise might be costly surprise.
The above said is very true in
case of Ukraine and Belarus. These markets, Ukraine in
particular, attracted since its Independence and continues attracting a lot of
interest from
foreign investors. Complicated and often confusing business and regulatory environment,
official bureaucracy,
corruption and so on remains significant obstacles for foreign investors
and businessmen. Some have been successful and some decided to
pull out from Ukraine.
Corruption
Corruption in Ukraine remains significant problem for businesses and the country’s image in
general. Ukraine was ranked 144th on the Corruption Perceptions Index 2012, compiled by
Transparency International, a global anticorruption non-government organization. Ukraine’s
rank slightly improved compared to 152 in 2011. For
comparison , Russia ranks 133d, Belarus
123d, Moldova 94th and Georgia 51st.
The index scores 176 countries and territories from 0 (highly corrupt) to 100 (very clean)
based on perceived levels of public sector corruption. Corruption Perceptions reports by
Transparency International are available at:
http://www.transparency.org/cpi2012/results 25
Source: http://www.transparency.org/cpi2012/results
Corruption in Ukraine significantly affects investment climate in the country as well as
foreign investors’ appetite towards investing in Ukraine. The EBRD, which is the largest
foreign investor in Ukraine, is
putting a lot of efforts and
pressure on Ukrainian government
and the
President trying to achieve commitment from government officials to fighting
corruption on all levels.
Please watch - EBRD President Suma Chakrabarti: Corruption in Ukraine must be fought on
all levels at
http://www.youtube.com/watch?v=MuFv1FtADUg 26
1.3. Banking system As of January 1st, 2013, Ukrainian banking system
consists of 175 banks. Despite significant
number of banks, the banking system is reasonably concentrated – assets of Ukraine’s 10
largest banks (measured by total assets) provided 53% of the banking system total assets as
of January 1st, 2013. Assets of Ukraine’s largest bank, Privatbank, were 15% of total assets in
the banking system as of January 1st, 2013.
Source: National Bank of Ukraine. http://www.bank.gov.ua
Foreign (European) interest in Ukrainian banks peaked during 2005-2008, with a
wave of
high-profile acquisitions on Ukrainian banks by European counterparts. Since 2009, more
and more European banks have left Ukraine, including ING Bank, Home Credit Group, Сredit
Europe Bank, Societe Generale, Volksbank International and
Swedbank . SEB Bank
sold assets to a Ukrainian businessman, and other banks simply left the retail market. The
outflow of foreign capital is having a
heavy impact on Ukraine’s banking system.
The 2006-2008 credit boom and the surge of loans issued in foreign currencies were fuelled
by cheap European money. However, the 2008-2009 crisis showed that the presence of
private Western banks in Ukraine was a vacation from bigger troubles rather than a burden
for the Ukrainian market. Capital inflow from Europe changed the
face of the Ukrainian
banking system for the better by improving bank service culture and
giving Ukrainians
broader access to loans than they had ever had. The tables turned when foreign banks
began to
lose ground to captive banks
owned by oligarchs that mostly lend money to their
own companies. This is a
sign of the growing strain on business in Ukraine.
The
massive inflow of European banking groups to Ukraine had a largely favorable impact on
the economy. Unlike the mining industry, where most FDI
comes from the oligarchs’
repatriated profits, European newcomers in the banking sector brought along new foreign
direct investment. According to the National Bank of Ukraine, only 7.7% of the cumulative
FDI into the share capital of Ukrainian companies went to the financial sector in 2004. In
2008, the figure was almost 30%. Over 2006-2008, nearly 42% of the $26 billion foreign
direct investment in Ukraine went to the financial sector as foreign interest in Ukrainian
banks peaked. European groups did not abandon their subsidiaries during the crisis. In 2009-
2010, they invested over UAH 17bn of new share capital in the Ukrainian banking sector,
which was 67% more than what the owners of local banks invested.
Another obvious
effect was the unprecedentedly broad access to retail lending available to
average Ukrainians from 2005-2008. The mortgage
loan portfolio alone swelled sevenfold
over 2007-2008, even though foreign banks preferred to place foreign exchange risks on the
27
borrowers. They issued the
greater share of mortgage loans in dollars. As a result, the
amount of bad loans soared in 2009-2010.
The inflow of European banks had a great
indirect positive impact on the banking sector and
Ukrainian economy
overall . First, they brought in new standards of corporate governance
and customer service. European banks in Ukraine have
clear rules for risk
management which, if violated, may result in the
firing of the local executives. Thus, a foreign bank will
never pick up deposits from the retail market to further
issue them as loans to
linked companies. By contrast, quite a few of their Ukrainian peers eagerly do this, revealing their
likely
status as captive banks of big business groups.
The owners of European banks are groups that have no companies in other industries. Their
interests lie in the
orbit of the banking business. It is
hard to imagine a situation where a
parent bank based in Europe instructs its Ukrainian subsidiary to issue a loan to a specific
company or to overlook the rules for issuing loans to one borrower or associated entities.
Unlike them, most bank owners in Ukraine have other
primary businesses and use their
banks as donors more than anything
else in times of crisis. Officially, they comply with the
NBU’s restriction on lending more than 25% of the regulatory capital to one borrower. Yet,
some sources suggest that the real level of
insider lending in some captive banks may exceed
50% of the total loan portfolio. The regulatory
authority does not
monitor the entities of big
business group owners deeply enough to determine this.
28
Source: www.ukrainianweek.com The
intense increase of the European share in the Ukrainian banking system over 2005-2008
has essentially squeezed captive banks to the sidelines. Some oligarchs even gradually
switched to using
universal European banks with high standards to service their companies.
It was definitely cheaper for them compared to maintaining and developing a bank of their
own.
Since 2010, Ukraine has seen a reversal of the European banking trend. The growing
pressure on businesses and resurgent fear of property loss have
once again fuelled the
demand for captive banks, just as they did in the 1990s and early 2000s. In a
prime example,
a
German group recently sold its Ukrainian bank to a local oligarch. On the whole, the share
of private Western banks save for state-owned Russian banks shrank from almost 42% in
early 2009 to 25% in the first half of 2012, mostly in
favor of local Ukrainian banks. A few
more banks with European capital may end up in the
hands of Ukrainian owners by the end
of 2012.
29
Source: www.ukrainianweek.com The expansion of Russian state-owned banks including VneshEconomBank (VEB), VTB and
others, has been a separate trend. State-owned banks operate in many countries and help
the government to
perform some
social functions . Obviously, Russian state-owned banks
have provided much broader access to loans for mostly big Ukrainian companies. This was a
positive
contribution to Ukraine’s economy. One of Russia’s most proactive banks is VEB
which is, in fact, a
quasi -bank regulated by a special federal act. Whenever a European
government becomes a
shareholder of a bank, it
sets some restrictions on the growth of its
assets, sometimes pressuring the bank to quit risky foreign markets. Quite the opposite for
Russian state-owned banks: they are actively expanding abroad thanks to financial resources
granted by the government at prices below market value. Essentially, this means that they
are building
networks in other countries at the expense of Russian taxpayers.
30
The financial sector is typically a
barometer for changes in long-term
investment expectations for Ukraine.
Even though foreign capital had been
present in Ukraine’s banking sector
before the 1998 crisis, 2005 proved to be
the real breakthrough year. Driven by
post-Orange Revolution exuberance,
European banks began to buy Ukrainian
banks one after another, often paying
sums that were several times higher
than what the actual assets of the banks
were worth at the time. In 2007, at least
10 Ukrainian banks found themselves in
the hands of foreign owners. Good deals
turned Ukrainian oligarchs into
dollar billionaires overnight – mostly because
of the overheated banking sector. The
prices paid for banks ranged from 2.6 to
almost 5 times their equity value – the
latter was paid for Praveks Bank. To
justify the gargantuan prices, the
purchased bank was expected to provide
sustainable
rapid growth in assets at
over 12% annually, a 20% annual ROE
increase and a 15% equity value growth.
The 2008-2009 crisis proved that these
had been unrealistic expectations.
Source: www.ukrainianweek.com Currently Ukrainian economy is on credit-based diet. Post-crisis, availability of debt in
Ukraine is very low. The credit diet resulted in inflation in Ukraine in 2011 slowing to 4.6%
from 9.1%, and consumer prices in January-November 2012 dropped by 0.4%.
On the other
hand , availability of credit is as much important for growth of economy as
blood flowing though human
body for life. In Ukraine, though, growth of total sum of loans
in economy was less than 3% in 2012. For comparison - the total growth of loans in 2006 was
31
71%, in 2007 it was 74.1%, in the crisis year 2008 it was 71.9%. Even in 2011 this indicator
looked much better, being 9.6% up.
In practice, small and medium-size enterprises in Ukraine have minimal access to bank
financing. As a consequence of the weakness of the steel industry and the near absence of
financing for small and medium-
sized enterprises, output contracted during the second half
of 2012. Even Prime Minister Mykola Azarov no longer expects growth in 2013.
As the result, the country has seen a triple deficit in 2012. As a result of a smaller economic
growth, the budget deficit in 2012 is expected at 2.6% of GDP, which is higher than the
target fixed at 1.7% of GDP. The current account deficit in January-November 2012 was
$12.443 billion, being 38% up year-over-year. The deficit of the balance of
payments over
the period grew by 41% year-over-year, to $3.336 billion.
1.4. Starting a business in Ukraine Good news
! As the table below
shows , Ukraine developed a long way in improving
regulatory environment for starting a new business (
legal entity). Number of procedures,
time and cost of starting up the business decreased very substantially during last ~ 10 years.
Moreover, currently there is no minimum share capital requirement for LLC (most commonly
used form of business ownership).
Source: Doing Business database.
To
improve its competitiveness for investors, Ukraine has lately introduced a series of
legislative changes aimed at simplifying the start-up and conducting business. The changes
include the following:
establishment of a “one-stop shop” for corporate registration;
online access to the Unified State
Register (country-wide list of business entities and
individual entrepreneurs) and the Unified License Register;
32
abolishment of the
permit requirement for company seal production, and of the
requirement to notarize copies of
documents for registration
purposes ;
adoption of the model
charter , and
moderate simplification of the liquidation procedures.
Some of the declared changes are yet to be made operational (e.g., online corporate
registration). In
addition , mandatory licensing or other state authorizations were abolished
in many industry sectors; the “
silent consent”
concept and the declaratory principle (which
implies a company may undertake certain
types of business
upon making a relevant
declaration to the state authorities) were implemented instead of some licenses and
permits. In particular, procedures for obtaining a construction permit were simplified
significantly.
Source: KPMG. Your Business in Ukraine 2012
1.5. Market entry strategies Foreign investors can
consider the following options for entering the Ukrainian market:
direct sales;
agency and commission arrangements;
joint venture with a Ukrainian partner;
representative office and
Ukrainian subsidiary.
The choice made by the foreign investors is usually motivated by the incorporation and
maintenance costs (if any), as well as the legal and tax risks involved.
1.5.1. Direct Sales The simplest
option for entering the Ukrainian market (or majority of foreign markets for
that
matter ) is by way of direct sales contracts. A foreign legal entity which sells goods or
services to customers (or distributors) in Ukraine directly from abroad would not be
subject to Ukrainian taxes. Depending on the agreed terms of
delivery , the Ukrainian customers (or
distributors) would be responsible for customs clearance and would have to pay customs
duties and taxes (import VAT, excise) (if any).
A properly drafted
cross -border contract allows a foreign company to avoid taxation in
Ukraine. The possibility to
choose the foreign (likely domestic) law as the
governing law of
the contract makes direct sales a viable option for business. However, in choosing the
foreign law, the public
order rules and imperative norms of Ukrainian laws (e.g., currency
control regulations, etc.), must be complied with.
33
1.5.2. Agency and Commission arrangements Agency and commission contracts present another comfortable alternative for structuring
business in Ukraine. From a legal standpoint, such arrangements
allow a foreign company to
carry out commercial activities in Ukraine without
setting -up
permanent establishment in a
form of corporate
vehicle , employing personnel,
meeting accounting and reporting
requirements, as well as bearing all associated costs and risks.
Nevertheless, from a tax perspective, risk remains, that agency and commission contracts
may trigger taxation in Ukraine, specifically when an
agent acts exclusively on behalf of a
particular foreign company, and the supply of agency or commission services does not
constitute its
core business (e.g., as may be the case for securities,
insurance brokers).
Agency and commission contracts for activities of a preparatory or auxiliary
nature (such as
market research and
analysis ) should not generally create a permanent establishment of the
foreign entity, and
hence its profits would be taxed only in the country of tax
residence .
1.5.3. Joint venture with a Ukrainian partner Per the Ukrainian laws, a foreign investor is granted the right to enter into a joint venture
with a Ukrainian partner (formally referred to as “a joint
activity agreement”, which can take
the form of a simple partnership agreement, a joint production, or a joint co-
operation agreement with a Ukrainian partner(s)). Investment of this kind is subject to state
guarantees and should be registered with local state authorities of Ukraine.
1.5.4. Representative office (commercial and non-commercial) Day-to-day business in Ukraine can also be carried on through a representative office (“RO”).
A RO is not a legal entity but a
division of a foreign company registered in Ukraine. Its head
office assumes all rights and obligations of the RO and bears the liability for its
actions .
A RO which carries out commercial activities in Ukraine is deemed to be a commercial RO
(which in
different jurisdictions is called a “
branch ”) and triggers a permanent establishment
of the foreign company for tax purposes. This, in turn, implies that, if a relevant
double tax
treaty is in place between Ukraine and the foreign company’s tax residence jurisdiction, only
a portion of the company’s profits, which are attributable to the RO, will be taxed in Ukraine.
A RO which undertakes activities of a preparatory or auxiliary nature usually does not create
a permanent establishment and is not subject to corporate income taxes in Ukraine.
Generally, a RO would be subject to registration in the Ministry of Economic Development
and Trade, the State Tax Service, the State Statistics Services, and the State Pension Fund. A
34
foreign bank’s RO
shall be registered with the National Bank of Ukraine. However, the list of
registering authorities may be
expanded due to specific industry particularities. The
registration period takes up to 3 months following
submission of all necessary documents.
The
preparation of documents may take additional time as in many
cases they would
require approval , notarization, and/or legalization.
1.5.5. Ukrainian subsidiary A foreign company may choose to establish a Ukrainian subsidiary for doing business in
Ukraine. A Ukrainian subsidiary controlled by foreign companies or nationals, generally
enjoys the same legal treatment as legal entities without foreign participation. Such
company, with minor limitations justified by national interests, may enter into agreements,
assume legal obligations, acquire property, as well as sue and be sued in its own name. It
may
engage in any commercial activity envisaged in its charter (
articles of incorporation).
It’s important to
note that non-
resident entity (foreign) or 100% owned Ukrainian subsidiary
of non-resident
cannot own land in Ukraine. A non-resident or 100% owned Ukrainian
subsidiary of non-resident, can on the other hand, own land if the land is
part of a property –
real estate
object , which has a registration in Real Estate Register. From my personal
experience, I can suggest that in case a non-resident company or 100% owned Ukrainian
subsidiary of non-resident company must acquire a land in Ukraine, the limitation can be
solved by
selling 0.01% ownership to a resident company or physical person – usually a
trustable
manager or
lawyer . We have been advised by local legal counsel this structure (and
it indeed worked out) when local 100% subsidiary of the
client of mine was acquiring a land
plot for a Greenfield
factory construction
project . Following completion the project, the
factory was registered in real estate register (including the land plot) and the above
mentioned structure was not
anymore required .
1.6. Foreign investment treatment Most business areas available on the Ukrainian market are open to foreign investors.
However, foreign investors’ access to certain economy sectors is forbidden or restricted,
namely:
in the media industry, foreign investors are not
allowed to be founders of
television and
radio companies or sole founders of information agencies; the share of foreign
investments in a Ukrainian information agency may not exceed 35 per
cent ; foreign
investors may not
hold more than 30 per cent of shares in a Ukrainian publishing house;
foreign investments are prohibited in the armament, explosive,
launch vehicles
development, production and
handling industry, as well as in other areas of national
interest;
foreign investors may not own agricultural land in Ukraine (even if they inherit it).
35
In addition, foreign investors who wish to acquire/increase a significant
shareholding in a
Ukrainian bank are required to submit some additional documents before approval by the
National Bank of Ukraine may be granted.
The Law of Ukraine “On Foreign Investment Treatment” defines “foreign investment” as an
investment made by a foreign investor (foreign individual or company) in compliance with
the Ukrainian laws for
profit generating purposes or for achieving a social effect. Under the
Ukrainian investment laws, foreign investments may be made in a variety of forms,
including:
establishment of a company (“Greenfield investment”) by the foreign investor
solely or
jointly with a Ukrainian partner;
acquisition of stock (shares) in an existing Ukrainian company (a Ukrainian company with
foreign investments constituting at least 10% of its share capital is deemed to be a
“company with foreign investments”);
acquisition of other types of securities (except for promissory
notes );
acquisition of movable or immovable property in Ukraine;
acquisition of the right to use land and/or to
exploit natural resources;
joint venture with a Ukrainian partner (not associated with incorporation).
Generally, registration of investments is not required, but might be advisable in certain
instances. For instance, if a foreign investment is made in kind (i.e. as a contribution of fixed
assets into share capital) the contributed fixed assets may be exempt from import customs
duties provided the relevant investment is registered with the Ukrainian authorities.
In practice, though, in-kind contribution of fixed assets (typically machinery & equipment ) to
be exempt from import duties requires a lot of work with customs officials and submitting a
lot of various documents. It can be especially challenging if equipment is being imported in
Ukraine in several deliveries. In my experience, we have managed to organize delivery of the
equipment efficiently to avoid keeping the trucks at the customs for long time. The trick for
us was to get one unified custom code for the entire equipment for the factory. In such case
in-kind contribution will be exempt of customs duties. Custom duties on various products vary
between 4 and 8%, so doing extra work with customs may be worth it, depending on size of
the investment.
However, if the assets invested are
disposed of within three years following the
date they
have been recorded in the
books of the Ukrainian entity, all
applicable import duties should
be paid to the Ukrainian budget.
36
In general, the Ukrainian investment
protection legislation stipulates national treatment for
all investors and investments in Ukraine (with some
exceptions imposed by specific laws).
Domestic legal safeguards available to foreign investors include:
“grandfather
clause ” against
adverse changes in the basic legal treatment of investments
(as set out in the law of Ukraine “On Foreign Investment Treatment”);
prohibition of nationalization;
prohibition of expropriation not justified by evacuation / rescue measures taken in
connection with disasters, accidents or epidemics, as well as judicial redress against a
decision to expropriate the investment;
expedient, adequate, and effective compensation for damages (including
lost profits and
non-pecuniary damages)
incurred as a result of actions or omissions of the state
authorities and their officials, as well as compensation for the value of the expropriated
investment;
time limitation (6 months) for
return of the investment (including profits gained), etc.
In practice, though, it might be difficult to
challenge actions or omission committed by the
state before national courts.
Ukraine maintains more than 50 bilateral investment treaties (“
BITs ”) concluded with
countries from the
Americas , Europe, Asia, etc (including with Estonia since 1995). In line
with modern international practice, BITs sustain an effective
tool in the hands of foreign
investors to defend themselves against arbitrary and discriminatory measures of the state
authorities. Most of Ukraine’s BITs
contain clauses granting a “most favored nation”
treatment and national treatment to foreign investments and investors.
Importantly, Ukraine has acceded to the 1965 Washington
Convention on the Settlement of
Investment Disputes between States and Nationals of Other States, which provides an
opportunity for foreign investors to challenge actions of the state before the International
Center for Settlement of Investment Disputes (“ICSID”). For certain advantages of the ICSID
proceedings, see
Section “Dispute Resolution” below.
1.7. Corporate forms Common corporate structures – pros and cons
In Ukraine, common corporate forms are a limited liability company (“LLC”) and a joint stock
company (“JSC”), which are to some extent are comparable to Estonian forms OÜ and AS.
Ukrainian laws provide for certain other corporate structures, which are rarely used due to
their undetermined legal status or practical inefficiency.
Registration 37
Unlike an LLC, a JSC is entitled to issue shares which are subject to registration with the
National Securities and Exchange Commission (“Securities Commission”). Due to this
peculiarity, the timing for registering an LLC is shorter (3-4 weeks) than for a JSC (2-4
months).
In the majority of cases, foreign businessmen
prefer to set up an LLC rather than a JSC, in
Ukraine. Similarly to a JSC, the liability of LLC’s shareholders (participants) is limited to their
investment in the share capital. In addition, requirements as to the incorporation and
operation of an LLC are simpler and more straightforward than those of a JSC. A Ukrainian
company (either LLC or JSC) should be registered with the state registrar, tax, social security
and statistical authorities.
Number of shareholders
An LLC may be established by a sole shareholder unless the latter itself is
held by a sole
shareholder. A person is not allowed to be a sole shareholder (
participant ) of more than one
LLC.
Interestingly enough Ukrainian legal system allows avoiding these limitations by splitting
ownership to 99.99% and 0.01%,
as learn from personal experience.
When the number of LLC shareholders exceeds 100, it shall be transformed into a JSC. A JSC
may be either public (when its shares are traded publicly) or private (when its shares are
privately held).
Minimum share capital
Currently, there is no minimum share capital requirement for an LLC. Founders of an LLC
should contribute 100% of the declared share capital in
cash or in kind within one year from
the date of incorporation. Otherwise, the declared share capital needs to be reduced. In case
at a
later stage an LLC would be willing to raise capital through an IPO, or in case the number
of participants (shareholders) exceeds 100, its reorganization into a public JSC will be
required.
The minimum share capital of a JSC is set at 1,250 minimum monthly salaries as set by the
state (as of 1 January 2012, UAH 1,341,250,
circa USD 168,000). Shareholders of a JSC shall
pay their shares in full before the company’s state registration.
Governing bodies
An LLC should have at least three
internal bodies, namely:
general meeting of participants;
38
board of directors (or a single director), and
controlling body – an
audit committee .
An external audit is generally not mandatory for an LLC.
A principal JSC’s decision-making body is a general meeting of shareholders (“GMS”), which
has the
ultimate authority to
resolve issues arising in the course of the JSC’s business. GMS
may
alter the JSC’s charter and bylaws, change its share capital,
elect members of the
executive body, approve annual reports, and adopt decisions on reorganization or
liquidation.
A JSC’s executive body responsible for day-to-day management of the JSC’s business is a
board of directors or a sole director. A JSC that has 10 or more shareholders must also have
a supervisory board responsible for monitoring the activities of the executive body and
protecting the rights of shareholders.
Finally , a JSC should have an audit committee (internal
auditor) within its corporate structure.
A public JSC should arrange for an annual external audit of its financial statements and file
the audited financial reports with the Securities Commission. Any JSC is required to arrange
for an external audit upon request of the shareholder(s)
holding at least 10% of its shares.
1.8. Taxation 1.8.1. Corporate income tax (CIT) Good news
! As of January 1, 2013, a basic CIT rate is 19%. The basic CIT tax rate is set to
decrease gradually to 16% as of January 1, 2014.
Agricultural businesses may qualify for a reduced CIT rate and are subject to a favorable tax
regime . Special tax treatment also applies to insurance companies.
In Ukraine, CIT administration is centralized, no additional corporate profits taxes are
imposed at regional or local levels. CIT is calculated on a self-assessed and currently adjusted
basis , for each reporting period. One quarter (three months) is a standard tax reporting
period for CIT purposes. CIT
returns should be filed quarterly based on cumulative results,
within 40
calendar days following the reporting quarter. The annual CIT tax return (for the
whole financial year ending December 31) shall be filed by February 9 of the following year.
Source: KPMG. Your Business in Ukraine 2012
Taxable base
39
CIT is levied on the gross worldwide income of tax residents of Ukraine and on Ukraine-
sourced income of non-residents of Ukraine. The taxable base for CIT is calculated as an
adjusted gross worldwide income less deductible
expenses , which account for tax
depreciation allowances. The gross worldwide income includes any income from the
sale of
goods/
works / services, capital gains, foreign exchange gains, free-of-
charge transfers and
other taxable receipts in cash, in kind, or in form of intangibles accrued within the reporting
period.
Ukraine uses an
accrual method for tax accounting. Income is realized in the tax period when
the transfer of ownership title to goods/services/works occurred, while deductible expenses
(
forming the cost of production) can be recognized on the date when the relevant
goods/services/works were supplied.
Source: KPMG. Your Business in Ukraine 2012
Income exempt from CIT
The following types of income are not
included in the taxable profit:
capital contributions in equity;
contributions in cash or in-kind under contracts of joint activity to be conducted in
Ukraine (without incorporation n Ukraine);
share premiums realized by the issuer;
dividends received from residents of Ukraine and nonresidents under the
recipient ’s
control, etc.
Tax breaks
The Tax Code provides a number of tax incentives and tax
holidays for different businesses,
including for small companies. In particular, companies
incorporated during the period from
1 April 2011 to 1 January 2016 will be entitled (subject to certain limitations) to a
zero CIT
rate provided that their aggregated annual income does not exceed UAH 3 million, and the
accrued monthly salary of each
employee is not less than 2 minimum wages over the
reporting period.
Starting from 1 January 2011, 3-, 4-, and 5-
star hotels are offered full CIT exemption for a
period of 10 years. In addition, the same grace period for CIT purposes is granted to
enterprises of consumer (textile, shoe) and
ship and aircraft construction industries.
Allowable deductions
From a CIT perspective, most business-related expenses are deductible for tax purposes,
except for expenses
whose tax deductibility is limited (e.g., costs incurred for the renovation
40
of fixed assets; interest payable to related non-residents; royalties paid to non-residents) or
disallowed (e.g., contractual penalties; costs of receptions, celebrations and similar events;
expenses not connected with business activity).
Fees paid to non-residents in deemed tax havens
A restriction on tax deductibility applies to fees paid to non-residents in deemed tax havens.
Such payments, provided that they are in principle allowed for tax
deduction , may only be
deducted at 85 per cent of the total amount. Certain payments (for consulting,
marketing ,
advertising services) made to non-residents located in tax havens may not be deducted at
all. The list of tax havens is adopted by the Cabinet of Ministers of Ukraine. Currently, it
includes, the
Jersey Island , the British Virgin Islands, the Cayman Islands, the
Bermuda Islands, and the
Isle of Man.
Interest
Interest paid or payable is usually deductible for CIT purposes provided that the borrowed
funds are used in the business activities of a Ukrainian company. However, in certain
instances the tax deductibility of interest can be limited (e.g., when paid or payable to non-
resident shareholders, which own or
manage at least 50% of the taxpayer’s share capital).
Interest expenses disallowed for tax deductibility can be carried forward to subsequent tax
periods.
1.8.2. Withholding Tax (WHT) Any income received by and paid to a non-resident company is subject to a withholding tax
(“WHT”) in Ukraine at a rate of 15 per cent. Such income includes,
inter alia, dividends,
interest, royalties, capital gains, lease payments, brokerage and agency commission, etc.
Income received as
consideration for goods/services/works provided to a resident is mostly
WHT exempt. Different WHT rates apply to certain types of non-resident’s income (e.g.,
freight, insurance premiums paid abroad and advertising fees).
Double Taxation Treaties
Ukraine has a moderately well-developed network of effective double taxation treaties.
Some of the treaties were concluded in the times of the USSR and remain effective for
Ukraine (by virtue of state succession rules). One of them is the Ukraine-Cyprus double
taxation treaty, which is popular with foreign investors in Ukraine.
Provided that a non-resident income recipient is a
beneficial owner of the Ukraine-sourced
income and the relevant confirmation of its tax residency is provided to the person making
41
the
payment from Ukraine, the applicable WHT rate can often be reduced or mitigated
based on the double taxation treaties entered into by Ukraine. For the list of effective
double taxation tax treaties, as well as the current WHT rates please see the Chart of
withholding tax rates in Appendix 3.
1.8.3. Value Added Tax (VAT) In general terms, VAT is levied on the supply of goods and services in the customs territory
of Ukraine and on the importation of goods and services to Ukraine at a rate of 20 per cent.
VAT rate for export of goods and services is zero.
Good news
! Starting from January 1, 2014, the VAT rate will be reduced to 17 per cent.
VAT registration (i.e. registration as a VAT
payer ) is compulsory for all Ukrainian companies,
individuals and permanent establishments of non-resident companies who qualify as VAT
payers (i.e. whose volume of transactions subject to VAT exceeds UAH 300,000 (circa USD
37,500) for any preceding 12 months of operation).
Voluntary registration as a VAT payer is also possible under the current legislation (e.g.,
when the company’s share capital or balance sheet value of all assets exceed UAH 300,000).
VAT reporting
For VAT purposes, the reporting period is a calendar month. VAT payers are required to file
VAT returns within 20 days following the end of the reporting month. VAT payable, if any,
should be remitted to the budget within 10 days following the
filing deadline , i.e., within 30
days following the end of the reporting month.
VAT mechanism
The amount of VAT which a registered VAT payer incurs on local purchases of goods and
services (so-called input VAT or VAT credit) can be credited against the VAT liabilities of this
taxpayer in computing the
final VAT payable to (or refundable from) the budget. The input
VAT amount in
excess of the VAT liabilities may be used to offset VAT liabilities of
subsequent tax periods or refunded in cash.
Bad news
! In reality, refund of prepaid VAT is being one of the major problems for
businesses in Ukraine for decades. The State is just not able to refund prepaid VAT to the
business. There is no mechanism to offset prepaid VAT against other taxes (CIT or payroll
taxes). Prepaid VAT can only be offset against VAT liabilities to the State. In many cases such
42
offset may take months and years. Needless to say that inability of the State to refund
prepaid VAT is one of the key factors limiting FDI in Ukraine.
Obviously, Ukrainian exporters, for example steel producers, are the most affected by such
situation. But this problem affects many businesses in Ukraine resulting to washing out
companies’ working capital and adding pressure on liquidity. The situation resulted in many
companies in Ukraine going out of business exclusively due to VAT refund problem.
The Group I’m advising was involved in construction and launch of brand new production
plant in Ukraine. The process took approximately 1.5 years and the budget was EUR 6
million. During the construction and installation process we have paid well over EUR 1 million
of VAT, which the Group had to finance entirely. We estimated that it will take the plant
approximately 2 years since launch its production and sales to offset the VAT paid on
purchase of equipment and construction.
By estimation of the Federation of Employers of Ukraine, VAT refund debt (essentially
money borrowed by the State) to companies amounted to about USD 4 billion by the end of
2012. The situation is additionally complicated by the fact that Ukrainian state simply does
not have money to be able to refund to businesses. There are ongoing discussion between
the State and business lobbyists in favor for issuance of VAT bonds, securities which will be
issued to companies to cover VAT refund. Such VAT bonds would theoretically have a
secondary market in which companies would trade (or use as
collateral for bank loans) these
bonds with certain discount to turn prepaid VAT into cash.
1.8.4. Transfer Pricing (TP) Ukraine applied new transfer pricing rules as from January 1st, 2013
Prior to 2012, Ukraine had not been overly concerned about transfer pricing issues. But
recently, in the era of fiscal deficits, the Ukrainian government has been more
focused on
implementing transfer pricing compliance
practices in
accordance with
OECD member
countries.
In line with a wider
amendment of its Tax Code, Ukraine has updated its transfer pricing
rules. The latter came into effect as of 1 January 2013 and are based on the OECD Transfer
Pricing
Guidelines . As of now, transfer pricing rules should be
observed in certain types of
transactions (free-of-charge and barter transactions, transactions with non-residents of
Ukraine, with most individual entrepreneurs, other persons qualifying for a reduced tax rate,
as well as in transactions between affiliated persons).
43
For CIT purposes, the arm’s
length pricing rules are deemed to be met when the
difference between the contractual and the market price is 20 per cent or less. Updated transfer pricing
rules came into effect as of 1 January 2013. But so far, there is no clarity as to how strictly
these rules will be enforced by the Ukrainian tax authorities.
Although there is no yet official requirement for transfer pricing documentation but it might
nevertheless be advisable to have documentation prepared for controlled transactions (in
Ukrainian or Russian language) in line with the new rules since these new and more
sophisticated transfer pricing regulations will likely increase scrutiny from the Ukrainian tax
authorities. It’s advisable for Ukrainian subsidiaries of international companies to
develop transfer pricing documentation with a help of or at very minimum with review by auditors.
1.8.5. Personal taxation In Ukraine, individuals are subject to Personal Income Tax (PIT), regardless of whether they
are tax residents or not. Individuals – tax residents of Ukraine are taxed on their worldwide
income, while non-residents are taxed on their Ukraine-sourced income only. Ukrainian laws
determine Ukraine-sourced income as income derived by an individual as a result of any
business activity performed in Ukraine, which, inter alia, includes remuneration for the work
performed in Ukraine, whether paid by a Ukrainian or a foreign company.
According to the Ukrainian law, an individual can be
considered as a tax resident of Ukraine
if he/she meets the Ukrainian tax residency criteria, which are as follows:
An individual is considered a Ukrainian tax resident if he/she has a domicile in Ukraine;
If the individual also has a domicile in another country, the individual is deemed to be
resident of Ukraine provided he/she has a permanent place of residence in Ukraine;
If the permanent place of residence is also available in another country, the individual is
deemed to be resident of Ukraine provided his/her center of vital interests is
situated in
Ukraine;
If it is not possible to determine the actual center of vital interests, or if the individual
does not have a permanent place of residence in any country, the individual is deemed
to be tax resident of Ukraine if he/she stays in Ukraine in excess of 182 days during a tax
(calendar) year.
In Ukraine, both resident and non-resident individuals are taxable at same tax rates being
15% and 17%:
15% rate applies to monthly income up to a threshold of 10 minimum wages per month
(in 2012, UAH 10,730, circa USD 1,340)
17% rate is applicable to monthly income in excess of a threshold of 10 minimum wages
per month.
44
Social security contributions
In addition to PIT, remuneration, allowances and similar payments made to employees
(either Ukrainian or foreign nationals) through payroll of a Ukrainian entity or a local
representative office are subject to the unified social security contribution (USS), which is
due from both the
employer and the employee. Only foreign individuals working in a foreign
company’s representative office are not subject to USS.
The taxable base for USS is capped. As of 1 January 2012, the cap is UAH 18,241. USS due
from the employee is withheld at source of income. The employees’ contribution is 3.6%
based on the gross remuneration/cap. USS due from the employer is payable at the time
when the remuneration is paid. Employers’ contribution
ranges from 36.76%–49.7% of the
gross income/cap, depending on the level of occupational risk.
1.9. Financial Reporting With effect from 1 January 2000, Ukraine implemented the National Accounting Standards
(“NAS”), which are primarily based on the International Financial Reporting Standards
(“
IFRS ”), but with certain
differences .
The principal
features of NAS are as follows:
financial statements with itemized schedules are prepared using state approved forms;
foreign-owned Ukrainian entities must adopt and
follow the Ukrainian chart of
accounts and accounting principles for
statutory reporting (but simultaneously may use their own
chart of accounts for management reporting purposes);
the accounts must be prepared in compliance with the chart of accounts and directions
for making entries according to NAS;
all “local” accounting material must be in Ukrainian language;
UAH is the basic accounting currency unit. Any transactions denominated in foreign
currency must also be recorded separately in UAH (generally at the rate of exchange on
the date of the
transaction ) for the statutory accounting and tax purposes;
the financial year of a Ukrainian enterprise is a calendar year.
The key Ukrainian accounting principles are:
accounting is based on historical cost, and cost in the past has been subject to inflation
adjustments;
the accounting directives are aimed at certain uniformity and continuity;
the prescribed form of the accounts is established in NAS;
the form of a transaction, rather than its substance, dictates its accounting;
accounting rules (for example, depreciation methods and rates etc) are defined by NAS.
45
Under NAS, financial statements consist of balance sheet, income
statement and cash flow
statement (no notes are required). These statements are more in line with internationally
recognizable formats; however, they are still on pre-
printed forms and based on specified
chart of accounts.
Very often (and that is common practice not only in Ukraine) foreign subsidiaries keep two
sets of accounts – one for statutory purposes (tax reporting, fillings with state authorities and
so on) and another for parent company / group reporting. The latter is usually used for
preparation of IFRS statements and consolidation in parent / group reporting.
Companies shall file their financial statements with the tax authorities and the Ministry of
Statistics on a quarterly basis, within 25 calendar days following the reporting quarter. In
addition, stock issuers must provide annual reports to the Securities Commission by the end
of September of the year following the reporting year.
With the exception of financial institutions, security issuers and public joint stock companies,
statutory audit reports are generally not required for Ukrainian companies. Qualified
statutory auditors can be either an individual with the appropriate qualification, or a
company or
firm employing registered auditors.
Typically Ukrainian subsidiaries of foreign companies or international groups are audited
primarily for the group consolidation purposes, commonly by the same audit firm, which is
used for the whole group. From practical point of view, it should be taken into account, that
audit fees charged by Big 4 (Deloitte, PWC, Ernst & Young, KPMG) and smaller international
audit & consultancy franchises (such as for example, Baker Tilly, BDO,
Grant Thornton,
Crowe Howarth) in Ukraine (applies also to Russia, Belarus) are substantially higher than
their fees in Central Eastern Europe and Baltics.
1.10. Currency regulations Currency
regulation is another
sensitive topic for businessmen doing business in foreign
countries. Ukraine has strict and somewhat administratively burdensome currency control
rules. In
recent times
attempts have been made to
lift excessive state regulation in this area.
For instance, settlements between residents and nonresidents of Ukraine in trade
transactions were allowed in both hard currency and UAH.
However, there is still a broad range of administrative instruments which are called upon to
govern the Ukrainian currency market.
Limitations on purchase of foreign currency
46
Foreign currency can be purchased for the following main purposes:
payment to offshore suppliers for goods/works/services
payment of dividends, interest and royalties abroad and
repayment of foreign currency loans registered with the National Bank of Ukraine (NBU),
etc.
Quite often foreign investments in Ukraine are structured via debt instrument instead of
direct equity injection into share capital of Ukrainian subsidiary. In the investment case in
Ukraine, I’m involved; we also have been advised to
channel money to Ukrainian subsidiary
via shareholders’ loan instead of direct equity. Due to limitation on purchase of foreign
currency in Ukraine, it deemed to be
easier returning cash (in foreign currency) out of
subsidiary as repayment of the loan. In such case, I can’t
stress enough how important it is to
register the loan (when granted to Ukrainian company) with NBU.
Licensing of certain currency transactions
A Ukrainian company is required to obtain an individual NBU license in respect of the
following transactions:
making an investment abroad, including establishment of a subsidiary company in
another country and transferring capital to finance its operation
crediting funds to bank accounts opened abroad and
purchasing shares of non-residents in cash, etc.
“180-day” rule
Payments from Ukrainian companies to non-residents for imported goods/ services, etc.
usually do not require an individual NBU license. However, if a Ukrainian company makes an
advance payment to a foreign company for account of future supplies, a Ukrainian company
must effect the actual importation of the goods or services concerned within 180 days
following the date of the advance payment. The 180-day period may be
extended only based
on an individual
permission granted by the Ministry of Economic Development and Trade.
Failure to comply with the 180-day requirement may result in severe penalties for the
Ukrainian company.
Foreign borrowing interest cap
Loans from non-residents of Ukraine must be formally registered with the NBU before their
receipt by Ukrainian borrowers. The effective currency regulations establish certain
limits (thresholds) on such borrowings. These limitations
depend on the type of currency and the
maximum interest rate allowed.
47
Thus, currently the maximum allowed interest rate (including commission fees and financial
penalties):
on short-term foreign loans (with a maturity of less than 1 year) should not exceed 9.8%
on long-term foreign loans (with maturity exceeding 3 years) should be less than 11%.
1.11. Risk of UAH devaluation Devaluation of Ukrainian currency is being constantly predicted and forecasted during the
last several years. The latest devaluation forecast was related to Parliamentary elections on
October 28th, 2012. It was expected that following the elections, that government will
undertake a controlled devaluation of UAH for 10-20%. However, by
March 31, 2013 (date
of writing this course) no steps were taken.
Clearly, though, the situation with UAH is not sustainable. UAH rate is
kept /manipulated by
NBU, which wastes, by opinion of many economists, foreign currency reserves on keeping
UAH at its current pegged rate while the trade deficit widens.
The chart below illustrates
dynamics of Ukraine’s foreign currency reserves, clearly
indicating that capital outflow accelerates.
Source: National Bank of Ukraine, Ukraine Macro Outlook for 2013 by UkrSibbank (BNP
Paribas Group)
For the last several years the NBU has shielded the UAH against sharp depreciation, despite
the widening gap of the balance of payments. This may be explained by the population’s
extreme
sensitivity to any drop in the exchange rate, which immediately triggers
withdrawals of UAH retail deposits.
48
For example, by opinion of BNP Paribas Group’s bank in Ukraine (UksSibbank), UAH rate was
(Q1 2013) overvalued by 15%.
Devaluation of domestic currency is never black and white issue. Again, in view of BNP
Paribas Group’s bank in Ukraine (UksSibbank), devaluation of the UAH will not notably help
the balance of payment in the current environment. At first glance, Ukraine’s exports should
benefit from devaluation, but given the
weak global demand, it is now mostly a question of
volume rather than price.
More importantly, Ukraine depends on commodities not only in terms of its exports, but also
its imports. In addition to energy resources, Ukraine imports
components and equipment
used in engineering and other industries. Thus, the only explicitly positive effect of
devaluation would be some
reduction in consumer imports, which has been a notable
source of pressure in recent years.
Pros and cons of a shift to a flexible exchange rate regime
Source: Ukraine Macro Outlook for 2013 by UkrSibbank (BNP Paribas Group)
From a businessman prospective involved in cross-border trade with Ukraine, devaluation is
certainly not preferable development. In result of devaluation imported goods will become
more
expensive in Ukraine and subsequently less competitive. Setting local production in
Ukraine is strong mitigating factor against instability and risk of devaluation of domestic
currency. However, imported raw materials will still be affected (become more expensive)
by devaluation. At the same time local currency devaluation diminishes local consumers’
income and purchasing power.
49
Interesting view on Ukraine’s monetary policy and NBU by
Anders Aslund of
Peterson Institute for International
Economics is available in the article in
Forbes Ukraine:
http://forbes.ua/opinions/1344648-novomu-glave-nbu-nelzya-idti-po-stopam-arbuzova http://www.iie.com/publications/opeds/print.cfm?ResearchId=2310&doc=pub 50
2. BELARUS 2.1. General information 2.1.1. Country Profile Capital:
Minsk (population of approximately 2 million).
Total area: 207,600 sq km
stretching 560 km (350
miles ) from north to south and 650 km
(460 miles) from west to east. It is larger than Austria,
Ireland ,
Portugal and Greece.
Population: ~ 9.5 million (urban population 70%).
Official Language: Belarusian and Russian are the official state
languages in Belarus.
Currency: Belarusian Ruble (BYR).
Government type: republic.
The Republic of Belarus is situated in the
heart of Europe, at the
crossroads of trade routes
from west to east and north to south. It is crossed by the shortest transport communication
lines
linking the CIS countries with the countries of Western Europe. Belarus borders on
Lithuania and Latvia in the north, on Ukraine in the south, on Russia in the east, and on
Poland in the west. Its
geographic position is of
strategic importance for communications
between west and east as well as between north and south. From Minsk, it is 500 km to
Warsaw , 700 km to
Moscow , 1,060 km to
Berlin and 1,300 km to
Vienna .
51
2.1.2. Overview of Belarusian economy The country’s geographically strategic position for
transit of goods between Europe and
Russia is one of the advantages of Belarusian economy. Two important transport corridors -
Klaipeda–
Vilnius –Minsk and Berlin-Warsaw-Minsk-Moscow
pass though Belarusian territory
The importance of the country’s infrastructure is not overlooked by Belarusian authorities.
The system of roads and railroads is being well-maintained by the government, which
hopes that Belarus will become a centre for logistics and freight forwarding companies trading with
entities of the Customs Union of Russia, Belarus and Kazakhstan.
Pre global crisis
In the course of the decade preceding 2008, the Belarusian economy grew at an average
annual rate of 7.5% due to the country’s reserves and favorable external conditions. High
investment-to-GDP ratios and productivity gains due to a well-educated and disciplined
labor force were the main contributors to growth.
Favorable external conditions also promoted the country’s rapid economic development.
They include high economic growth rates in Russia and other countries, easy access to the
Russian market and low-cost energy imports from Russia. The total assets of the banking
sector grew 3–4 times faster than GDP.
Most of the Belarusian economy remains under state control. Thus, more than a half of
Belarusians are employed by state-controlled companies, while others are employed mainly
by private Belarusian companies, and less than 2% of Belarusians are employed by foreign
companies.
Export / Import
Belarusian economy is dominated by services as well as industrial production. The majority
of Belarus trade is dominated by products such as tractors, trucks, motorcycles, televisions,
metal -cutting
machine tools , earthmovers, fertilizer, textiles, radios, refrigerators and
synthetic fibers.
In its imports and exports, Belarus depends on Russia, which is its major trade partner.
Russia accounts for 45% of Belarusian foreign trade
turnover , followed by the European
Union, the second largest trade partner of Belarus.
At the end of 2011, Russia accounted for 34% of the exports and 54.5% of the imports of
Belarus, while the European Union accounted for 39% and 19%, respectively. Statistics show
that exports to non-CIS countries have considerably increased recently.
52
Post-Crisis
Like many other countries, Belarus was engulfed in the financial and economic crisis in 2008.
The crisis in Belarus developed according to global trends, with a few distinctions. It is
generally assumed that the crisis in 2008 did not hit Belarus as hard as it did its neighboring
countries, although, as graphs above illustrate trade (both export and import) decreased
substantially in 2009 and 2010 and recovered only in 2011. That is largely due to Belarus’s
structural economic indicators, the low amount of foreign borrowing, the country’s
aspiration to
maintain the prevailing level of production and
employment at all costs, an
active social policy, the issue of loan bonds to prop up the economy, Russia’s financial
support and a few other factors.
However, the key economic shortcomings were not fully eliminated, and consequently they
(together with other factors) somewhat worsened the economic situation, leading to a new
crisis wave (the local “currency” crisis) from March to October 2011.
The economic situation worsened largely due to the large balance of payments deficit, a
reduction and restriction of foreign financing sources and a lack of inflow of foreign currency
in early 2011. All that sharply reduced the international reserves of the National Bank of the
53
Republic of Belarus (hereinafter, the “NBRB”) in the first quarter of 2011, and was followed
by a foreign currency deficit in the country.
The main distinguishing features of the new wave of the crisis are:
Considerable inflation. As of the end of 2011, officially declared inflation was 108.7%.
According to the joint opinion of the Big Four companies, the Belarusian economy was
hyperinflationary in 2011, as a result of which IAS 29 “Financial Reporting in
Hyperinflationary Economies” should be applied when reports are drawn up with regard
to the International Financial Reporting Standards (IFRS) by companies whose
functional currency is the Belarusian ruble.
Multiple increases in interest rates in the monetary and credit market. The NBRB
(National Bank of Republic of Belarus) gradually increased the basic refinancing rate in
Belarusian rubles from 10.5% on 31 December 2010 to 45% on 31 December 2011.
“Duality” of the exchange rate of the Belarusian ruble against the basic foreign
currencies until October 2011, i.e., the official exchange rate of the Belarusian ruble
substantially differed from the actual exchange rate. On 24 May 2011, for instance, the
exchange rate of the Belarusian ruble against the US dollar was officially reduced by 64%
in comparison with the exchange rate on 31 December 2010. The actual market
exchange rate differed from the official rate by 40%, indicating that there was a
substantial foreign currency deficit in the country. On 21 October 2011, the exchange
rate of the Belarusian ruble against the US dollar was officially reduced by another 76%
in comparison with the exchange rate on 24 May 2011. Such a duality of the exchange
rate in various currency markets no longer exists now.
Companies have far fewer opportunities to acquire foreign currency to settle foreign
trade transactions, including settlements at the actual exchange rate that existed until 21
October 2011.
An actual noticeable drop-off in business activity, expressed first and foremost in the
suspension of several investment projects, or at least in investors’ attempt to reconsider
the financial and economic terms of projects.
Source: Ernst & Young. Doing Business in Belarus 2012
The rapid and steady growth of many Belarusian industries in the last decade was
interrupted by the global economic crisis in 2008–2009. The fuel and petrochemical sector
suffered the most from the price shock. Sales problems resulted in frequent work stoppages
at many enterprises, especially in the
automotive industry and other machine-building
sectors.
The crisis of 2011 also had a considerable impact on certain industries. This is particularly
true of industries that substantially depend on imported materials and
assembly parts. In
this respect, the reduction of the so-called “import dependence” of the economy became
one of the main lines of state industrial policy. This is expressed, for instance, in an effort to
54
maximally localize certain production
units and to stimulate the production of assembly
parts or develop Belarusian analogues to them. However, the steps that have been taken are
not systematic, and an evident change in the economic structure has not been effected so
far.
2.2. Customs Union of Belarus, Russia and Kazakhstan The Customs Union (also called the Eurasian Customs Union) was established in 1995. The
main provisions of Customs Union legislation, however, were introduced only in 2009–2010.
The Customs Union actually started to
function on January 1st, 2010 when the Unified
Customs Tariff (a set of import duties applied by all three member-states) and the unified
system of non-tariff measures (licensing requirements on importation) were adopted.
The most significant changes took effect on July 1st, 2010, when the Customs Code of the
Customs Union and other important international treaties entered into force. Currently,
goods manufactured or
released for domestic consumption in one participating country can
circulate in the others free of customs clearance and without payment of customs duties and
VAT or any economic limitations. Such goods do not have to be placed under customs
procedures.
The Union is open to other countries provided that they share a common border with the
existing members. Within the CIS, this stipulation currently precludes
Armenia , Moldova and
Tajikistan, but the Kyrgyz Republic is considering membership and Ukraine has been invited
to
join .
The next stage was launched on 1 January 2012 with the
creation by Belarus, Kazakhstan and
Russia of the Common Economic Space of the Eurasian Economic Community. It involves
developing supranational institutions, modeled explicitly or implicitly on those of the
European Union, headed by the Eurasian Economic Commission, with
nine commissioners
responsible for various areas of economic integration. The Commission is expected to
gradually assume some of the competencies of national authorities, including import tariff-
setting (previously delegated to its
predecessor , the Customs Union Commission), technical
regulations and competition policy.
The Eurasian Development Bank, based in Almaty in Kazakhstan, has a broader membership
beyond the Customs Union countries and includes Armenia, the Kyrgyz Republic and
Tajikistan. The Bank currently has an Anti-Crisis Fund (ACF) program to help Belarus (subject
to policy conditions and
regular reviews), under which two disbursements totaling US$ 1.24
billion were made in 2011.
55
The ultimate
goal of the Eurasian Economic Community is free
movement of goods, capital
and people, as well as the harmonization of macroeconomic and structural policies. As of
2012 the member countries agreed to codify various existing agreements and treaties by
2015 and then discuss steps towards further integration.
The Customs Union of Russia, Belarus and Kazakhstan is the first successful example in
regional economic integration between countries of the former Soviet Union, according to
EBRD economists. EBRD economists believe that previous attempts towards economic
integration in the post-Soviet space, such as CIS free-trade agreement, created little actual
integration. However, the Customs Union has in fact introduced mechanisms of trade
integration, particularly by lowering non-tariff trade barriers. Potentially the union can bring
further benefits such as improved cross-border infrastructure and strengthened institutions.
Since the creation of the union, trade among the three countries has doubled. The increase
has been caused mainly by post-crisis
recovery , but also by reducing non-tariff barriers and
to some extent by common tariffs.
Benefits of regional economic integration:
1. Lower tariff and non-tariff trade barriers should increase trade and
enhance consumer
choice. In the case of the Eurasia Customs Union, the immediate “trade creation” effects
would mainly reflect the elimination of administrative barriers as customs checks are
removed from internal borders (since most trade between the member countries was
already subject to zero customs duties).
2. Producers within a regional integration grouping can benefit from increased market size.
Market size, in turn, is an important factor facilitating innovation, the fixed costs of
which can be
spread across a larger customer base. At the same time, consumers will
also benefit from greater competition in product markets.
3. Exporting within a regional area may
serve as a first
step towards the expansion of
exports worldwide – by initially building export capacity taking
advantage of low tariff
and nontariff barriers within a union, and then leveraging this capability to achieve
competitive advantage in exporting to other countries.
4. Countries within a regional integration area can
build cross-border production chains by
leveraging each other’s
comparative advantages and subsequently exporting the
finished product
outside that area
5. Deeper regional economic integration can help member countries to strengthen their
economic and political institutions.
6. Integration can
encourage the liberalization of services markets, which
tend to be
subject to greater regulation and protection compared with those for goods (and even
within the European Union they remain fragmented to some extent). Nevertheless, in
the
context of Eurasian integration there is great potential for efficiency gains in these
56
markets which could be realized by lowering entry barriers for
firms and investors from
other countries.
More insights by the EBRD’s on the Customs Union can found in the
Chapter 4 of Transition
Report 2012 - Integration across borders. The report is available for download at:
http://www.ebrd.com/downloads/research/transition/tr12.pdf 57
2.3. The Business Environment Good news
! By the World Bank / IFC methodology of measuring ease of doing business,
Belarus ranks relatively high (way above regional average) and favorably compare to
Ukraine. Belarus is ranked 58 in 2013 (up from 60 in 2012). Doing Business 2013 country
specific reports, are available for download on the Doing Business website at
http://www.doingbusiness.org Source: Doing Business database
Please review Appendix 4 for Summary of Doing Business indicators for Belarus. The
summary compares Belarus with the closest peers and Best Performers globally.
58
Corruption
Good news
! Corruption in Belarus is considered lower than in neighboring countries.
Belarus ranks (123) favorably compare to Ukraine (144) and Russia (133) in Corruption
Perceptions Index 2012 by Transparency International.
http://www.transparency.org/country#BLR 2.4. Banking system Banks dominate the Belarusian financial market; as of March 31st, 2013, there were 31
commercial banks in Belarus. Most Belarusian banks have foreign investors as shareholders,
although, in some cases foreign ownership may be purely related to tax structuring via
domicile in other countries.
The state currently has a
dominant share in the charter capitals of the three
biggest banks. It
plans to decrease the state share in these banks and to attract foreign investments to meet
the requirements for an initial public offering (IPO). To date, the Belarusian stock market
remains largely undeveloped.
The NBRB is the main regulator of banking activity. It issues licenses to all banking
institutions in Belarus. Such a license allows a bank to perform banking operations, including
attracting the financial resources of individuals and/or legal entities for bank accounts
(deposits), opening and maintaining bank accounts for individuals and/or legal entities,
settling and/or cash servicing of individuals and/or legal entities, currency exchange
operations, issuing bank guarantees, the fiduciary management of financial resources and
factoring. There are special requirements for certain types of banking operations.
The Belarus’ banking system is extremely concentrated. Although, there are 31 banks, more
than half of total assets in the Belarusian banking system are concentrated in the two largest
banks - Belarusbank and Belagromprombank. For example, as of December 31st, 2012, total
assets in the Belarusian banking system amounted to USD 37 billion. Total assets of
Belarusbank (by far the largest bank in the country) as of December 31st, 2012 were USD 15
billion and total assets of Belagroprombank, second largest bank, were USD 7 billion. The
Top 5 banks hold 80% of the market.
Belarusian banking system is dominated by state-owned banks, in particular Belarusbank
and Belagroprombank, which respectively made up 38.8% and 24.8% of the market as of
2011. Belarusbank also holds about 50% of all retail savings, and accounts for 90% of retail
lending (the latter as a result of its position as the only bank to provide state-subsidized
loans for
housing ), and 50% to 55% of all credit cards in circulation in Belarus originate from
the bank. Belarusbank is central to corporate banking as well, with 40% of loans and
59
deposits. The state-owned banks have a close
relationship with the government and are
currently responsible for financing numerous projects via state-directed lending programs.
Interesting insights on Belarusian banking system can be found in the article published by
The Banker (available at the following link):
http://www.thebanker.com/Reports/Special -
Reports/Belarus-at-the-crossroads/Belarus-banking-sector-
looks -ahead-with-
caution?ct=true
Four of the five largest Russian banks have branches in Belarus. Assets of any of the five
largest Russian banks exceed assets of the entire Belarusian banking system, therefore
Russia could influence Belarusian banking sector fairly easily.
According to the NBRB regulation No 522 of October 30th, 2012, a bank’s minimum
regulatory capital as of January 1st, 2014 must be not less than
EUR 15 million and as
of January 1st, 2015 - at least
EUR 25 million. By the end of 2012 less than half of the
Belarusian banks met the EUR 25 million threshold. Currently minimum required amount of
bank’s regulatory capital is EUR 5 million.
In the future, banks will require substantial external financial inflows to meet this standard,
and a number of banks will be forced either to consolidate or to change owners. These
changes can
draw major Russian financial institutions into the Belarusian market, or
open the possibility for mergers with Belarusian businesses as part of the expansion process.
Thus, on the one hand, the Belarusian market is highly risky for European banks, the country
should not
anticipate large and well-known European banks to come and invest in Belarus.
On the other hand, the new regulation concerning regulatory capital will force small
banks either to
find additional resources, or will make them more complaisant in talks with
Russian capital regarding mergers or sales, given that the latter is the most interested in
being represented in Belarus.
Among Belarusian banks with foreign (non-Russian) ownership are for example: Priorbank –
subsidiary of Austrian bank Raiffeisen International; Belarusky Narodny Bank (BNB) –
subsidiary of Bank of Georgia (the largest Georgian bank listed in London Stock Exchange);
BTA Bank – subsidiary of BTA Bank Kazakhstan, the largest bank in Kazakhstan; Idea Bank –
belonging to Polish Investment Group listed in Warsaw Exchange.
According to Bloomberg, in 2012, Moody’s Investors Service
retained its negative outlook on
Belarus’s banking system, saying assets will deteriorate further and lenders will become
more vulnerable as the country’s
ability to support the economy declines.
60
2.5. Development of Private Sector Although the Belarusian government has repeatedly declared the importance of private
entrepreneurship for the national economy, its role remains rather modest. In terms of
private sector development, Belarus lags severely behind other post-socialist countries. Yet,
over the last decade, some positive dynamics have been recorded. In particular, the number
of small and medium enterprises (SMEs) per 1,000 people increased from 2.5 in 2003 to 7.2
in 2010. Still, this ratio is rather small in comparison with other post-socialist economies as
the table below illustrates.
Source: Becoming Entrepreneur in Belarus: Factors of Choice. Maryia Akulava, BEROC , 2012
Regarding the growth rates of SEs and individual entrepreneurs (IEs), the
numbers leave
much to be desired. Specifically, in 2009, the number of SMEs and IEs amounted to 62,700
and 216,000 respectively, while in 2011 – to 72.200 and 232,000. Therefore, despite the
efforts of the authorities to encourage the development of private initiative, the number of
SEs and IEs only increased by 15.2 and 7.4%, respectively.
61
Next, private sector employment remains rather low. It amounts to approximately 13%,
while in the developed economies this figure varies between 60 and 70%. For instance, in
the U.S., it amounts to 60%, in Germany and in France - around 65-70%, and in
Japan – 85%.
On the other hand, transition economies have smaller shares, including Russia – 17%,
Kazakhstan – 20.6%, and Ukraine – up to 28.8%.
In Belarus, entrepreneurs are active mainly in the non-manufacturing sector, including trade
(30% of all entrepreneurs),
provision of different services (16.5%), construction (13%),
logistics (7%), and real estate (7%).
Some important indicators of private sector involvement in Belarusian economy are
provided in the table below.
Source: Becoming Entrepreneur in Belarus: Factors of Choice. Maryia Akulava, BEROC,
November 2012 Government efforts for private sector development
Good news
! There are a number of benefits for the companies and individual
entrepreneurs doing business in medium-sized/small towns and
rural areas.
62
Beginning from July 1st, 2012 companies and individual entrepreneurs doing business in
medium-sized/small towns and rural areas and applied for the implementation of this
regime, are exempt from:
Corporate profit tax and personal income tax respectively during
seven years after
registration of business. Exemption period is seven years beginning from the date of the
state registration of business in medium-sized/small towns and rural areas.
Real estate tax on the objects located in rural areas.
State duties for obtaining special permissions (licenses), introduction of changes into
special permissions (licenses) and their prolongation.
Obligatory sale of foreign currency received under transactions with Belarusian
nonresidents.
Customs duties and import VAT for equipment (the list of such equipment is closed) in
case of contribution of such equipment into the charter fund provided that legal entity
will use such equipment for five years in its
entrepreneurial activity.
Source: Ernst & Young. Doing Business in Belarus 2012
Tax benefits for motorway services
As mentioned before, Belarusian authorities take the country’s transit status very seriously.
Among the measures involving both incentives for SMEs development as well as
maintenance of the country’s
road system; profits received by legal entities and individual
entrepreneurs from supplies of goods (work or services) through motorway service
facilities (e.g., motels, hotels, campsites, service and car washing stations, retail, canteens, secured
parking
lots , parking lots for
vans and
residential trailers) is exempt from profit or personal
income tax for a period of 5 years after the establishment of such facilities. In addition,
motorway service facilities are not subject to real estate tax for a period of 2 years from the
date trading activities start.
2.5.1. Starting a business in Belarus According to the IFC / World Bank index of Ease of Doing Business, Belarus developed long
way during the last decade. Regulatory environment for starting a business became
substantially simpler – number of necessary procedures, time consumed and cost for
starting a business – all decreased significantly as the table below summarizes.
63
Source: Doing Business database
The table below summarizes the major regulatory developments in Belarusian towards
simplifying procedures and reducing costs and time of starting a business.
Source: Doing Business database
64
As the result of the above development, Belarus now
stands at 9 in the ranking of 185
countries globally and substantially higher than its peers (Russia at 101 and Ukraine at 50).
Belarus is this rank also favorably compares to the Regional Average of 60.
Source: Doing Business database 65
2.6. Foreign Investment treatment Minsk International Airport
The Belarusian Investment Code and Presidential Decree No. 10 “On additional conditions
for investment activity in Belarus” of 6 August 2009 sets basic regulations for investment
activity in Belarus.
The legislation defines investment activity as investment in the manufacture of goods
(
performance of works, rendering of services) or any other use of investments for the
purpose of receiving profit (income) or achieving another significant result.
The forms of investment activity in Belarus are:
Establishment of a legal entity
Acquisition of property or property rights, i. e.:
Share in charter fund of a legal entity, including increase of charter fund
Real estate
Securities
Intellectual property rights
Concessions
Equipment
Other capital assets
The sources of investments can be:
Investors’ own funds, including depreciation allowance reserves, net profit and profit
from sale of shares.
66
Borrowed funds, including loans from banks and non-bank credit and financial
organizations, loans from founders (shareholders) and other legal entities and
individuals, funded loans
Investment Agreement
An investment agreement is a special type of contract concluded to provide additional
government support to investment projects important to the Belarusian economy.
Investment agreements are concluded between a foreign or national investor (investors) and
Belarus as represented by the
Council of Ministers or a republican government body.
Irrespective of the contracting party representing Belarus, all types of investment
agreements assume a number of incentives exclusively provided under the agreement. The
most important of them are:
The site’s construction under the investment project along with the elaboration, expert
examination and approval of required project documentation for each stage of
construction together with a design for succeeding construction stages.
Rental of the land plot requisite for construction is provided without auction.
The right to remove vegetation without paying compensation for the removed
vegetation during the site’s construction under the investment project.
The rental rate is defined as at the date of the agreement’s conclusion and cannot be
increased during the entire period of the investment project’s realization.
Full credit for VAT paid for goods, works, services and property rights used for designing,
construction and equipping of sites under the investment project.
Exemption from paying custom duties and VAT on import of technical equipment
(assembly and
spare parts) under the execution of the investment project.
Exemption from paying the state
duty for the right to conclude the rental contract.
Exemption from paying state duty for obtaining permission for the engagement of
foreign labor in Belarus and special work permissions for foreign individuals attracted for
the realization of the investment project; in addition, these foreign individuals are
exempted from paying the state duty for a
terminal residency permit.
Exemption from compensating for agricultural and
forestry -based
losses derived from
acquiring a land plot for the execution of the investment project.
Exemption from paying land tax or rent for land plots provided for project construction
under the investment agreement during the design and construction period and until 31
December of the year following the year when construction was completed.
Exemption from paying contributions to innovation funds during the terms of the
investment agreement.
Investors can benefit from any other incentives stipulated by the internal Belarusian
legislation and not exclusively provided for under the investment agreement. Incentives
67
granted by the President Investment agreements concluded under the Council of Ministers’
decision with Presidential approval may provide for more incentives and benefits even
though they are not envisaged in the law directly. These incentives are defined individually
in each separate case.
Source: Ernst & Young. Doing Business in Belarus 2012
Free Economic Zones
Free economic zones (FEZ) are territories with a special regime for entrepreneurial activity
and with special incentives for business development, e.g., tax and customs benefits. Belarus
has six FEZs: FEZ
Brest , FEZ Minsk, FEZ Gomel-Raton, FEZ Vitebsk, FEZ Mogilev and FEZ
Grodnoinvest.
The following key benefits
exist :
Exemption from corporate profit tax (CPT) for five years from the date of first profit
declaration. Profit from uncovered activity is subject to profit tax at the general rate of
18%. Subsequently, tax is paid at a rate that is cut by half, but that is no more than 12%.
Since the CPT rate was reduced from 24% to 18% in 2012, FEZ residents are to calculate
CPT at the rate of 9%.
Exemption from real estate tax on buildings and construction (including over-normative
construction in progress) situated on the territory of the relevant FEZ, irrespective of the
way in which they are used. The benefit for FEZ residents registered prior to 1 April 2008
will remain unchanged through 31 March 2015, while for FEZ residents registered after1
April 2008, it will remain unchanged for seven years following the date of registration.
Exemption from land tax on land provided for construction during engineering and
construction, but for not for more than five years from the registration date (for FEZ
residents registered after 1 January 2012). For FEZ residents registered prior to 1 January
2012 the benefit applies
till 1 January
2017 , but for not more than five years from the
registration date.
VAT on sales in Belarus by FEZ residents of import-substituting domestic goods (in
accordance with the list of import-substituting goods) produced in a FEZ is paid at the
rate of 10% (instead of the 20% general VAT rate). This benefit can be applied until 1
January 2017.
Source: Ernst & Young. Doing Business in Belarus 2012
The High Tech Park (HTP) was established in Minsk in 2005 to promote the IT industry in
Belarus. The HTP is located east of Minsk and has a special legal regime in effect until 2020.
HTP residents pay 1% of their revenue to the HTP Administration and enjoy the following
benefits:
Exemption from CPT.
68
Exemption from VAT on the sale of goods, work or services or from the transfer of
property rights in Belarus (a few exceptions include rental pay received from leased out
immovable property and sale of goods placed under customs procedures of export, re-
export or exported to Customs Union’s countries without an obligation to return such
goods to Belarus).
Exemption from land tax (but for not more than three years) within the HTP during the
construction by HTP residents of buildings and structures on it for their own activity.
Exemption from real estate tax paid for buildings and construction (including over-
normative construction in progress) which are in the HTP, except for buildings and
construction (or parts of them) that are leased out.
Personal income tax rate of 9% is applied to the income of an HTP resident’s employees
(except for administrative
staff , e.g., security guards, cleaners, etc., who pay income tax
at the general rate of 12%) as well as of individual entrepreneurs who are HTP residents.
The social security contribution is calculated on the basis of an amount which is not more
than the average salary in Belarus for the preceding month (except for administrative
staff, e.g., security guards, cleaners, etc., from whose payroll social security contributions
are paid on general terms).
Payments by HTP residents to foreign companies in the form of dividends, royalty and
interest are subject to withholding tax at the rate of 5% (if a lower rate is not set in the
relevant double tax treaty).
The lease rates for state-owned immovable property are half the general rates.
Dividend payments are not subject to an offshore duty.
The requirement to sell foreign currency revenue received from the above-mentioned
activities does not apply to HTP residents.
An exemption from customs duties and VAT on importation of goods for the above-
mentioned types of activity (a list of these goods is approved by the President). HTP
resident cannot transfer the imported goods to third
parties or use them in a way other
than for the above-mentioned types of activity for two years from their release date.
Otherwise, customs payments should be made and other requirements set
forth in
customs legislation should be met.
Source: Ernst & Young. Doing Business in Belarus 2012
Risks foreign investors are facing in Belarus
Despite significant progress of Belarus in Doing Business index, which mainly follows
regulatory environment, Belarus is yet quite far from becoming attractive destination for
foreign investments.
For example, Belarusian government goal was to attract USD 3.7 billion in direct foreign
investment during 2012, yet it achieved less than USD 1 billion during 2 quarters of 2012.
69
Attractiveness of Belarus for foreign investors was too many times challenged by its own
government. Among high-profile cases of abusing foreign investors’ rights or even de-
facto nationalization are, for example:
In 2001 the plans of Russian-Sweden brewery company
Baltika to invest in Belarusian
plant Krynitsa failed, because Belarus suddenly refused to comply with its contractual
obligations to the investor. The state’s refusal came after Baltika already invested in
Belarus about USD 10.5 million.
In 2002 McDonald’s had to close one of its most profitable restaurants in Belarus,
because the Belarusian State University started construction of a new building on the
restaurant ’s land plot. The fact that Minsk State Executive Committee had previously
leased the land to McDonald’s till 2036 did not prevent the closure.
In January 2011 the State took administrative control over a huge furniture joint stock
company “Pinskdrev” although it did not own any shares there.
In a few months after Pinskdrev, state officials made one of the main stockholders and
the director of a Belarusian big
tile and sanitary engineering company Keramin to vacate
his position. After his retirement, state’s share in Keramin increased from 3% to 57%.
De facto nationalization of Spartak and Kommunarka confectioneries in 2012. The
confectioneries were transformed into joint-stock companies in 1993 and 1994. The
shares were distributed among the state, private investors, and the factories’ employees.
An American Marat
Novikov , became the main private investor of both
chocolate giants.
For years there was moratorium on sale of employees’ stock introduced in 1998. In
January, 2011, the moratorium’s term expired and big investors got a good opportunity
to broaden their economic presence in the country. The President’s Edict No. 107
adopted in March, 2011 interrupted purchase of shares by the investor from employees.
City executive committees got the pre-emptive right to purchase of employees’ shares.
The provision applied to
relations starting from January 1, 2011. That meant it actually
disregarded the universal principle of non-retroactivity of law. Using the edict’s
retroactivity, city executive committees wanted to get back the shares that Novikov had
bought from Spartak and Kommunarka employees. On 22 August 2012 the High
Economic
Court of Belarus satisfied the State Property Committee’s claims with regard to
both companies. Under the decision, the state’s share was going to increase by means of
additional stock issuance. Shareholders tried to resist the judgments. But their hopes, as
well as the hopes of Belarusian businesses looking for foreign investments, crashed after
the
famous Lukashenka’s
orders : to dissolve Advisory Boards, assign state officials as
their sole directors, and increase the state’s share up to 57% in Kommunarka and 60% in
Spartak from current 22% and 13.09% respectively.
Despite all the troubles,
examples of
smooth international investment projects in Belarus
still exist. American
Coca -Cola, German Man, and
Holland Heineken are just a few of an
already quite a long list of foreign investors who appear to be successful in Belarus.
70
In fact, foreign investors in Belarus are even in a safer position compared to their local
colleagues. The possibility of impartial consideration of their claims against Belarus is the
main reason for that.
Source: http://belarusdigest.com/story/belarus-investment-climate-after-spartak-and -kommunarka-11888
Another good article of pseudo-efforts in attracting foreign investments by Belarusian
Government can be found here:
http://belarusdigest.com/story/foreign-investments -
weaken-belarusian-regime-12156
2.7. Corporate forms A foreign company can undertake business activities in Belarus either through:
A separate Belarusian legal entity, or
A representative office of a foreign company
The most commonly used types of Belarusian legal entities are limited liability companies,
closed joint-stock companies and private unitary enterprises. Other corporate forms (e.g.,
full or limited partnerships) are theoretically available to foreign investors, but they are
rarely used.
Specific features of companies with foreign investments
A commercial company with foreign investments means a legal entity with a charter fund
that partially or fully consists of foreign investments that are
equivalent to not less than USD
20,000 and the main aim of which is to make profit and/or distribute it between the
participants.
Types of commercial companies with foreign investments:
Joint commercial company.
Foreign commercial company.
A commercial company with foreign investments can be created in several
ways :
By incorporating it.
As a result of the acquisition of shares (participatory interest) in an already existing
Belarusian legal entity.
Via acquisition of a Belarusian company as a “property
complex ” by a foreign investor.
Companies with foreign investments are granted the right to form a charter fund for two
years following the moment of state registration: 50% during the first year and 50% during
the second year (except for an open joint-stock company).
71
Ordinary companies (including open joint-stock companies with foreign investments) must
form their charter fund before their state registration. Current Belarusian legislation
contains no requirements for the size of a charter fund, except for closed and open joint-
stock companies.
The table below compares the most used corporate forms in Belarus. These forms will be
discussed separately in the following paragraphs.
Source: Ernst & Young. Doing Business in Belarus 2012
2.7.1. Limited Liability Company The limited liability company (LLC or OOO in Russian) seems to be the most popular
corporate form in Belarus. In practice the majority of foreign companies starting their
activities in Belarus prefer to establish an LLC.
The charter fund of an LLC consists of the
nominal values of its participants’ participatory
interests. The minimum charter fund of an LLC is currently not set (except for LLCs with
foreign investments — as discussed above). Payments for participatory interests may be in
the form of cash and/or in-kind payment with shares of other companies, assets, equipment,
72
etc. Participatory interests of LLCs differ from shares of joint-stock companies, because
participatory interests are not securities and should not be registered with a governmental
body.
The number of participants in an LLC can be up to 50. An LLC shall have a minimum of two
founders. The governing bodies of an LLC are the general meeting of participants and the
board of directors (
optional ). An individual executive body (director) runs its day-to-day
business; there can also be a collective executive body (managing board) running it.
The members of an LLC are not responsible for its obligations and
bear the risk of loss only
within the limits of their participatory interests.
2.7.2. Joint-Stock Company Joint-stock companies (JSC) might look a bit more complicated from the administrative
burden standpoint. JSCs generally fall into two categories: closed and open. The difference
between an open and a closed JSC is that in an open JSC shares may be freely sold to third
parties, while in a closed JSC share transfers are subject to the pre-emptive rights of other
shareholders.
The minimum charter fund requirement for incorporation is currently:
100 basic units (approximately 1,175 USD) for a closed JSC.
400 basic units (approximately 4,700 USD) for an open JSC.
The maximum number of shareholders cannot exceed 50 for a closed JSC but is unlimited for
an open JSC. The JSC shall have a minimum of two founders.
Joint-stock companies can distribute two types of shares: ordinary (voting) and preference
shares. The owner of a preference share receives fixed dividends and has the right to equity
when a company is being liquidated, but does not get the right to vote in managing the
company. The nominal value of such preference shares that are distributed must not exceed
25% of the company’s charter fund.
An open JSC must comply with a number of information disclosure requirements. For this
reason a closed JSC is generally preferred and may be used for setting up a joint venture
with a Belarusian partner. In most cases, if a company is an open JSC, it means that
previously it was a state unitary enterprise and was transformed into an open JSC in the
course of privatization (the state continues to be the stakeholder).
73
2.7.3. Private unitary enterprise A private unitary enterprise (PUE or ЧУП in Russian) is also a very popular corporate form in
Belarus. The main difference from an LLC is that a PUE’s founder remains the direct owner of
its property.
The property of a PUE is indivisible and may not be divided into contributions (participatory
interest, shares). Both an individual (jointly owned by spouses) and a legal entity can
privately own the assets that belong to a PUE by right of economic management. Common
ownership of a PUE’s assets is prohibited.
The PUE has the right to dispose of all the property that belongs to it by right of economic
management except for real estate (if other restrictions are not set by the founder in the
charter). Any disposal of real estate (including sale, lease, recognizance, etc.) can be carried
out only by the founder’s decision.
The minimum charter fund of a PUE is currently not set (except for PUEs with foreign
investments – as discussed above). Payments into the charter fund may be both in cash and
in kind, when it is paid with shares of other companies, assets, equipment, etc.
The maximum number of participants in a PUE is one. The governing body of a PUE is the
director, who shall be appointed by the owner or by a body authorized by the owner and
accountable to it.
A PUE is liable for its obligations, with all of the property belonging to it by right of economic
management. It doesn’t bear liability for the obligations of the owner of its property.
74
2.7.4. Registration of the companies in Belarus Companies must be registered with the state registration authority, which takes care of
further registrations with the tax authorities, the Fund for the Social Protection of People,
the statistics bodies, the Belarus republican unitary insurance enterprise Belgosstrakh, etc.
A representative office should be accredited with the Belarusian Ministry of Foreign Affairs.
After that it should separately apply for registration with the tax authorities, the Social
Security Fund, the statistics bodies and the Belarus republican unitary insurance enterprise
Belgosstrakh. On the whole, setting up a representative office is much more burdensome.
Source: Ernst & Young. Doing Business in Belarus 2012
A newly created company (a representative office) should take additional steps to be fully
operational, e.g., open bank accounts, manufacture a corporate seal and register the shares
issuance (for JSCs only) with the securities authorities.
2.8. Taxation 2.8.1. Corporate income tax (CIT) Tax rate
The CPT rate is 18%. Profit from the sale of shares (participatory interest in the charter
capital) of a Belarusian company is taxed at the rate of 9%. A CPT rate of 12% applies to
dividends paid by Belarusian companies. Reduced tax rates are also applied in some other
case.
Taxpayers
CPT payers are Belarusian companies and foreign companies engaged in activity in the
Republic of Belarus through a permanent establishment.
75
Foreign companies pay CPT on profit received through a permanent establishment in Belarus
by selling goods (work, services) and property rights as well as on non-sale income reduced
by non-sale expenses.
A foreign company’s permanent establishment in Belarus is:
A structural subdivision (establishment) or other place of supply of goods (work,
services) or of engagement in other activity in Belarus through which a foreign company
carries on entrepreneurial or other activity to make profit.
A company or individual engaged in activity on behalf of a foreign company and/or in its
interests, and/or having and using the foreign company’s authority to enter into
contracts or
agree on their material terms (dependent agent).
A construction site and an assembly unit are also permanent establishments if they have
existed in Belarus for over 180 days in any 12-month period.
A place used only for one or several of the following purposes is not a foreign company’s
permanent establishment:
Storage , exhibition or supply of goods of own production (“supply” means delivery and
shipment of goods without selling them in Belarus through a permanent establishment).
Procurement of goods for a foreign Company.
Gathering or distributing of information for a foreign company.
Involvement in other types of activity if the activity is, on the whole, preparatory or
auxiliary.
Tax base
CPT applies to (i) gross profit and (ii) dividends accrued by Belarusian companies. There are
two methods to recognize sales revenue:
Upon receipt of payment for the supplied goods (work, services and property rights)
(cash method).
Upon the supply of goods (work, services and property rights) (accrual method)
Banks use the accrual method only. It is expected that starting in 2013, all taxpayers will
apply the accrual method.
Interest expenses — thin capitalization rules
Thin capitalization rules
restrict tax deduction of a certain portion of interest on loans for
CPT purposes. The rules came into force as of 2013. They apply when the debt to equity
ratio is more than 3:1.
The following are cases in which a controlled debt arises:
76
1) A foreign company that granted a loan owns, directly or indirectly, over 20% in a
Belarusian company’s charter capital.
2) A Belarusian company that grants a loan is an interrelated entity of a foreign company
that directly or indirectly owns over 20% in a Belarusian company’s charter capital.
Tax deductible interest is calculated by the following formula:
Source: Ernst & Young. Doing Business in Belarus 2012
Dividends
Dividends received by Belarusian companies from residents and nonresidents are subject to
CPT at the rate of 12%. Dividends distributed by Belarusian companies are taxed at source.
CPT on dividends is withheld and transferred to the budget by the companies that pay the
dividends.
When dividends are paid by foreign companies, income tax may be withheld in a foreign
state. Actually, the amount of tax withheld in a foreign state may be offset when paying CPT
in Belarus
Tax return filing and tax payment
The tax period for CPT is the calendar year. The amount of CPT for the tax period is
determined on an accumulated basis. The taxpayer submits a CPT return annually not later
than 20 March of the year following the reporting tax period.
The taxpayer uses one of the following methods to determine CPT advance payments:
On the basis of the taxpayer’s activity in the preceding tax period: every quarter a
company pays one
fourth of the CPT amount for the preceding tax period. This method
cannot be used if a company suffered a loss in the preceding tax period.
On the basis of the presumed CPT amount: every quarter a company pays one
fourth of
the estimated CPT amount. The amount of tax so paid should be at least 80% of the
actual amount of CPT according to the results of the current tax period.
The taxpayer can change the tax payment method (if the second calculation method
replaces the first method). For this purpose it submits an adjusted tax return not later than
the twentieth of the third month of the quarter in which the calculation method changed.
77
Current CPT payments are made not later than 22 March, 22 June, 22 September and 22
December of the current tax period.
2.8.2. Withholding tax (WHT) Taxpayers paying withholding tax (WHT) are foreign companies that receive income from
sources in Belarus without carrying out activity in Belarus through a permanent
establishment.
Particularly the following types of Belarusian-sourced income for foreign entities are subject
for WHT
Dividends – 12%;
Income from the disposal of shares in charter capital, stocks and/or interest of legal
entities located in Belarus – 12%;
Royalties (including payments for leased property) – 15%;
Licenses – 15%;
Interest – 10%;
Freight (charges for international shipping and forwarding services, except for
international transportation by sea) – 6%;
Other income - 15%.
For tax purposes, royalties include payments for the use of or granting the right to use
property and rights to copyrighted
items , including
literary and scientific works, computer
programs and other copyrighted work. This also extends to objects of allied rights, including
the creation of soundtracks to programs by broadcasting companies, as well as payments for
any license,
patent , trademark, service mark, business name, drawing, utility model,
diagram , formula, industrial standard or process. Equally included are payments for any
information regarding industrial, commercial or scientific research (including know-how),
payments for the use of property in Belarus or for granting the right to use such property.
Excluded are payments made for international (continental and intercontinental) channels
and leasing telecommunications networks.
Other types of income include, among other things, income derived from training services,
information, management, advertisement, insurance and audit services, and income derived
from the disposal of real estate located in Belarus.
Source: Deloitte. Belarus business and investment guide . Tax issues 2012.
Provisions of double tax treaties
78
Belarus has double tax treaties with the following countries: Armenia, Austria, Azerbaijan,
Bahrain,
Belgium , Bulgaria, Germany, China, Croatia, Cyprus, the
Czech Republic,
Egypt ,
Estonia,
Finland , Hungary, India, Iran, Ireland, Israel, Italy, Kazakhstan, North Korea, South
Korea, Kyrgyzstan, Kuwait, Latvia, Lebanon, Lithuania, Macedonia, Moldova, Mongolia, the
Netherlands, Oman,
Pakistan , Poland,
Qatar , Rumania, the Russian Federation, Saudi Arabia,
the Slovak Republic,
Slovenia , the Republic of South Africa, Sweden, Switzerland, Syria,
Tajikistan, Thailand,
Turkey , Turkmenistan, Ukraine, the United Arab Emirates, Uzbekistan,
Venezuela , Vietnam and Yugoslavia (effective for
Serbia ).
Belarus also
signed a double tax treaty with Libya, but it has not been ratified yet.
Belarus has double tax treaties as a legal successor to the USSR with the following countries:
Denmark , France, Japan, Malaysia, Spain, Great
Britain and the USA. According to the
Ministry for Taxes and Levies, the treaties with Canada and
Norway are no longer in force.
Appendix 5 summarizes withholding tax rates for different types of income and countries.
Source: Ernst & Young. Doing Business in Belarus 2012
To apply the provisions of double tax treaties, a company must receive confirmation that it
has a permanent
location in a foreign state with which Belarus has a
valid double tax treaty.
Such confirmation may be provided in the form established by the Taxation Ministry or in
any other form set by the government of a foreign state. In the latter case, such
confirmation should contain the following mandatory data:
Date of issue (or term of
validity ).
Full name of the foreign company and its registered address.
Confirmation that the foreign company was (is) a tax resident of a certain state in order
to apply the provisions of international double tax treaties in the period under
consideration
Confirmation should be submitted to the tax authorities either directly or through a
company that withholds income tax. If the foreign company does not meet this requirement,
the tax agent withholds the tax at the rates set by the Tax Code. This tax, however, can be
offset or reimbursed when the foreign company
presents the relevant documents.
Tax return filing and tax payment
A tax period is a calendar month. A tax agent submits a WHT return not later than the 12th of
the month following the tax period. Tax should be paid to the budget not later than the 22nd
of the month following the tax period.
79
2.8.3. Value Added Tax (VAT) Value-added tax (VAT) is charged for the supply of the majority of goods, services and
property rights in Belarus, and on most imports into Belarus.
VAT payers are as follows:
Belarusian legal entities;
Foreign and international organizations
acting via a permanent establishment in Belarus
and registered with the Belarusian tax authorities;
Simple partnerships (contract
partners in joint activities);
Economic groups;
Trust managers with respect to sales turnover arising in connection with the
management of the trust property on behalf of the trustees and/or beneficiaries;
Individual entrepreneurs whose turnover for the previous three months exceeds the
equivalent of EUR 40,000, or who voluntarily elect to pay VAT;
Entities and individuals regarded as taxpayers in relation to the handling of goods
through Belarusian customs in compliance with Belarusian legislation and international
treaties of the Republic of Belarus that form part of the international treaty
framework of the Customs Union.
There are no special provisions for VAT registration in Belarus. A company may only be
registered as a taxpayer with regard to all taxes.
VAT is levied at the following rates:
0% on goods exported to Customs Union member states (Russia, Kazakhstan), including
goods exported on the basis of lease agreements/contracts, loan agreements and
contracts for the production of goods, loading, shipment and transshipment, and other
similar services directly related to the sale of exported goods.
0% is also levied on exported transportation services, exported work or services related
to the production of goods using raw materials supplied by a customer, maintenance
work or services, modernization, the re-equipment of aircraft and their engines, railway
vehicle units or services performed for foreign companies or individuals.
A rate of 0.5% is applied to the importation of
diamonds and other precious
stones for
production purposes (international activity number 7102, 7103) from countries which
are Customs Union members.
10% on the supply of goods produced through plant growing (excluding flowers and
decorative plants),
animal breeding (excluding animals used in fur production), fishery
and
honey bee production, and on the importation and/or supply of foodstuffs and
goods for
children in Belarus, in accordance with a list determined by the President
20% on other goods and services not listed above.
80
Moreover, the law establishes rates of 9.09% and 16.67% to be applied to goods sold at
regulated retail prices. If penalties are imposed on buyers or customers for the violation of
contractual terms these penalties include VAT at the above rates.
VAT mechanism
The invoice method of calculating VAT liabilities is applied in Belarus. The VAT liability of a
taxpayer is calculated as the product of the tax base and the tax rate. VAT payable to the
authorities is determined as the difference between VAT calculated by taxpayers and
charged to customers (output VAT) and VAT paid to suppliers of goods (work or services)
(VAT invoiced to taxpayers or input VAT), which is related to production/sales activities, or
other VAT-able transactions.
If input VAT exceeds output VAT, the payer is not obliged to pay VAT, and the difference is
carried over, without
penalty , and is either deducted from the tax liability in the next period,
or refunded to the payer.
Payments and filing tax returns
The standard VAT period is a calendar year; the VAT reporting period is a calendar month or
a calendar quarter at the taxpayer’s own choice. A VAT return is due by the
20th of the
month following the reporting period, and the tax is calculated based on the amount of tax
accumulated from the beginning of the year. VAT is payable by the 22nd of the month
following the reporting period.
Major VAT-exempt activities include:
Commission fees for insurance brokers from insurance companies for brokerage services;
Rendering
medical services; the sale of certain pharmaceuticals and medical equipment;
Transfers of industrial property rights;
Housing and communal services provided to individuals;
Communication services provided to individuals;
Services provided by banks and non-banking financial institutions;
Insurance (co-insurance,
reinsurance ) services.
Source: Deloitte. Belarus business and investment guide. Tax issues 2012. 81
2.8.4. Transfer Pricing (TP) New transfer pricing rules are included in the Belarus Tax Code effective from January 1st,
2012.
Tax authorities may control prices only during an on-site tax audit in the following cases:
Sales of real estate where the transaction price is more than 20% lower than the market
price on the date of the sale; and
Foreign trade transactions, including transactions with related parties, where the price of
the transaction (or transactions with the same party within a single calendar year)
exceeds BYR 20 billion (approximately EUR 1.8 million) on the date of acquisition or
disposal of the goods and the price of the transaction deviates by more than 20% from
the market price of the goods.
If the tax authorities determine that the transaction price deviates from the market price by
more than 20%, they may adjust the tax base and profits of one of the parties to the
transaction to an amount that would have been obtained had the transaction price been set
at the market level. The tax authorities can use the comparable uncontrolled price, resale
minus , and cost-plus methods for determining the market price.
2.8.5. Personal Taxation Payers
According to the law, individuals are regarded as personal income tax payers. Belarusian
citizens and foreign nationals who are tax residents are taxed on their worldwide income
paid in cash or in kind, and on any material benefits received during a calendar year.
Individuals who are not considered to be tax residents of Belarus (the duration of their
stay in Belarus is 183 days or less) pay tax on their Belarusian-sourced income only. The actual
duration of stay is the period of time an individual stays in Belarus, and is not interrupted by
trips abroad for medical treatment or business trips.
Payroll taxes
Payroll taxes resulting from employment or
civil contracts include the following:
Personal income tax (PIT)
Payments to the Social Security Fund
82
Payments to RUP Belgosstrakh
The employer should calculate, withhold and remit PIT to the government on behalf of the
employee.
Payments to the Social Security Fund are made by the employer (34%) and the employee
(1% of their salary, including other remuneration paid by the employer). Payments to
Belgosstrakh are made by the employer at rates varying from 0.1% to 2.4% of the gross
payroll.
Personal income tax rates
A
flat rate of 12% is applied in Belarus both to tax residents and to those not regarded as tax
residents. Other rates apply to specific income:
9% – Income received by individuals from residents of the HT Park under labor contracts
(except for support personnel who service and guard
premises ,
rooms or plots of land);
15% – Income from entrepreneurial and private notary activities
Elimination of double taxation
Belarus has signed a number of bilateral double tax treaties, which, under certain conditions,
enable individuals to avoid taxation of the same income under the tax systems of two or
more countries by way of
application of tax exemption in one of the countries or through a
reduction in the tax rate.
Therefore, according to national legislation, personal income taxes paid in foreign countries
may be credited against Belarusian PIT, provided that the documents confirming the amount
of taxes paid into foreign budgets are shown to the Belarusian authorities.
2.9. Financial Reporting As of December 31st each year, enterprises must formulate annual financial statements
consisting of
a balance sheet,
an income statement,
a statement of changes in shareholder equity
a cash flow statement,
The statement on the purposeful use of the received financial resources and
Explanatory notes.
83
Companies present annual financial statements to their owners, to the Taxation Ministry and
to the state statistics authorities within 90 days after the end of the reporting year.
According to domestic tax accounting rules, and depending on a taxpayer’s accounting
policy, income in accounting and tax accounting is recognized on either an accrual or a cash
basis. Banks can use the accrual method only.
The accrual basis implies the recognition of income at the time of the delivery of goods or
services. The cash basis involves the recognition of taxable income when both events
(delivery and payment) have taken place.
The new Chart of Accounts and instructions on its application, as well as other regulatory
documents elaborated on the basis of the International Financial Reporting Standards (IFRS),
came into force on January 1st, 2012. This is helping to gradually effect a transition to the
new accounting methodology and to reconcile Belarusian accounting with IFRS.
Belarusian accounting tends to
focus on form rather than substance: the laws are very
specific as to the documents required to support a transaction. This emphasis on the legal
form may override the application of other accounting principles. The going concern issue is
relevant in this emerging market due to the possibility that some companies may not
continue their economic activity in their current financial position.
Obligatory independent audit
The following entities are subject to an obligatory annual independent audit:
Open joint stock companies;
Banks and non-bank financial intermediaries;
Stock exchanges;
Commercial organizations with foreign investments;
Insurance companies and insurance brokers;
HT Park residents;
Legal entity that provides guaranteed repayment of individual bank deposits;
Other legal entities (excluding collective farms and regular farms) and individual
entrepreneurs whose revenue for the preceding year
exceeded EUR 600,000
Annual financial statements of the following companies should be made public:
1) Banks and nonbanking credit and financial institutions;
2) Insurance and reinsurance companies, insurance brokers;
3) Open joint-stock companies;
84
4) Issuers of securities.
Discrepancies between IFRS and the Belarusian statutory accounting principles
Despite the existence of accounting standards in the banking system and in legal acts of the
Finance Ministry, Belarusian statutory accounting depends on various orders and
letters issued by the Finance Ministry and the NBRB that prescribe accounting methods and
approaches.
These and other circumstances may result in departures from the standard requirements
and consequently in more inconsistencies with IFRS in addition to those outlined below. The
major differences are as follows:
In spite of the prescribed principle of prudence in financial statements standards, the
accrual concept is not fully implemented in statutory accounting of companies when
accounting for income (which may be recognized on a cash basis);
Definition of reporting and functional currency (financial statements for Belarusian
statutory purposes must be prepared in Belarusian rubles only);
The mandatory existence of supporting documentation prepared in accordance with the
prescribed format for both accounting and tax purposes;
The impact of hyperinflation is not
reflected in the Belarus accounting system;
The absence of the concepts of “fair value”, “amortization value” and “
asset impairment ” in the Belarus accounting system when recognizing and appraising financial
assets;
In spite of the existing guidance for the preparation of consolidated financial statements
that requires that the parent company prepare separate and consolidated financial
statements if it has subsidiaries, the order is not fully complied with and enforced; in
IFRS, on the other hand, the consolidation concept must be fully applied;
The regular revaluation of entire
classes of fixed assets under the Belarusian statutory
accounting principles is allowed under the prescribed rules;
Differences in the accounting for equity and reserves;
Accounting and reporting in the banking system is more developed in terms of IFRS
concepts (for example, fair value concept,
goodwill , etc.).
Source: Ernst & Young. Doing Business in Belarus 2012
The use of different national statutory accounting standards and legal acts makes the
comparison of opportunities and financial decisions more difficult and costly for the
potential investor or
user of the financial statements. Differences in accounting standards
between IFRS and the Belarusian statutory accounting principles also impose additional
costs on companies that must prepare financial information based on multiple reporting
models in order to raise capital in different markets. The differences also create potential
confusion as to which are the real numbers.
85
Pursuant to the
draft accounting law, socially important companies will be required to
prepare statutory and IFRS finance reports in Belarusian rubles effective from 2013. The
Belarusian ruble will be the reporting currency and IFRS reports would then be subject to
obligatory audit. In addition to banks, the list of such companies will also include public joint-
stock companies, insurance companies, professional participants in the securities’ market
and stock exchanges.
2.10. Currency Regulations Historically, the currency control area has been a source of confusion and uncertainty for
foreign investors
operating in Belarus. Still, it is important that foreign investors address any
potential currency control issues in advance of concluding any significant transactions with
Belarusian companies or individuals.
Both residents and non-residents of Belarus are permitted to have foreign currency and
ruble accounts with authorized banks.
The Currency Control Law separates transactions involving foreign currency and securities in
foreign currency into two groups:
Current currency transactions, which have fewer restrictions;
Currency transactions associated with the movement of capital, which may require
permission from the National Bank of Belarus.
The list of current currency transactions is closed. All other currency transactions, except for
those specifically
named in currency law as current ones, are capital currency transactions.
Residents and nonresidents may conduct current currency transactions without any
restrictions or permission from the NBRB. Generally, to carry out capital currency
transactions, Belarusian residents obtain permission from the NBRB.
Current currency transactions
Current transactions include the following transactions between residents and nonresidents:
Settlements under deals assuming exportation and/or importation of goods (excluding
money, securities and immovable property),
protected information, intellectual property
rights, works and services;
Settlements under deals assuming transfer and/or receipt of property in rent (lease);
Transfer and receipt of dividends and other income on investments;
Non-trade transactions (transfer and receipt of monies for salary payments or pensions
or as part of an inheritance, stamp duties, etc.).
Currency transactions that require the permission of the NBRB 86
The following transactions of Belarusian companies-residents (non-banks), inter alia, require
permission from the NBRB:
1) Acquisition of property located outside Belarus that qualifies as immovable property
under Belarusian legislation;
2) Allocation of funds to nonresident banks or transfer of funds to nonresidents (except for
nonresident banks) for trust management;
3) Provision of loans;
4) Settlements under a resident’s obligations as a guarantor towards a nonresident arising
from a guarantee or an
indemnity agreement;
5) Receipt of loans in case of any of the following conditions:
The interest rate for loans exceeds the level determined by the NBRB (for USD and EUR
loans it is currently 14% per
annum );
The interest rate for loans in the event of late repayment (in the event of interest rate
increases due to delayed repayment) and the amount of penalties (fine, default interest)
in the aggregate exceeds the level determined by the NBRB (0.01% per day or 3.65% per
annum);
The loan agreement (along with the interest rate) contains an obligation to carry out
other additional charges (except payments for the use of loans in the event of late
repayment or payments for paying a penalty);
The loan is used to pay the liabilities of the borrower without being received in the
borrower’s bank account;
Repayment of the loan is not executed from the borrower’s bank account;
The
lender is registered in an offshore zone.
6) Settlements under the obligations of a resident towards nonresidents
arise on the basis of
cession agreements or debt transfer agreements.
Source: Ernst & Young. Doing Business in Belarus 2012
Also, the law requires Belarusian residents to receive permission from the NBRB to open
bank accounts outside of Belarus.
Execution of foreign trade agreements
Residents should
complete each foreign trade transaction within the following terms:
For export: within 90 calendar days (120 calendar days under commission agreements)
of the date of shipment (transfer of protected information or intellectual property
rights), performance of works or rendering of services;
For import: within 60 calendar days of the payment day.
Obligatory conversion of export revenue 87
Belarusian legal entities are currently required to convert 30% of their foreign currency
export revenue into Belarusian rubles by selling through authorized banks within seven
working days of receipt.
Payments for imports
Please note that the NBRB currently prohibits advance payments under foreign economic
contracts involving import transactions. This prohibition applies to Belarusian rubles as well
as to foreign currency. An exception is made for importers acquiring raw materials under the
terms of an advance payment for the further production of export-oriented goods.
Advance payments made to a non-resident from a Belarusian bank account may only be
performed if the importer has permission from the NBRB. In order to obtain permission from
the NBRB, an importer should submit an application form from the Belarusian Council of
Ministers and a
copy of the foreign trade contract. The NBRB is entitled to request additional
documents related to the transaction.
Additionally, a Belarusian company-importer is allowed to make advance payments by using
foreign currency received under loan/credit agreements concluded with nonresidents. Also,
a Belarusian company-importer may carry out advance payments by the “
letter of credit”.
There are no restrictions on advance payments in foreign currency made to residents of the
Russian Federation and Kazakhstan – Customs Union in
action .
88
Appendix 1. Ukraine. Key macroeconomic forecasts.
Source: National Bank of Ukraine, Ministry of Finance, UkrStat, UkrSibBank estimates 89
Appendix 2. Ukraine. Development of IT Outsourcing industry - selected charts
Chart 1. Number of IT outsourcing companies in Ukraine 2007-2011.
Source: Report Exploring Ukraine IT Outsourcing Industry 2012 Chart 2. Share of companies by year of
founding – indicates maturity of the industry.
Source: Report Exploring Ukraine IT Outsourcing Industry 2012 Chart 3. Main IT outsorcing services provided by Ukrainian Companies.
90
Source: Report Exploring Ukraine IT Outsourcing Industry 2012
Chart 4. Service Rates.
Source: Report Exploring Ukraine IT Outsourcing Industry 2012 91
Appendix 3. Ukraine. Summary of Doing Business indicators.
92
93
94
Source: Doing Business database.
95
Appendix 4. Ukraine. Chart of withholding tax rates.
The following chart present a list of withholding tax rates which may be applicable to certain
types of income derived from Ukraine by non-residents of Ukraine.
96
97
Source: KPMG. Your Business in Ukraine 2012
Notes:
(1) Figures in the brackets in column “Dividends” indicate the minimum share of a foreign
shareholder in a Ukrainian company in order for the reduced WHT rate to apply (provided
such shareholder is the beneficial owner of such dividends).
(2) Figures indicated in the table above separated by a back-
slash (/) suggest that different
WHT rates may apply to a particular type of income under the relevant double taxation
treaty.
98
Appendix 5. Belarus. Summary of Doing Business indicators.
99
100
101
Source: Doing Business database.
102
Appendix 6. Belarus. Chart of withholding tax rates.
Source: Ernst & Young. Doing Business in Belarus 2012 103
References
1. Ukraine Macro Outlook 2013. Difficult Policy
Choices . Report by UkrSibbank (BNP
Paribas Group).
2. Your Business in Ukraine 2012. Report by KPMG.
3. Ukraine. Tax Highlights 2012 by Deloitte.
4. Macroeconomic Forecast Ukraine November 2012. Research By Business Monitor
International.
5. Ukraine. Country
Strategy 2012-2014 by Black Sea Trade and Development Bank.
6. Economy Profile: Ukraine. Doing Business 2013. Annual analytical publication by the
World Bank and the IFC.
7. EBRD to Help Ukraine Get Into Top 100 of Doing Business Ranking. Article by the
EBRD.
8. Exploring Ukraine IT Outsourcing Industry. Publication by Ukrainian Hi-Tech Initiative.
http://hi-tech.org.ua/wp-content/uploads/2012/08/Exploring-Ukraine-IT -
Outsourcing-Industry-20121.pdf
9. Know
Emerging
BPO
destination:
Ukraine.
Article
on
BPM
Watch.
http://www.bpmwatch.com/knowledgebase/know-emerging-bpo-destination -
ukraine/
10. Corruption Perception Index 2012
http://www.transparency.org/cpi2012/results 11. Foreign Banks
Flee Ukraine. Article by Yevhen Hrebeinik at The Ukrainian Week.
12. Statistics of National Bank of Ukraine -
http://www.bank.gov.ua/control/en/ 13. The Underachiever: Ukraine’s Economy Since 1991. Article by Pekka Sutela at
Carnegie Endowment -
http://carnegieendowment.org/2012/03/09/underachiever -
ukraine-s-economy-since-1991/a1nf
14. Ukraine's Monetary Policy Is Shockingly Incompetent. Article by Anders Aslund
published in Russian by in Forbes Ukraine and in English by Peterson Institute for
International Economics:
http://forbes.ua/opinions/1344648-novomu-glave-nbu-nelzya-idti-po-stopa m-
arbuzova
http://www.iie.com/publications/opeds/print.cfm?ResearchId=2310&doc=pub 15. Economy Profile: Belarus. Doing Business 2013. Annual analytical publication by the
World Bank and the IFC.
16. Doing Business in Belarus 2012 by Ernst & Young.
17. Belarus business and investment guide. Tax issues 2012 by Deloitte.
18. Doing Business in Belarus 2012. Co-publication by Ministry of Economy of the
Republic of Belarus and Revere Consulting Group.
19. Becoming Entrepreneur in Belarus: Factors of Choice. Article by Maryia Akulava,
BEROC. November 2012.
20. Transition Report 2012. Integration across Borders. Report by the EBRD.
104
21. Belarus banking sector looks ahead with caution. Article by John Beck published at
The Banker -
http://www.thebanker.com/Reports/Special-Reports/Belarus-at-the -
crossroads/Belarus-banking-sector-looks-ahead-with-caution?ct=true
22. Belarus Investment Climate After Spartak And Kommunarka. Article by Darya Firsava
published at BelarusDigest
http://belarusdigest.com/story/belarus-investment -
climate-after-spartak-and-kommunarka-11888
23. Foreign Investments Weaken The Belarusian Regime. Article by Siarhei Bohdan
published at BelarusDigest
http://belarusdigest.com/story/foreign-investments -
weaken-belarusian-regime-12156
105
ABOUT TRADERUN PROGRAMME The aim of the one year study programme TRADERUN is to increase the development of Russian and Eastern Partnership
countries' environment and its impact on the business society to value the quality and expertise of Estonian higher
education. The goal of this multilateral MA training programme is to introduce a unified academic module that gives an
overview of economic, cultural, political, administrational business settings in Russia and Eastern Partnership countries.
The programme is developed in cooperation between University of Tartu, University of Tallinn, Tallinn University of
Technology and Estonian School of Diplomacy and representatives of business, government and education sector. The
project raises the competence and ability of Estonian higher institutions to analyze economic and political-administrative
environment and to foresee the possible changes of business development of Russia and Eastern Partnership countries.
Furthermore, the module does not focus only on business awareness, but combines the economic, cultural and political
sciences and provide the problem-oriented knowledge and abilities.
The programme is
designed for MA students, entrepreneurs, managers, consultants, officials, public servants, wide public.
The BA
degree or equivalent is required. The programme is aimed to improve the cooperation between business and
educational institutions and to develop awareness of Eastern Partnership countries' culture, economics, law and public
administration.
The programme is taught by the best academics of Estonian and foreign universities and the experts and professionals
working in the field of cooperation with Russia and Eastern Partnership countries (see list of lecturers). The courses are
taught in English.
2013/2014 academic year programme is made of 7 courses during one year (from September to June). Total amounts of
credits to earn is 30
ECTS . All the credits collected can be added to or used in the curricula. It is necessary to fulfill 4 courses
out of 7 in order to get a
certificate .
Courses: Russian Economy
Business peculiarities in the EU, Russia and Eastern Partnership countries
Culture,
identity and ideology:
essential insights for
understanding Russia and Eastern partnership countries
Legal systems in Russia and Eastern Partnership countries: comparative
approach Institutional context of policymaking in economics and business: Russia and EU neigbourhood target countries
Specialized
seminar "Gripping lectures"
TRADERUN programme related
internship MORE INFO: http://www.traderun.ee/ 106


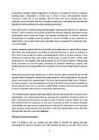
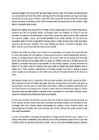
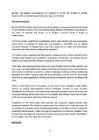
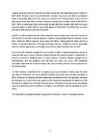
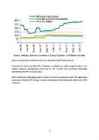
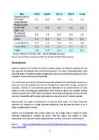
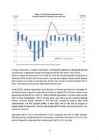
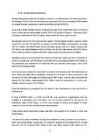
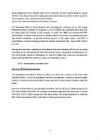
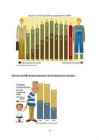
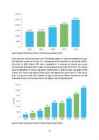
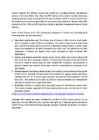
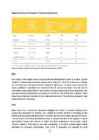
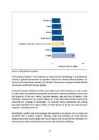
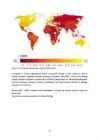
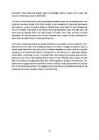
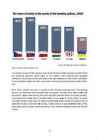
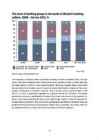
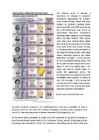
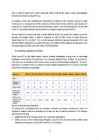
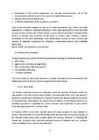
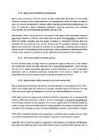
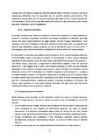
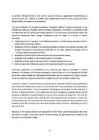
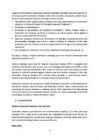
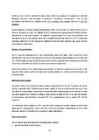
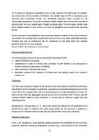
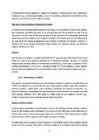
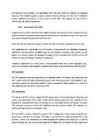
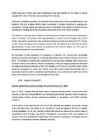
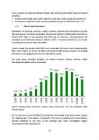
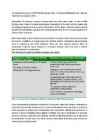


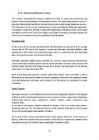
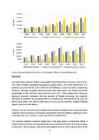
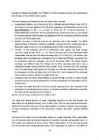
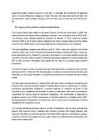
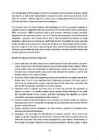

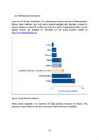
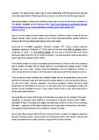
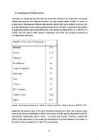
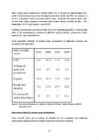
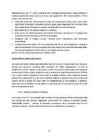
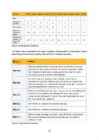
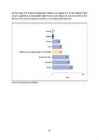
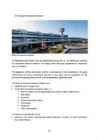
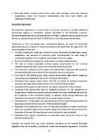
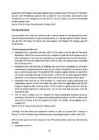
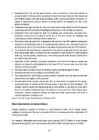
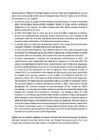
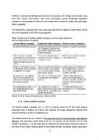
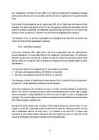
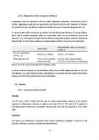
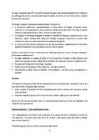
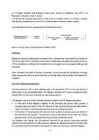
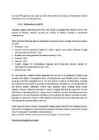

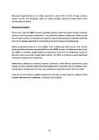
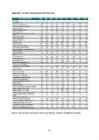
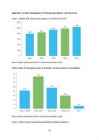
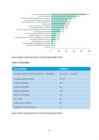
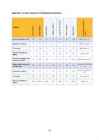

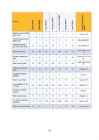

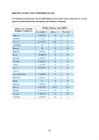

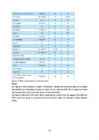
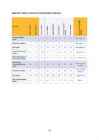

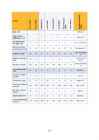
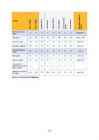
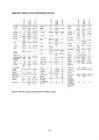


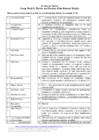

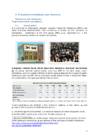
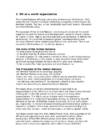
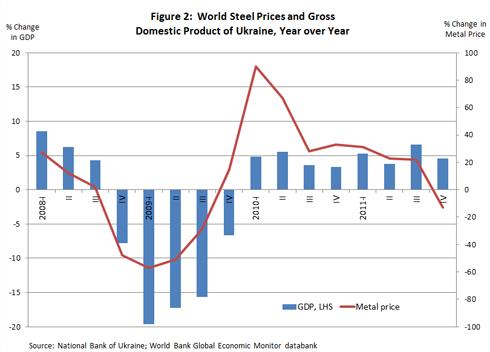
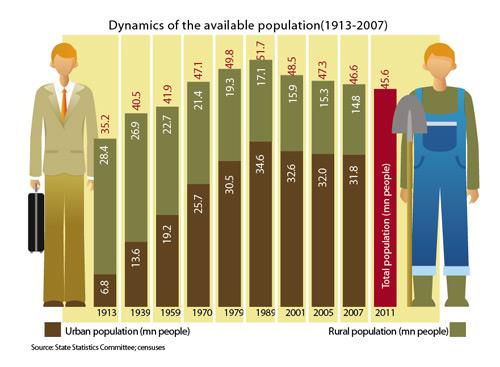

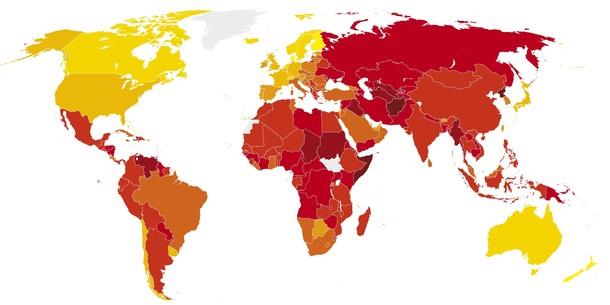
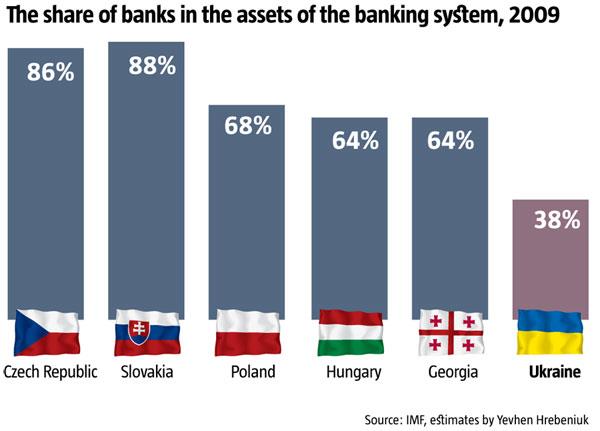
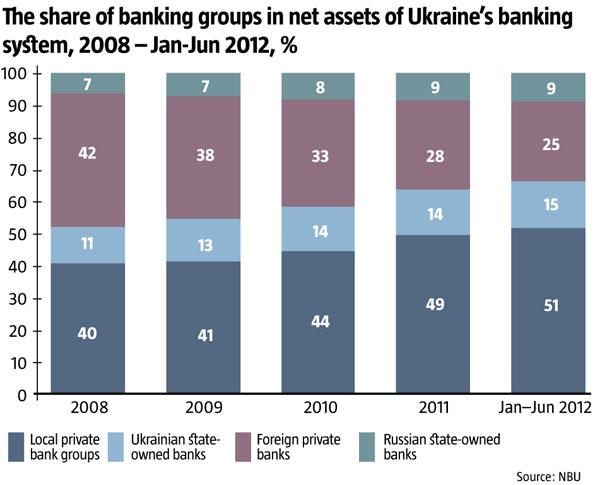
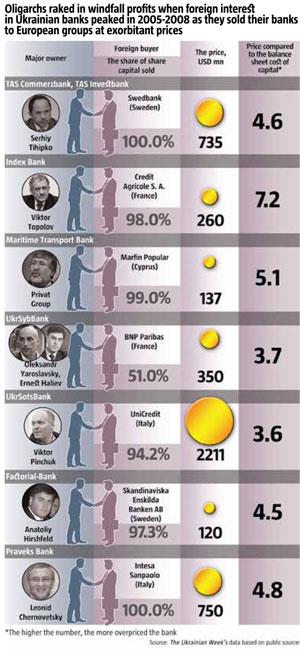

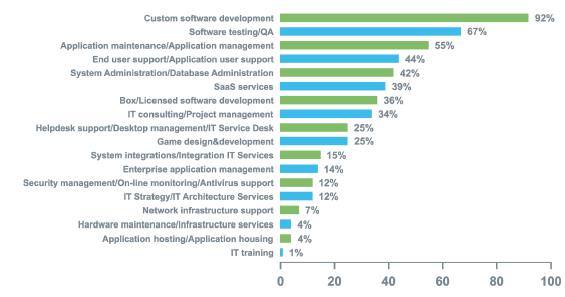
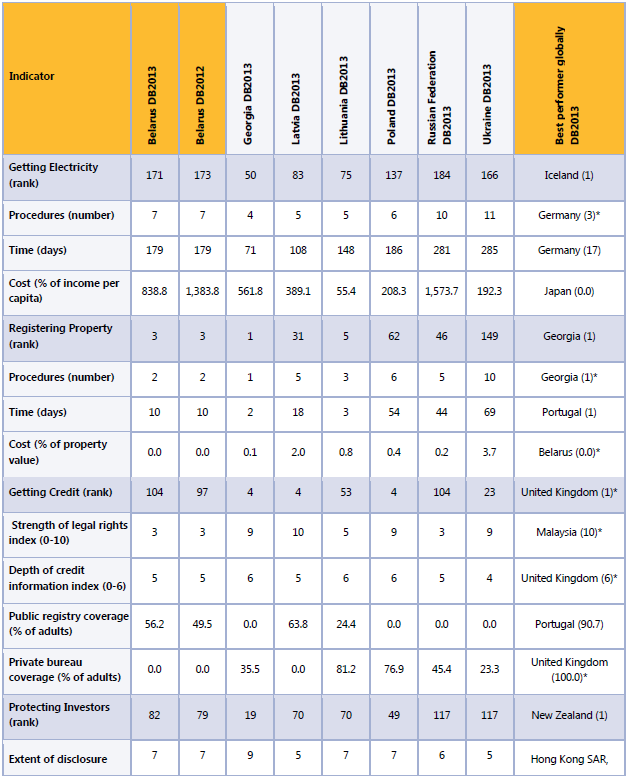
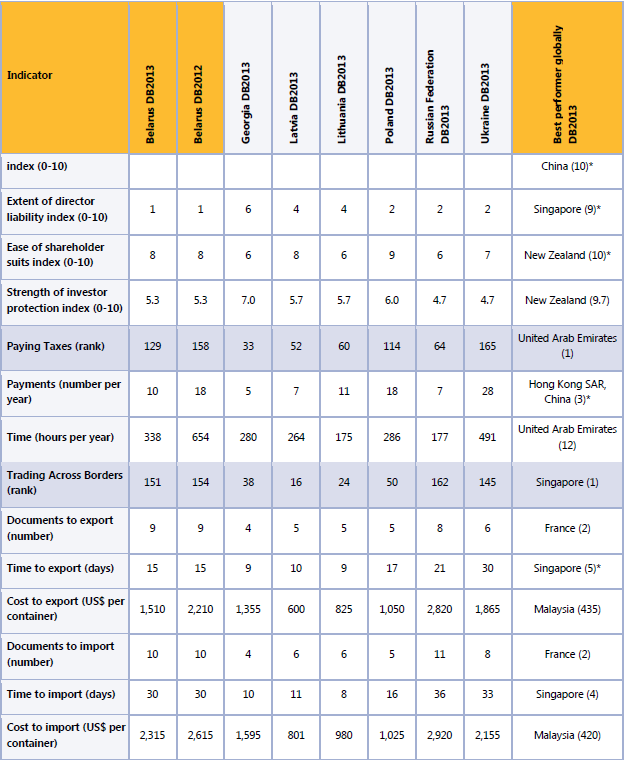
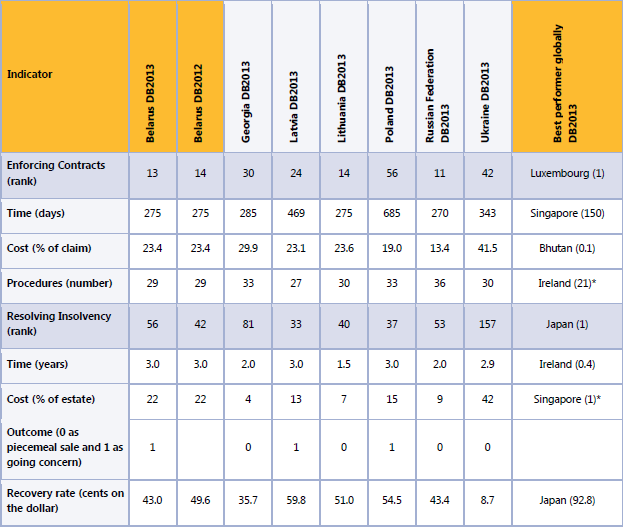
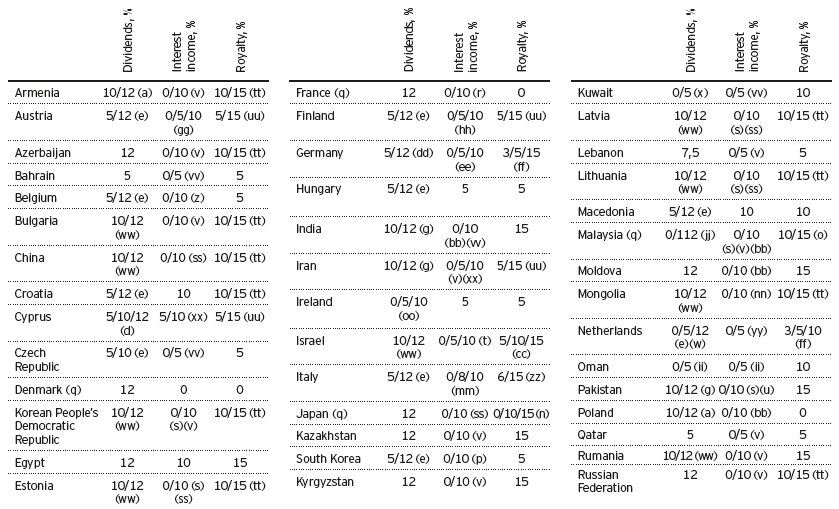
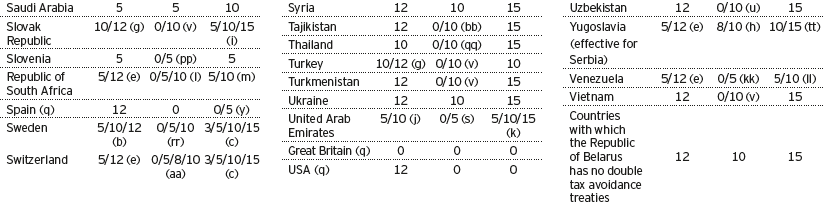

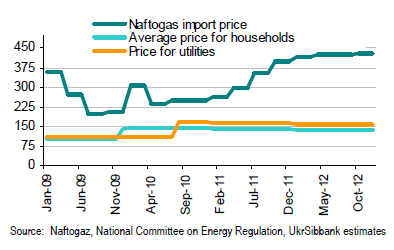
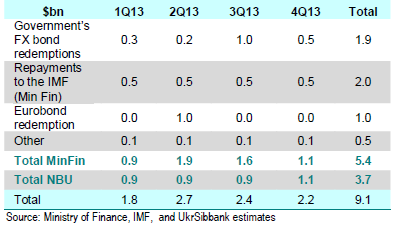

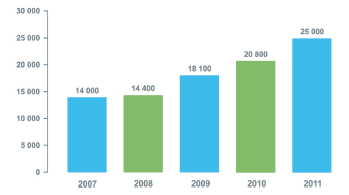
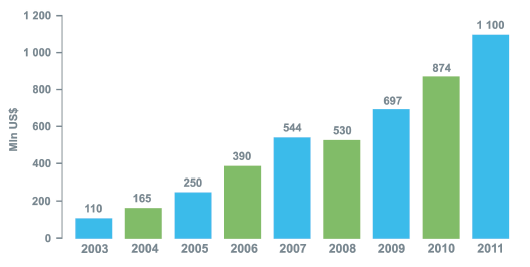
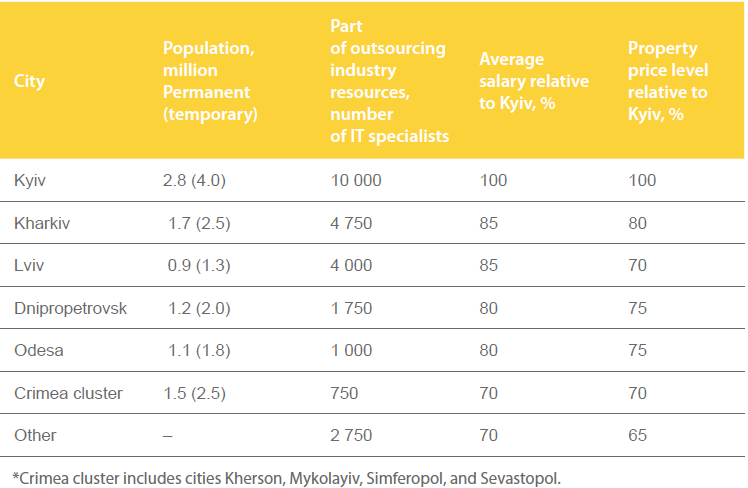
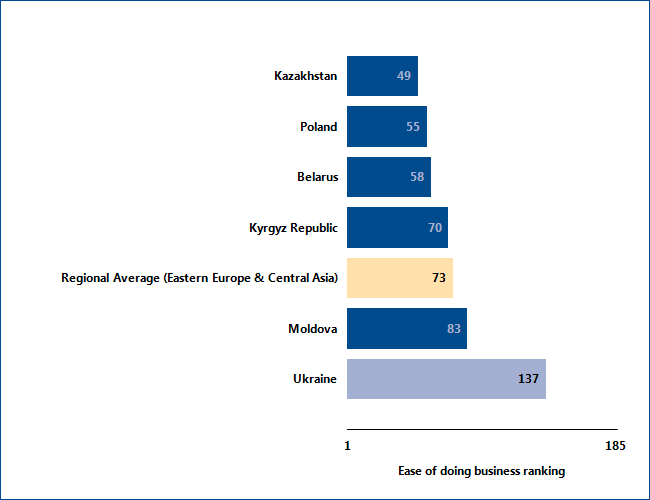
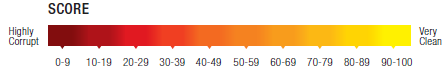
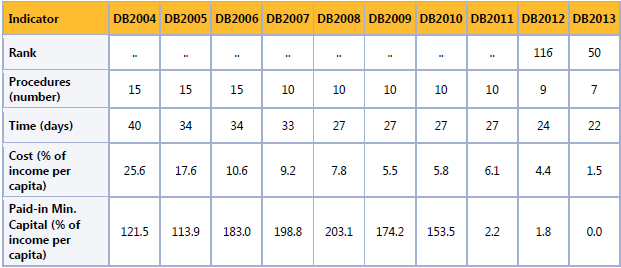
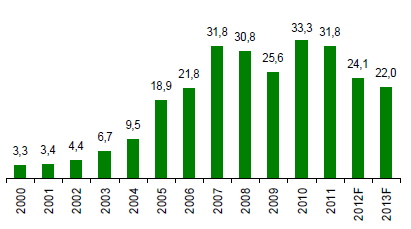
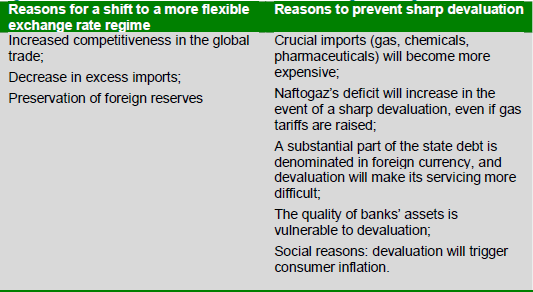
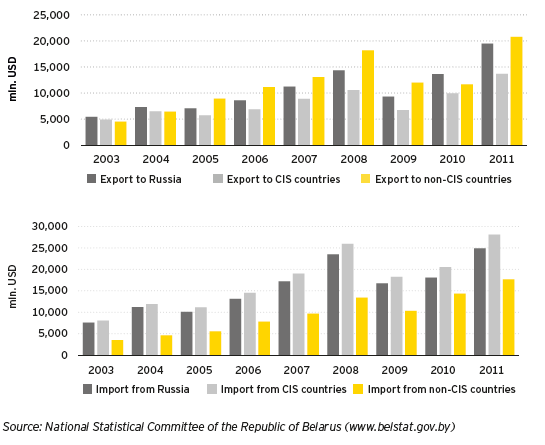
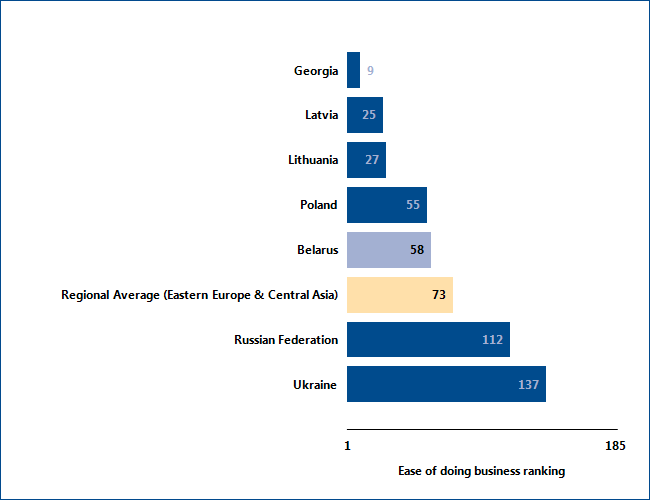
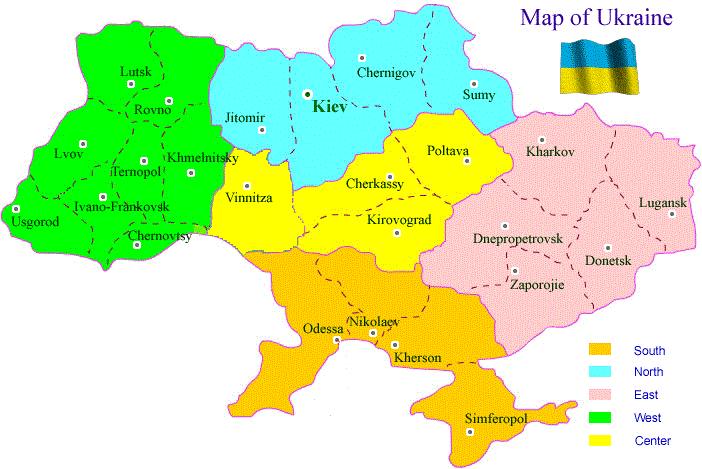
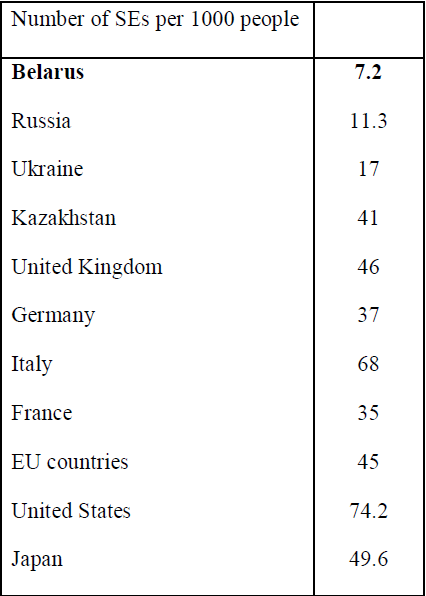
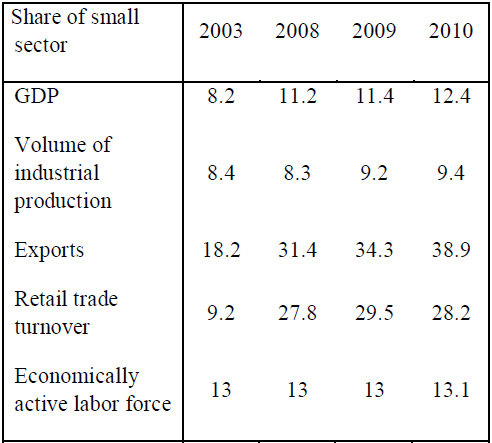
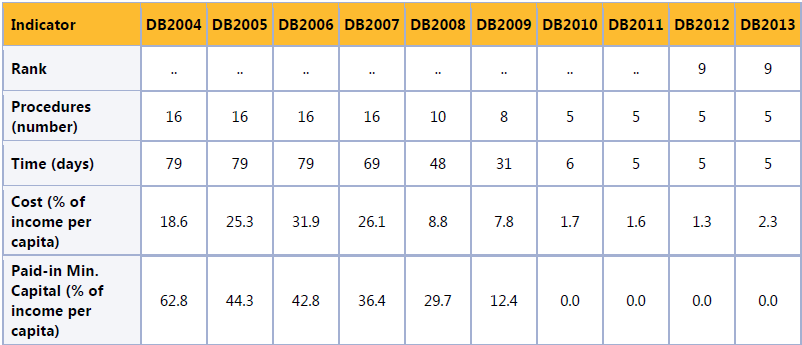
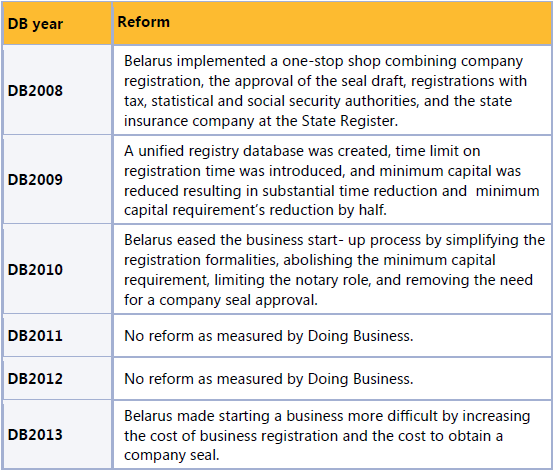
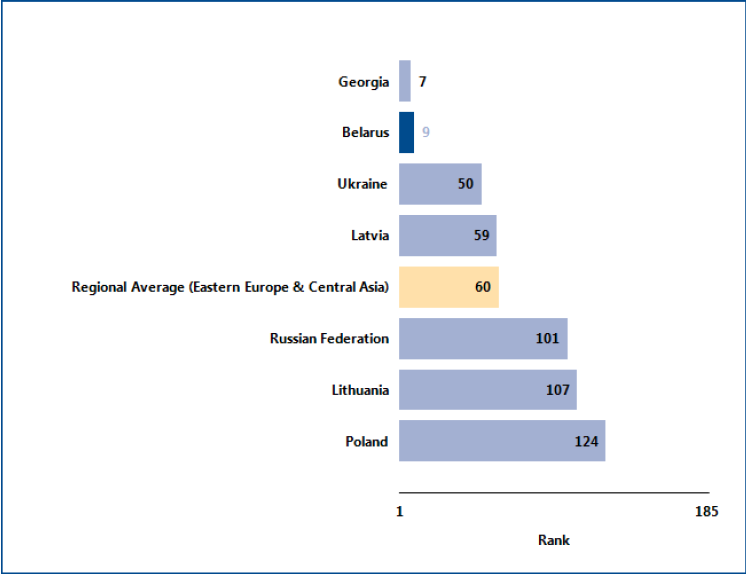
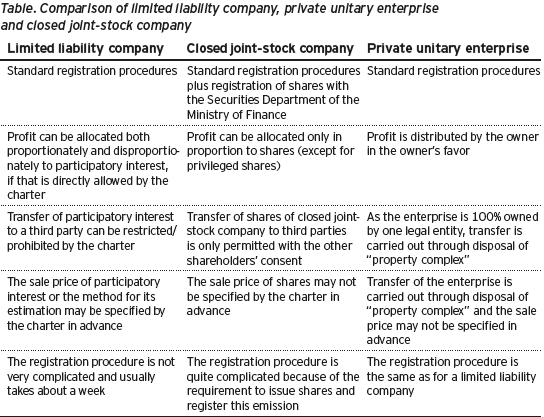
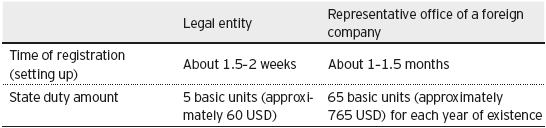
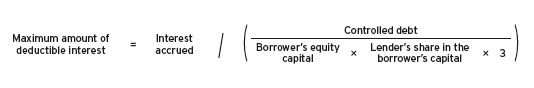
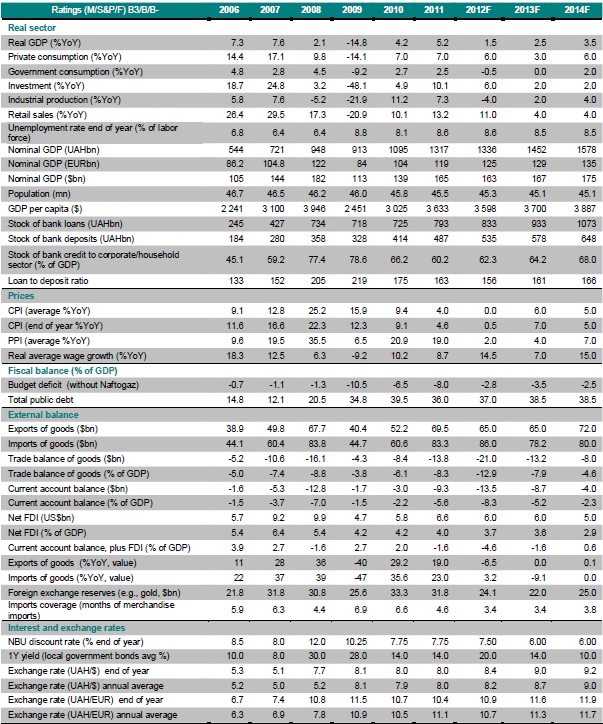
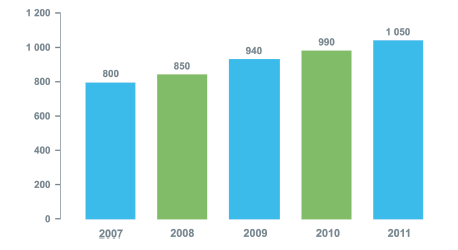
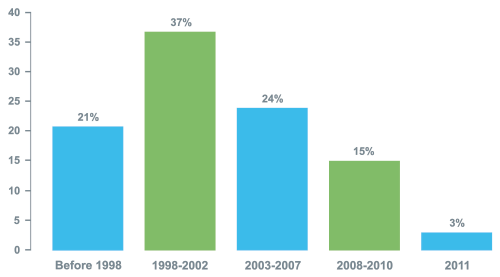
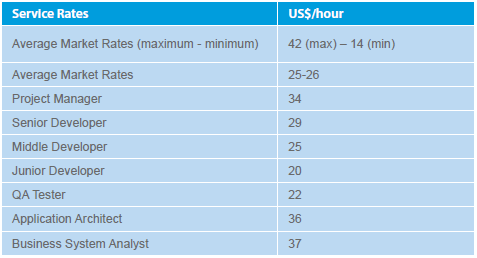
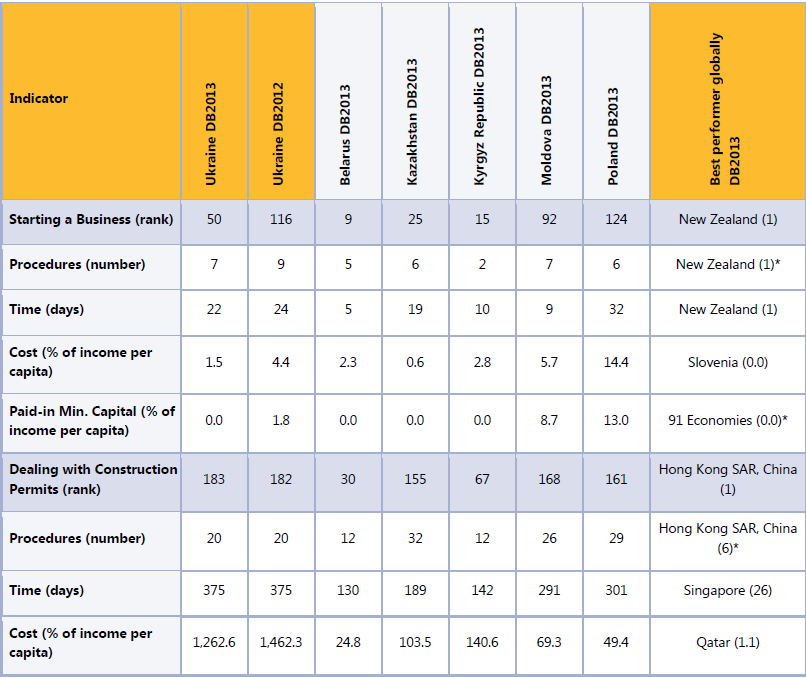
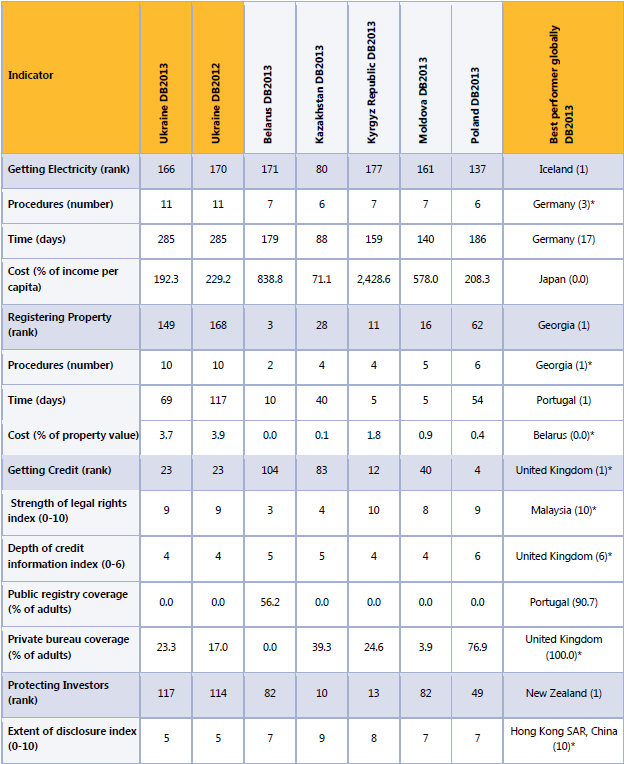
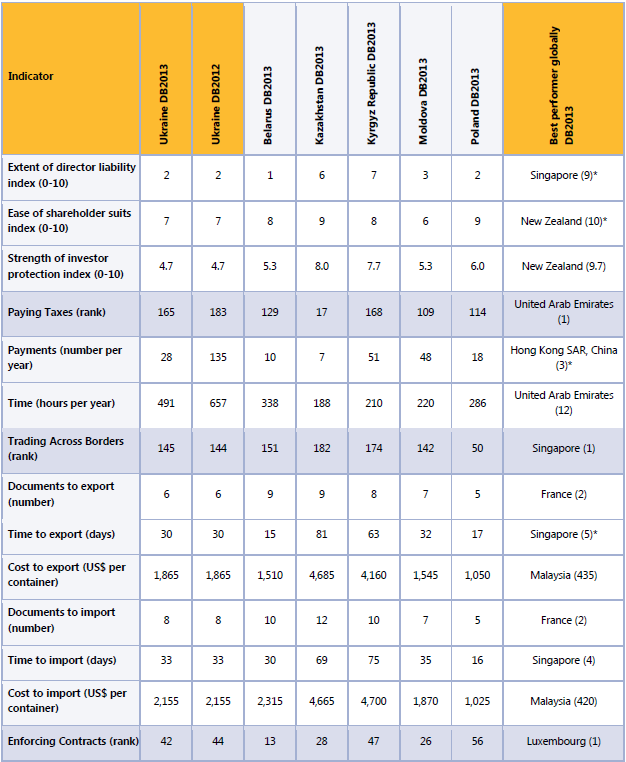
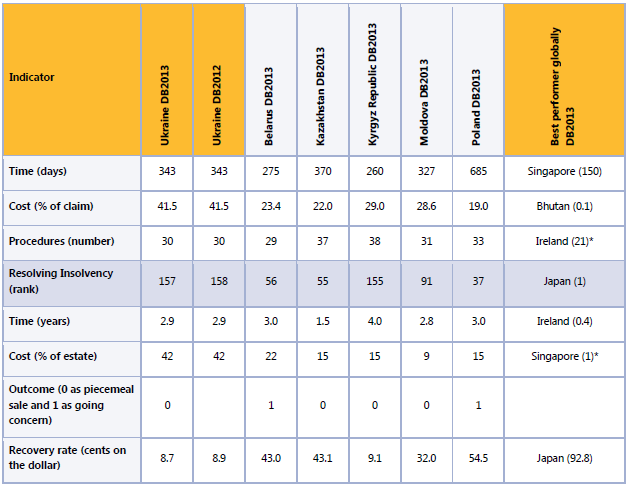
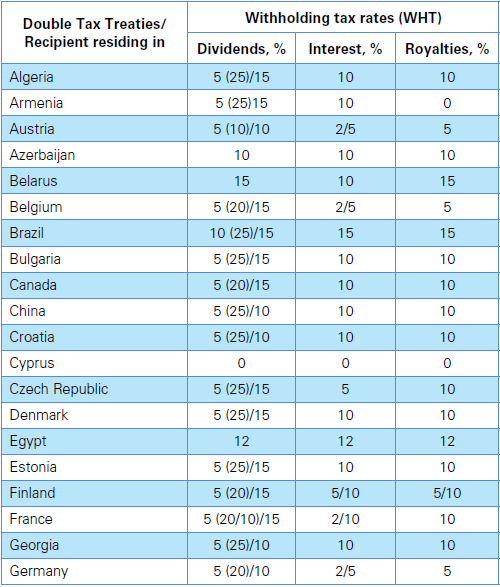
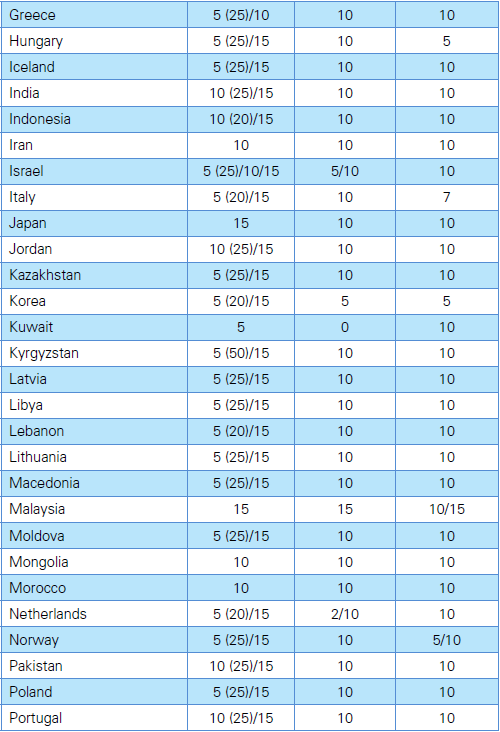
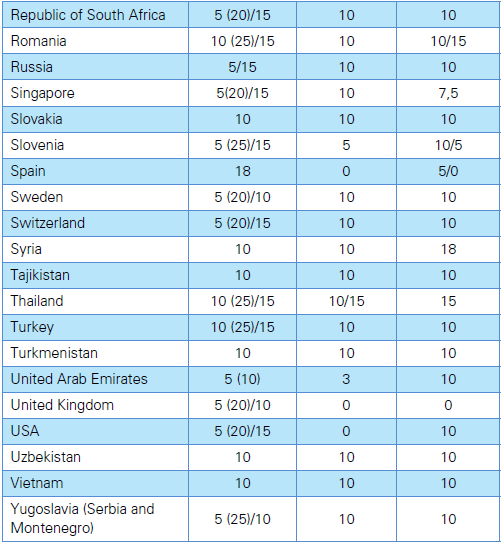
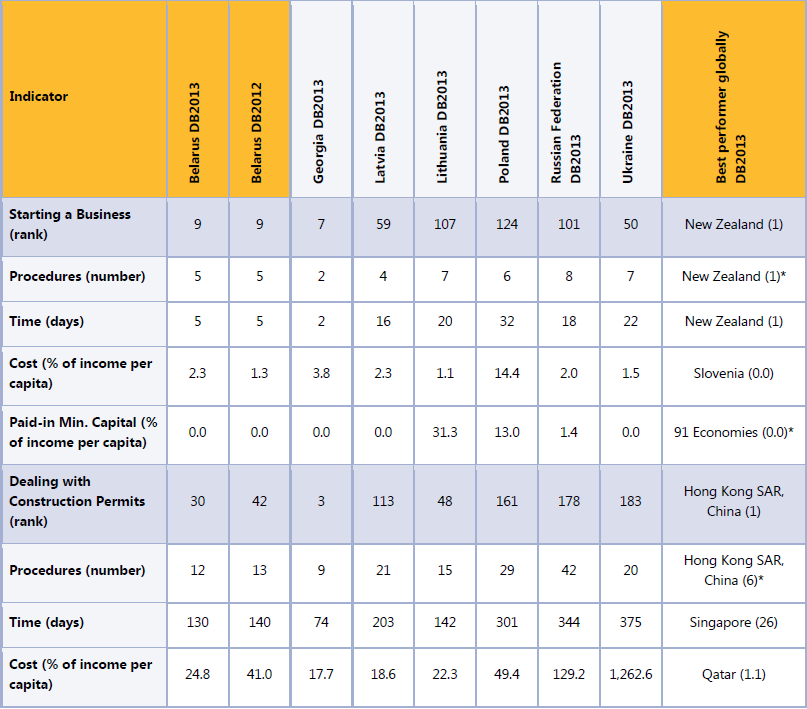


Kõik kommentaarid