Economic Country Review: Finland , Estonia and Hungary
Girli
Vasiljev
Report Business
Economics, RB1X
06.05.2012
Abstract 06.05.2012
Experience and
Wellness management Author Girli Vasiljev
GroupRB1X
Title of reportEconomic Country Review: Finland, Estonia and Hungary
Number of pages
20
Teacher Kalevi Torunen
The
goal of this
paper is to
compare the economic
performance of Finland, Estonia and Hungary.
First , a general
overview on the countries will be
given . After, economic indicators (
real GDP
growth rate , inflation,
unemployment , household
consumption , investment,
current account ,
government budget and deficit) of the three countries will be compared to
draw a
conclusion .
KeywordsGDP, inflation, unemployment, household consumption, investment, current account, government budget, deficit,
surplus Table
of contents1
Introduction ………………………………………………………………………......1
2
Country Specs …………………………………………………………………………1
2.1
Finland …………………………………………………………………….....1
2.1.1
Background …………………………………………………………1
2.1.2
Geography ……………………………………………………..........2
2.1.3
People and Society ……………………………………………..........2
2.1.4
Economic Overview………………………………………………...3
2.2
Estonia……………………………………………………………………......3
2.2.1 Background ………………………………………………………...3
2.2.2 Geography ……………………………………………………….....4
2.2.3 People and Society …………………………………………………4
2.2.4 Economic Overview…………………………………………….......5
2.3
Hungary …………………………………………………………………….
5
2.3.1
Background ………………………………………………………..
5
2.3.2
Geography …………………………………………………………..6
2.3.3
People and Society …………………………………………………..6
2.3.4
Economic Overview………………………………………………..
7
3.
Economic Indicators-
comparison …………………………………………………8
3.1
Real GDP Growth Rate…………………………………………………...8
3.2
Inflation…………………………………………………………………..9
3.3
Unemployment…………………………………………………………...10
3.4
Household Consumption………………………………………………...11
3.5
Investments………………………………………………………………12
3.6
Current Account…………………………………………………………13
3.7
Government Budget Deficit/Surplus……………………………………..14
4.
Summary………………………………………………………………………….15
5.
Sources ……………………………………………………………………………16
1
IntroductionThe
goal of this paper is to compare the economic performance of Finland,
Estonia and Hungary. Comparison of
different counties in a constantly
changing economic environment is
interesting , especially after the
economic
crisis . The
results of the
analysis will
provide us
information which of the countries has
done the
best in recovering.
First, a general overview on the countries will be given. After,
economic indicators (real GDP growth rate, inflation, unemployment,
household consumption, investment, current account, government budget
and deficit) of the three countries will be compared to draw a
conclusion.
2
Country Specs2.1
Finland2.1.1
BackgroundFinland
was a
province and then a grand duchy under
Sweden from the 12th to
the
19th centuries, and an autonomous grand duchy of
Russia after
1809. It won its
complete independence in 1917.
During World War II,
it was
able to successfully defend its
freedom and resist invasions
by the
Soviet Union - albeit with some loss of territory. In the
subsequent
half century , the
Finns made a remarkable transformation
from a
farm /
forest economy to a diversified modern
industrial economy; per
capita income is now
among the
highest in Western
Europe . A
member of the European Union
since 1995, Finland was the
only Nordic state to
join the euro system at its initiation in
January 1999. In the
21st century, the key
features of Finland's
modern welfare state are a high standard of education, equality
promotion , and national social
security system - currently challenged
by an aging population and the fluctuations of an
export -driven
economy (Central Intelligence
Agency , 2012, ISSN 1553-8133).
2.1.2
GeographyLocation :
Northern Europe, bordering the
Baltic Sea, Gulf of Bothnia, and Gulf
of Finland,
between Sweden and Russia
Area:
total : 338,145 km2-
land : 303,815 km2 and water: 34,330 km2
Coastline:
1250 km
Climate:
cold temperate; potentially subarctic but comparatively
mild because of
moderating
influence of the
North Atlantic Current, Baltic Sea, and
more
than 60,000
lakes Terrain:
mostly low,
flat to
rolling plains interspersed with lakes and low
hills Natural
resources:
timber ,
iron ore,
copper ,
lead ,
zinc , chromite,
nickel ,
gold ,
silver , limestone
Land use: arable land: 6.54%,
permanent crops: 0.02%,
other : 93.44% (2005)
Environment-
current
issues : air pollution from
manufacturing and
power plants contributing to acid rain; water pollution from industrial wastes,
agricultural
chemicals ;
habitat loss threatens
wildlife populations
(Central
Intelligence Agency, 2012, ISSN 1553-8133).
2.1.3
People and SocietyEthnic
groups: Finn 93.4%, Swede 5.6%,
Russian 0.5%, Estonian 0.3%,
Roma (Gypsy) 0.1%,
Sami 0.1% (2006)
Languages:
Finnish (
official ) 91.2%,
Swedish (official) 5.5%, other (small Sami-
and Russian-speaking minorities) 3.3% (2007)
Religions:
Lutheran
Church of Finland 82.5%,
Orthodox Church 1.1%, other
Christian 1.1%, other 0.1%,
none 15.1% (2006)
Population:
5,262,930 (
July 2012 est.)
Life
expectancy at
birth : total population: 79.41
years -
male : 75.94
years,
female : 83.02 years (2012 est.)
Health
expenditures: 11.7% of GDP (2009)
Education
expenditures: 5.9% of GDP (2007)
(Central
Intelligence Agency, 2012, ISSN 1553-8133).
2.1.4
Economic OverviewFinland
has a
highly industrialized; largely free-
market economy with per
capita output roughly that of Austria, Belgium, the
Netherlands , and
Sweden. Trade is
important with exports accounting for over one third
of GDP in
recent years. Finland is strongly
competitive in
manufacturing - principally the
wood , metals,
engineering ,
telecommunications, and electronics industries. Finland excels in
high-
tech exports
such as
mobile phones . Except for timber and
several minerals, Finland depends on imports of raw materials,
energy, and some components for manufactured
goods . Because of the
climate, agricultural
development is limited to maintaining
self-sufficiency in
basic products .
Forestry , an important export
earner, provides a secondary
occupation for the
rural population.
Finland had been one of the best performing
economies within the EU
in recent years and its
banks and financial
markets avoided the worst
of
global financial crisis.
However , the world slowdown hit exports
and
domestic demand hard in 2009, with Finland experiencing one of
the deepest contractions in the euro zone. A
recovery of exports,
domestic trade, and household consumption stimulated economic growth
in 2010. The
recession left a
deep mark on general government
finances and the
debt ratio,
turning previously
strong budget
surpluses into deficits. In
addition to
marginal growth prospects,
general government finances will remain in deficit during the next
few years. The great challenge of economic policy will be to mitigate
a possible recession in 2012 in which
measures supporting growth will
be combined with general government adjustment measures. Longer-
term ,
Finland must address a rapidly aging population and decreasing
productivity that threaten competitiveness, fiscal sustainability,
and economic growth (Central Intelligence Agency, 2012, ISSN
1553-8133).
2.2
Estonia2.2.1
BackgroundAfter
centuries of Danish, Swedish,
German , and Russian
rule , Estonia
attained independence in 1918. Forcibly incorporated into the USSR in
1940 - an
action never recognized by the US - it regained its freedom
in 1991 with the collapse of the Soviet Union. Since the last Russian
troops left in 1994, Estonia has been free to promote economic and
political ties with the
West . It joined
both NATO and the EU in the
spring of 2004, formally joined the
OECD in
late 2010, and adopted
the euro as its official
currency on 1 January 2011 (Central
Intelligence Agency, 2012, ISSN 1553-8133).
2.2.2
GeographyLocation:
Eastern Europe, bordering the Baltic Sea and Gulf of Finland, between
Latvia and Russia
Area:
total: 45,228 km2- land: 42,388 km2 and water: 2,840 km2
Coastline:
3794 km
Climate:
maritime; wet, moderate winters, cool
summers Terrain:
marshy, lowlands; flat in the north, hilly in the
south Land
use: arable land: 12.05%, permanent crops: 0.35%, other: 87.6% (2005)
Environment-
current issues: air polluted with
sulfur dioxide from oil-shale
burning power plants in northeast; however, the
amount of pollutants
emitted to the air have fallen steadily, the
emissions of 2000 were
80% less than in 1980; the amount of unpurified wastewater discharged
to water bodies in 2000 was 1/20 the level of 1980; in
connection with the start-up of new water purification plants, the pollution
load of wastewater decreased; Estonia has more than 1,400 natural and
manmade lakes, the smaller of which in agricultural
areas need to be
monitored;
coastal seawater is polluted in certain locations
(Central
Intelligence Agency, 2012, ISSN 1553-8133).
2.2.3
People and societyEthnic
groups: Estonian 68.7%, Russian 25.6%, Ukrainian 2.1%, Belarusian
1.2%, Finn 0.8%, other 1.6% (2008
census )
Languages:
Estonian (official) 67.3%, Russian 29.7%, other 2.3%, unknown 0.7%
(2000 census)
Religions:
Evangelical Lutheran 13.6%, Orthodox 12.8%, other Christian
(
including Methodist, Seventh-Day Adventist,
Roman Catholic ,
Pentecostal) 1.4%, unaffiliated 34.1%, other and unspecified 32%,
none 6.1% (2000 census)
Population:
1,274,709 (July 2012 est.)
Life
expectancy at birth: total population: 73.58 years- male: 68.3 years,
female: 79.19 years (2012 est.)
Health
expenditures: 4.3% of GDP (2009)
Education
expenditures: 4.9% of GDP (2007)
(Central
Intelligence Agency, 2012, ISSN 1553-8133).
2.2.4
Economic OverviewEstonia,
a 2004 European Union entrant, has a modern market-based economy and
one of the
higher per capita income levels in Central Europe and the
Baltic
region . Estonia's successive governments have pursued a free
market, pro-business economic agenda and have wavered
little in their
commitment to pro-market reforms. The current government has followed
sound fiscal policies that have resulted in balanced budgets and low
public debt. The economy benefits from strong electronics and
telecommunications sectors and strong trade ties with Finland,
Sweden, Russia, and
Germany . Tallinn's
priority has been to sustain
high growth rates - on
average 8% per
year from 2003 to 2007.
Estonia's economy
fell sharply into recession in mid-2008, primarily
as a
result of an investment and consumption slump
following the
bursting of the real
estate market bubble. Estonia has rebounded well
from the economic crisis. GDP contracted 14.3% in 2009, but the
Estonian economy now has the highest GDP growth rate in Europe,
largely
thanks to a boom in exports and increased
foreign investment
following Estonia's adoption of the euro on 1 January 2011.
Although Estonian GDP returned to
positive growth in 2010, unemployment
continued to
rise , reaching an all-time high of 19.8% in
early 2010
(Central Intelligence Agency, 2012, ISSN 1553-8133).
2.3
Hungary2.3.1
BackgroundHungary
became a Christian kingdom in A.D. 1000 and for many centuries served
as a bulwark against Ottoman Turkish expansion in Europe. The kingdom
eventually became
part of the polyglot Austro-
Hungarian Empire , which
collapsed during World War I. The country fell under Communist rule
following World War II. In 1956, a revolt and an announced withdrawal
from the
Warsaw Pact were met with a
massive military intervention by
Moscow . Under the
leadership of Janos KADAR in 1968, Hungary began
liberalizing its economy, introducing so-called "Goulash
Communism." Hungary
held its first multiparty elections in 1990
and initiated a free market economy. It joined NATO in 1999 and the
EU
five years
later . In 2011, Hungary assumed the six-
month rotating
presidency of the EU for the first time (Central Intelligence Agency,
2012, ISSN 1553-8133).
2.3.2
GeographyLocation:
Central Europe, northwest of Romania
Area:
total: 93 028 km2- land: 89 608 km2 and water: 3 420 km2
Coastline:
0 km
Climate:
temperate; cold,
cloudy , humid winters;
warm summers
Terrain:
mostly flat to rolling plains; hills and low
mountains on the
Slovakian border
Natural
resources: bauxite,
coal , natural gas,
fertile soils, arable land
Land
use: arable land: 49.58%, permanent crops: 2.06%, other: 48.36%
(2005)
Environment-
current issues: the upgrading of Hungary's standards in
waste management, energy efficiency, and air,
soil , and water pollution to
meet EU
requirements will require large investments
(Central
Intelligence Agency, 2012, ISSN 1553-8133).
2.3.3
People and SocietyEthnic
groups: Hungarian 92.3%, Roma 1.9%, other or unknown 5.8% (2001
census)
Languages:
Hungarian 93.6%, other or unspecified 6.4% (2001 census)
Religions:
Roman Catholic 51.9%, Calvinist 15.9%, Lutheran 3%,
Greek Catholic
2.6%, other Christian 1%, other or unspecified 11.1%, unaffiliated
14.5% (2001 census)
Population:
9,958,453 (July 2012 est.)
Life
expectancy at birth: total population: 75.02 years- male: 71.27
years, female: 78.98 years (2012 est.)
Health
expenditures: 8.2% of GDP (2009)
Education
expenditures: 5.2% of GDP (2007)
(Central
Intelligence Agency, 2012, ISSN 1553-8133).
2.3.4
Economic OverviewHungary
has made the transition from a centrally planned to a market economy,
with a per capita income
nearly two-thirds that of the EU-25 average.
The private sector
accounts for more than 80% of GDP. Foreign
ownership of and investment in Hungarian
firms are widespread, with
cumulative foreign
direct investment worth more than $70
billion . In
late 2008, Hungary's impending inability to
service its short-term
debt -
brought on by the global financial crisis - led Budapest to
obtain an IMF/EU/World
Bank -arranged financial assistance
package worth over $25 billion. The global economic downturn, declining
exports, and low domestic consumption and
fixed asset
accumulation ,
dampened by government austerity measures, resulted in an economic
contraction of 6.3% in 2009. In 2010 the new government implemented a
number of
changes including cutting business and personal income
taxes , but
imposed "crisis taxes" on financial
institutions , energy and
telecom companies , and retailers. The IMF/EU
bail-out
program lapsed at the end of the year and was replaced by
Post Program Monitoring and Article IV Consultations on
overall economic and fiscal processes. The economy began to recover in 2010
with a big
boost from exports, especially to Germany, and achieved
growth of
approximately 1.4% in 2011. At the end of 2011 the
government turned to the IMF and the EU to obtain a new
loan for
foreign currency debt and
bond obligatins in 2012 and
beyond . Whether
negotiations result in a loan
depend on Hungary
meeting EU and IMF
requirements for ensuring the independence of monetary,
judicial , and
data
privacy institutions. The EU also launched an Excessive Deficit
Procedure and
requested that the government outline measures to
sustainably
reduce the budget deficit to under 3% of GDP.
Unemployment remained high, at more than 11% in 2011. Ongoing
economic weakness in Western Europe is likely to
further constrain
growth in 2012 (Central Intelligence Agency, 2012, ISSN 1553-8133).
3
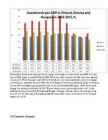
Economic Indicators- Comparison3.1
Real GDP growth rateAnalyzing
the
graph , we can
notice that the real GDP growth rate has been
rising and falling most in Estonia. And we can see that the economic
crisis hit Estonia hardest as we can see from 2008 when Estonia was
only one from those 3 that´s real GDP growth rate was
negative . Of
course the other 2 countries followed Estonia during the next
year-2009 with showing negative performance in their real GDP growth
rates.
Estonia´s real GDP growth rate is most volatile with its
ups and downs,
while Finland and Hungary are more stable. However,
Finland suffered
quite rapid loss in real GDP growth rate in 2009,
when it reached -8,4%.
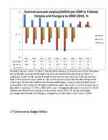
3.2
InflationAnnual
inflation rate has been the lowest
throughout the years in Finland.
Hungary and Estonia are showing continuously higher annual inflation
rate. When the crisis hit in 2008, the inflation rate
went up as a
rocket for all of those countries, especially for Estonia, however it
is remarkable that the next year-2009- Estonia´s annual inflation
rate
dropped rapidly from 10,6% to 0,2%. It stayed
rather low for 2
years and after Estonia changed their currency to euros, the annual
inflation rate went up
again and is continuously
growing . Also I
would point out Finland´s annual inflation rate, that the country
has
managed to
keep in a
good low level, especially in the year of
2004, when it was only 0,1%.
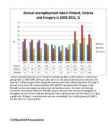
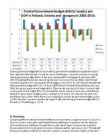
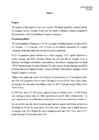
3.3
UnemploymentAnnual
unemployment rate in all 3 countries
started to go down as the
economic situation was
getting better in 2005-2008. Obviously after
the crisis, the annual unemployment rate grew a lot, especially in
Estonia again.
Even though the unemployment rate in Estonia has been
very high in the past recent years, the situation between 2010 and
2011 has gotten better. Hungary´s and Finland´s recent years annual
unemployment rate has been more or less
same , not showing remarkable
improvement. However Finland´s annual unemployment rate has not
changed a lot throughout the last 10 years, and now
having the lowest
unemployment rate from those 3 it is quite a good result. Hungary´s
unemployment rate was outstandingly low in the
beginning of 2000‘s,
but after the crisis it grew
greatly .
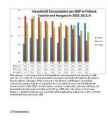
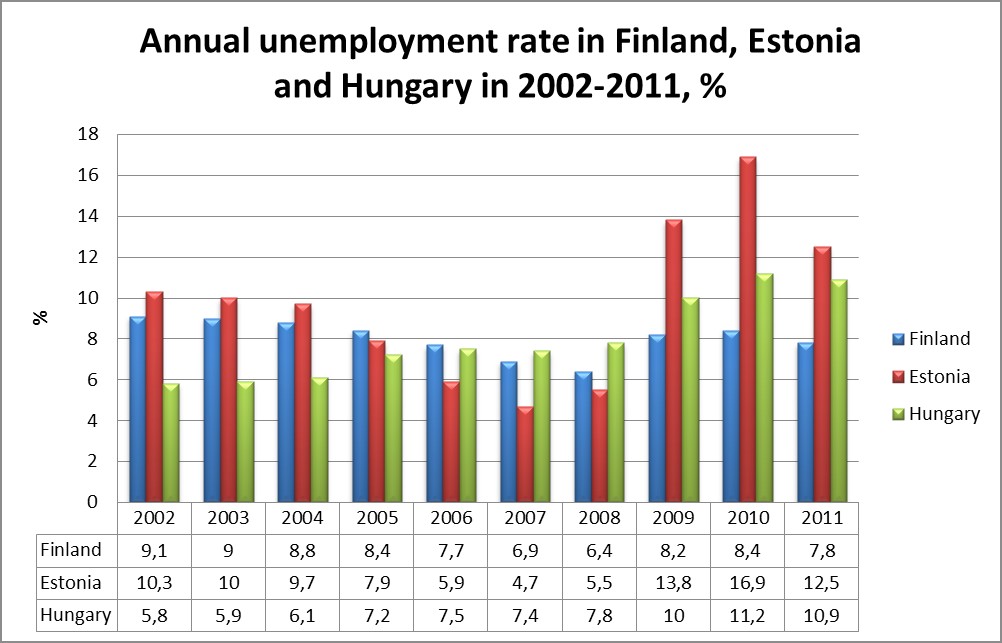
3.4
Household ConsumptionThat
indicator is interesting to
follow . Finland had the lowest household
consumption per GDP
until the crisis. After the crisis the household
consumption increased in Finland, but decreased in Estonia and also
in Hungary. What is
amazing is that Estonia´s and Hungary´s
household consumption stayed so high for so long
before the crisis
and at the same time Finland showed humble
numbers (2002-2008). As
the economic situation is unfavorable right now in Estonia, the
household consumption has
come down to 50,9% per GDP, that is the
lowest in 10 last years. Hungary is
ahead from Estonia covering 52,9%
and Finland had the
leading role in 2011 with 55% of household
consumption per GDP.
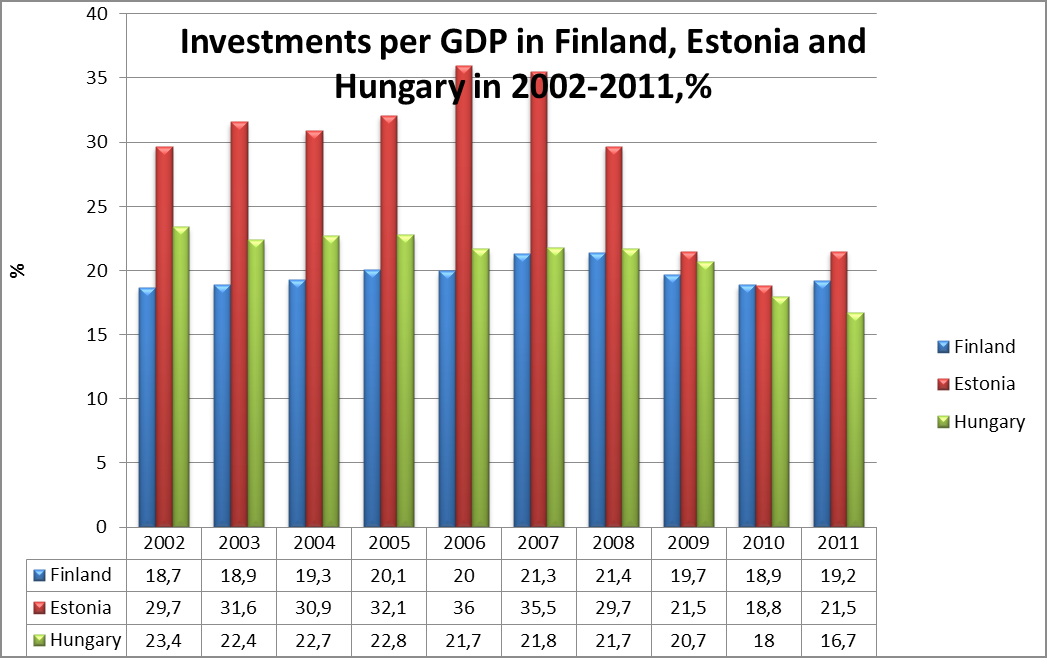
3.5
InvestmentsRemarkably,
Estonia has had enormously higher percentages in investments per GDP.
It´s
peak was in 2006, when it reached 36% of GDP. While the other
countries on that same year showed results as 21,7% for Hungary and
20% for Finland only. As mentioned before, the crisis
change circumstances, and after the year 2008, the percentage of investments
dropped rapidly for Estonia, but not that tremendous gap
appeared in
the results of Finland and Hungary:
there was a slight change but
nothing remarkable. In 2011 Estonia
shows minor growth again and is
still in the leading position compared to Finland and Hungary.
Hungary has the lowest rate staying on the level of 16,7 %.
Once again Finland has had the most stable results with lowest of 18,7 %
and highest of 21,4 %.
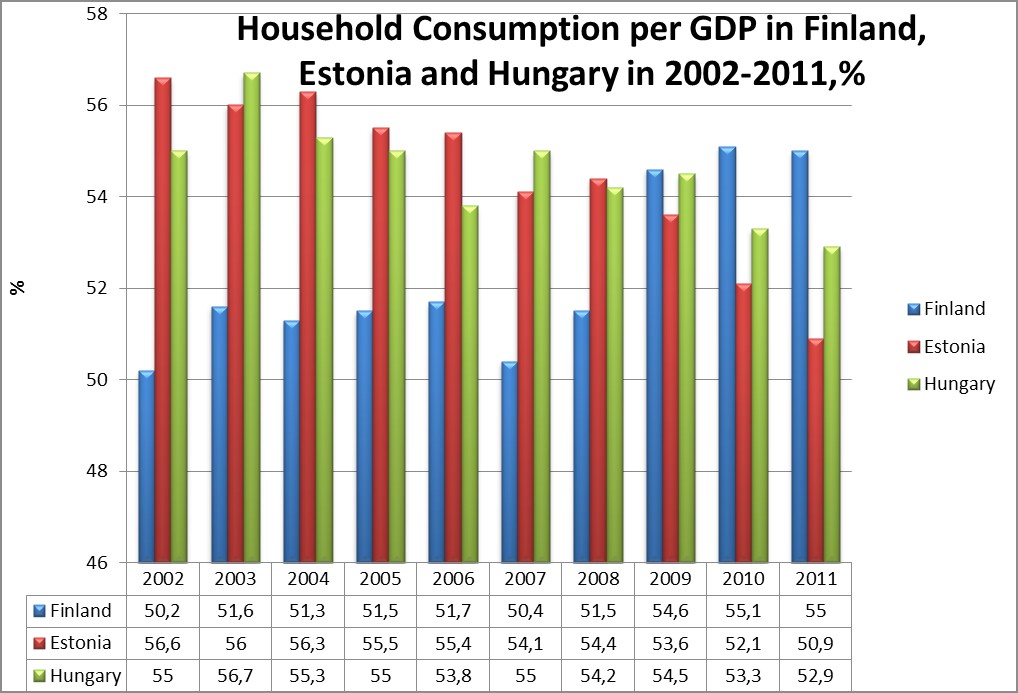
3.6
Current Account
Finland
is the only country of those 3 that has been
running a current
account surplus throughout the last decade;
meaning that Finland is
the only one that has been absorbing less than it is producing, in
other
words - saving. Finland´s export
articles play a big role in
having relatively high current account surplus; however, the current
account surplus has been decreasing within recent years. On the other
hand we have Estonia and Hungary, countries that both had current
account deficit for a long time. Emphasizing Estonia again: the
country´s current account was in deep deficit, reaching -15, 9 % in
2007, after a year it managed to decrease it to a level of -9,9 % and
next year Estonia was running current account surplus of 3,7 %,
having even higher percentage than Finland. Also Hungary managed to
turn their deficit into surplus in 2010.
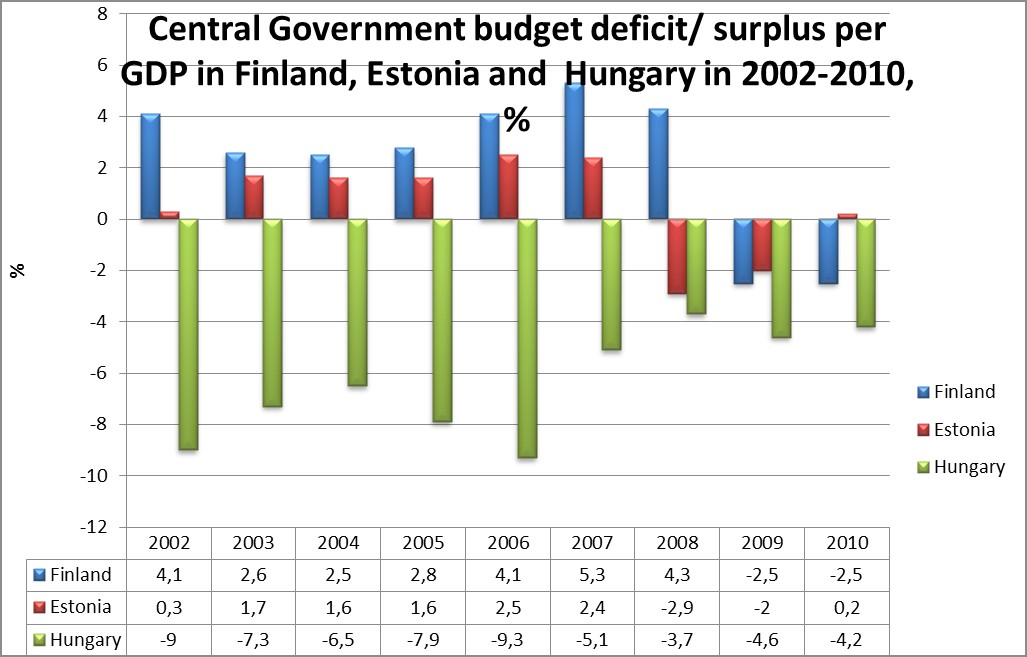
3.7
Government Budget DeficitCentral
government budget deficits
occur when a government's expenditures
exceed the
revenue that it generates. Bearing that in mind, we can
see that Hungary is a
perfect example on creating central government
budget deficit. It has been running a deficit throughout 9 years from
2002-2010. Finland and Estonia have been
taking the same route except
the year 2008, when Finland was showing good results, having
government budget surplus of 4,3 %, while Estonia dropped and had a
government budget deficit of -2,9 % per GDP. However, Finland
followed Estonia next year, 2009, having also a government budget
deficit. That was the year that all of those 3 countries had a
central government budget deficit. It remained that way for couple of
more years, when Estonia showed it´s government´s budget surplus,
running a 0,2 % surplus. It is basically the same level that Estonia
was in 2002. While Estonia was struggling to
increase the government
budget surplus in 2010, the other 2 countries stayed in the negative
side, both having government budget deficits; Finland -2,5 % and
Hungary -4,2 %.
4.
SummaryComparing
different indicators between different countries shows us a general
economic
picture in the given country. After analyzing Finland,
Estonia and Hungary I would say that the indicators were not
dramatically different. It might
refer to a
fact that all those 3
countries are
situated in Europe and are driven by the general
situation in that area and the regulations as well. Finland and
Estonia are neighbors and I believe that one’s economic situation
influences slightly of the other´s condition. Nevertheless, after
looking at the different variables, I noticed that Finland was the
most stable country, it didn´t have as volatile movements as Estonia
did for example.
Clearly Estonia was the most surprising country as
it rates
could have been in negative
sides in one year and the other
it would be
already on the positive side and growing (current account
deficit to surplus in 2009). It was obvious from the graphs that
Estonia was the country that was
influenced most when the crisis hit
in 2008, but it has rebounded well after. I would
rank the countries
based on their results throughout the last decade as 1. And the best
would be Finland, 2. Hungary as it has been showing average results
and 3. Would be Estonia due to the damage that crisis brought to the
country. However the economic forecast for years 2011-2013
says about
Estonia: The Estonian economy grew faster than
expected in the first
three quarters of 2011. The expansion was mostly driven by the
favorable market environment and invigorating domestic demand. The
post-downturn hike in the Estonian export
volume has been impressive.
Both households and
enterprises in Estonia bought more durable goods,
stepped up investment and were more willing to borrow (Estonian
economy and monetary policy, 2011, p. 2). Basically predicting growth
to Estonia´s economy and probably the overall economic picture in
Europe will get a slightly positive
tone after the years of
depression, including Finland and Hungary as well.
5.
Sources
Central
Intelligence Agency, 2012, URL:
https://www.cia.gov/library/publications/the-world-factbook/geos/fi.html Central
Intelligence Agency, 2012, URL:
https://www.cia.gov/library/publications/the-world-factbook/geos/en.html Central
Intelligence Agency, 2012, URL:
https://www.cia.gov/library/publications/the-world-factbook/geos/hu.html European
commission:
Eurostat , 2012,
URL:
http://epp.eurostat.ec.europa.eu/portal/page/portal/eurostat/home/ Estonian
Economy and Monetary Policy, 2011, URL:
http://www.eestipank.info/pub/en/dokumendid/publikatsioonid/seeriad/ylevaade/_2011_02/_4_211.pdf?ok=1 0


Kõik kommentaarid