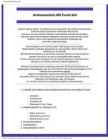
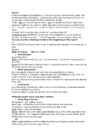
Working Group on information (PSIWG) 1st edition - November 2004 Kort & Matrikelstyrelsen Graphic design: Peter M. Bastrup, KMS This compendium may be reproduced in whole or in part provided that all extracts quoted are reproduced verbatim without adaptation and the source and date are stated. Primar Stavanger and IC-ENC shall be indentified as the originators of the compendium. 2 Facts about chart carriage reguirements CONTENTS Introduction . . . . . . . . . . . . . . . . . . . . . . . . . . . . . . . . . . . . . . . . . . . . . . . . . . . . . . . . . .4 Where are the rules for professional marine navigation written down? . . . . . . . . . . .6 What are the IMO requirements for the carriage of nautical charts? . . . . . . . . . . . . .6 What is a nautical chart? . . . . . . . . . . . . . . . . . . . . . . . . . . . . . . . . . . . . . . . . . . . . . . . .7
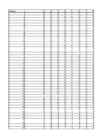
Bussi osalusel 72 79 91 109 78 1. Koosta 2017 a toimunud liiklusõnnetuste põhjal sektordiagramm. Diagramm peab olema võimalikult sarnane näidisega. Vii kursor 2017. a vabalt valitud väärtusele, klõpsa hiire paremat klahvi ja vali Sort-Sort Larges to Smallest. Märgista andmed A veerus, seejärel vajuta alla Ctrl klahv, märgista andmed F veerus, vali Insert menüüst käsud Insert Pie or Doughnut Chart-Pie. Sisesta pealkiri. Kustuta legend. Diagrammile väärtuste ja andmesiltide lisamiseks ning % näitamiseks klõpsa diagrammi parema kõrval olevat + märki ja vali Data Label-More Options. Märgista Category Name, eemalda märgistus Value eest, märgista Percentage ning vali Label Position-Outside End. NB! Varasemates versioonides vali siin ja edaspidi + märgi asemel käsud Table Tools menüü Layout sakilt. Muuda vajadusel hiirega tekstikastide asetust nii, et nendes olevaid
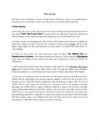
500 2,5 1,25 15581,25 525 3,125 0,9375 15617,19 550 3,75 0,625 15653,13 575 4,375 0,3125 15689,06 600 5 0 15725 625 5 0 15725 Sensitivity of Tarbimisplaan_1 to input Data for chart When you select an output from the dropdown list in cell $K$4, the chart will Tarbimisplaan_1 adapt to that output. 1 Stopped 0 0,625 1,25 1,875 2,5 3,125 3,75 4,375 5 5 Sensitivity of Tarbimisplaan_1 to input
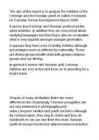
Graphical on-screen and tabular route plan editing Equalising of data between Master and Slave station(-s) Print out of Route Plan information Autopilot Navi-Sailor 3000 ECDIS provides a facility for sailing in the Autopilot mode. Route Monitoring Route monitoring is permanent mode running concurrently with other operation modes, it produces most important information for navigator while sailing. Chart corrections Chart updates are provided using Notices to Mariners documentation within the respective countries. Chart updates are delivered to customers on-line on practically the same day as the information is released on that country's HO web site. Chart Update information for Transas charts in TX-97 format is updated via the Internet every two weeks and is readily available for all users of the company's electronic chart systems.
h y a b r r=x/2 r x 8 cm y 10 cm a 5 cm r 4 cm h 3 cm b 3,9 cm S 97,6 cm2 P 43,4 cm r=x/2 Auto 1 1 Mootor Kere 1 2,4 Esiklaas Uks Töövihik 1 DIAGRAMMIL Chart DIAGRAMMIL Chart Diagrammia Chart Are 1 1 Jooniseala Pealkiri Draw Area Title 1..* Andmeseeria 1..* Punk Data seria Poin Auto 4 1 Kere Ratas Salong 2,4 1 Tagaklaa
.................................................................................... 3 2 Firmast ........................................................................................................................... 4 3 Täitmisele kuuluvad ülesanded ..................................................................................... 5 4 Tootmisliini asendiplaani väljatöötamine...................................................................... 6 5 Protsessi flow-chart ....................................................................................................... 8 6 Kvaliteedidokumentatsiooni ettevalmistamine ........................................................... 10 7 Operatsioonikaart ........................................................................................................ 11 8 Tootmisseadmete eelvaliku tegemine.......................................................................... 13
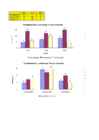
16 15 14 14 12 10 10 9 8 6 6 6 4 4 4 3 2 0 10 C 10 D 10 B A B C Chart Title 16 15 14 14 12 10 8 6 6 6 4 4 4 3 2 0 A B C 10 C 10 D 10 B 10 А 10 Б 10 В "отстающие" 5 7 8 "хорошисты" 14 12 15
16 15 14 14 12 10 10 9 8 6 6 6 4 4 4 3 2 0 10 C 10 D 10 B A B C Chart Title 16 15 14 14 12 10 8 6 6 6 4 4 4 3 2 0 A B C 10 C 10 D 10 B 10 А 10 Б 10 В "отстающие" 5 7 8 "хорошисты" 14 12 15
Redigeeri > Kleebi teisiti… (ingl. Edit > Paste Special…) avanevas dialoogiaknas valiku- nupul Kleebi link). Aga siinkohal sellel me ei peatu, vaid õpime looma diagrammi Word’is juba loodud tabeli põhjal. Word’i koosseisu kuuluva programmiga Microsoft Graph saab dokumendis oleva tabeli põhjal koostada diagrammi. Diagrammi lisamiseks tuleb andmetabel eelnevalt esile tõsta ja valida menüükäsk Lisa > Pilt > Diagramm (ingl. Insert > Picture > Chart) või Lisa > Objekt… (ingl. Insert > Object…) ja valida avanevas dialoogiaknas loendikastist „Microsoft Graphi diagramm“. NB! Et diagrammi aluseks olevate andmete muutmised tekstis kajastuksid diagrammil, tuleb enne diagrammi lisamist esiletõstetud tabel (või osa tabelist) kopeerida lõikelauale ning peale diagrammi lisamist luua link. Selleks klõpsuta ilmunud tööleheaknal (akna tiitlireal) ja vali menüükäsk Redigeeri > Kleebi teisiti… (ingl
1..* Esik Köök 0, 1 Pliit 0..* Külmik Kraanikaus 1 s Töövihik 1 DIAGRAM Ch DIAGRAM Ch Diagram Chart 1 Pealkiri 1 Title Jooniseala Draw Area 1..* Andmeseeria 1..* Punk Data seria Poin Korter 1 1..* 0..* Vannitub Köök Tuba a 0..* Elutuba 0..* Magamistuba 0..*
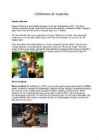
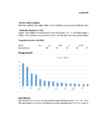
Celebrities of Australia Empire of the sun: Empire of the Sun is an Australian electronic music duo which formed in 2007. The duo is currently composed of Luke Steele of the Sleepy Jackson and Nick Littlemore of Pnau. The pair's name comes from the 1984 novel of the same name by J. G. Ballard. The duo achieved chart success with their first single "Walking on a Dream" which peaked at number ten on the Australian ARIA Singles Chart and reached number sixty four on the UK Singles Chart. Their debut album also titled Walking on a Dream, released in October 2008, to date has been certified platinum in Australia and has spawned the top 25 hit "We Are the People". Recently Empire of the Sun has gained mainstream media attention for gaining fourth position on the BBC's annual Sound of Music poll 2009. They are currently signed to EMI Australia and Virgin UK Hector Lombard:
8 41.2 Transport 152.1 132.2 Side 49.2 49 Vaba aeg 87 81.3 Haridus ja lasteasutused 19.3 17.2 Söömine väljaspool kodu, majutus 43.1 31.6 Mitmesugused kaubad ja teenuse 55.3 51.4 Arti Hunt IT-14E Kaalusüsteem 2014 muutus, %o Chart Title 25.1 215 6 78.8 -3.1 56.7 33.1 124 -11.2 69 3.4 46 19.9 121 -0.2 54.2 -5.7 91.8 Toit ja mittealkohoolsed joogid Alkohoolsed joo -2.1 27 Riietus ja jalatsid Eluase -11.5 39 Majapidamine Tervisehoid -3.9 77.5 Transport Side
From: Mari Maasikas Subject: Students’ reading interests Introduction The purpose of this report is to give an overview of Aru School students’ reading interests and recommendations for new books. The report is based on a survey that was carried out by Mari Maasikas at Aru Secondary School earlier this year. Girls Approximately one third of the female students are interested in romantic novels. Thrillers account for slightly below a quarter of the pie chart. Poetry makes up 17 percent of total and historical novels roughly 30%. Boys Slightly over than 50% of the male students prefer to read books from the thriller genre. The romantic novels account for one tenth of the chart. About 30% of the boys are interested in historical novels. Poetry makes up 9 percent of the results. Recommendations Seeing how Aru Secondary School students read books from only four different genres, I would like to give a few recommendations as to what kind of books to buy
Neljas tase Released in July 2006. Viies tase Again album placed at number one in UK, most of the Europe and Australia. Even in the United States they had success, reaching number 9 on the Billboard 200s chart. This album placed at 34# in a vote for "The Best British Albums of all time" . First hit singles (Supermassive Black Hole, Starlight and Knights of Cydonia) are from this album. Supermassive Black Hole is also known from Twlight movie. Discography
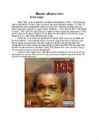
Illmatic album review Ervin Sagor Nasir ''NaS'' Jones recorded his first album called Illmatic in 1994. The album was slept on and had lack of sales. Upon its release, the album debuted at number 12 on the U.S. Billboard 200 chart, selling 59,000 copies in its first week. However, its initial sales fell below expectations and its five singles called "Halftime", "It Ain't Hard to Tell", "The World Is Yours", "Life's a B***h" and "One Love" failed to achieve significant chart success. There are ten songs on the album. Producers of the album are such legends as DJ Premier, Large Professor, L.E.S., MC Serch, Pete Rock and Q-Tip. I think this is one of the best rap albums of all time. NaS's lyrics are incredible and
tolerances- fair attitude towards any kind of people stakeholders- a person or business that invested monet into smth weep- showing emotions with crying idle- lack of motion or energy shout foul- to shed tears because of grief or pain fine-tuning- to make small adjustments in for optimal performance scope- getting information required to start a project slack time- the amount of time that a group is ahead of schedule on a project Gantt chart- chart that illustrates a project schedule over-assign mindless- no ability to think critical path of a project- complete projects on a time by focusing on key tasks cloud the schedule ingredients- different parts needed to finish the job take a roll call- checking if people are present a bottleneck- when things come to a point and slows down because two masses cannot share the same space at the same time. poised for- not moving but ready to move
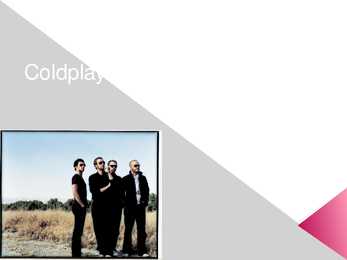
Formation Chris and Jonny met at the University College London in 1996. The first name of the group was Starfish. The name "Coldplay" came from a local student. Discography In 1998, band released 500 copies of the "Safety EP". In 1999, band released debut single "Brothers and Sisters EP". In the spring of 1999, band released "The Blue Room EP". In the summer of 2001, band released "Norwegian Live EP". "Parachutes" Released in July 2000 It debuted at number one on the UK Albums Chart. It was nominated for the Mercury Music Prize in September 2000. It reached doubleplatinum status. It was critically wellreceived. "A Rush of Blood to the Head" It was released in August 2002. They went for a tour and recorded a live CD and DVD. They were named as a best artist and the best band of the year. It won the Grammy Award for Best Alternative Music Album. "X&Y" It was released in June 2005. It became the bestselling album of 2005, with worldwide sales of 8.3 million.
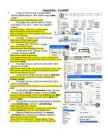
· Full Screen - näidatakse/ei näidata dokumenti terve ekraani suurusena · Zoom - ekraanipildi suuruse muutmine · View Manager - dokumendile vaadete lisamine, kustutamine; dokumendi vaatamine eri vaadetes (vaade - ekraanipilt, s.t. kuidas dokumenti ekraanil näidatakse) Insert menüüs on järgmised käsud: · Cells - lahtrite, ridade ja veergude lisamine · Rows - rea lisamine · Columns - veeru lisamine · Worksheet - uue töölehe lisamine · Chart - diagrammi tegemine · Macro - makrode tegemine (makro on käskude järjend, makro käivitamisel täidetakse ükshaaval makrosse kitjutatud käsud) · Page Break - saab mingis kindlas kohas lehekülje vahetust teha · Function - funktsioonide lisamine · Name - mingile tabeli piirkonnale nime andmine · Note - mingi tabeli piirkonna kohta märkuse kirjutamine · Picture - saab dokumenti pilte lisada
h_1 9,0 cm h_2 3,0 cm h 12,0 cm d 2,0 cm S cm P cm d b h_1 h h_2 b Arvuti 1...4 1, 2 Protsessor Sisemälu Välismälu Kuvar Diagrammileht 0...* Chart Kõvaketas RAM ROM 0, 1 CD ROM Diagrammiala Chart Area 0, 1 DVD 1 0...2 Jooniseala Pealkiri
kursor andmetabelisse, andmetabelisse, vali vali Insert Insert menüüst menüüst 0.16666667 11.3 käsud Insert Stock, Surface or Radar Chart-Radar. käsud Insert Stock, Surface or Radar Chart-Radar. 0.25 11.4 Diagrammi Diagrammi skaala skaala muutmiseks muutmiseks klõpsa klõpsa skaalal
2014 Official name of Hong Kong Hong Kong Special Administrative Region of the People's Republic of China Capital of Hong Kong The capital of Hong Kong is Victoria city Hong Kong neighbours Largest neighbours are: China, Taiwan and Vietnam Population Population of Hong Kong are 7,234,800 people Money Currency Facts Name: Hong Kong Dollar Symbol: HK$ Minor Unit: 1/100 = Cent Top HKD Conversion: USD/HKD Top HKD Chart: USD/HKD Chart Major languages Hong Kong people speaks Chinese and English National symbols Flag Emblem Flower Anthem: March of the Volunteers Government SAR government - Chief Executive : Leung Chun-ying - Chief Secretary for Administration :Carrie Lam - Financial Secretary : John Tsang - Secretary for Justice : Rimsky Yuen
tribal flavours. In 2005 he scored a hit with the single "Love Generation", that reached #1 on the Australian ARIA Singles Charts and the German Media Control Single Charts in 2006. The song was a huge success throughout Europe, also peaking at no. 2 in the Dutch Top 40 and it stood 39 weeks in the Ultratop 50 in Belgium. It became one of the official anthems for the World Cup 2006 held in Germany. The followup hit was "World, Hold On", that features Steve Edwards and also managed to chart in the top ten in most of the European countries. "Rock This Party (Everybody Dance Now)" followed on 22 August 2006. The remix of "World, Hold on" by ESmoove was nominated for a Grammy in 2007 in the category of Remixed Recording. Also, "World, Hold On" topped in Billboard Magazine as Number One Hot Dance Club Play Single of 2006, beating Madonna and Christina Aguilera. The fourth single of the album Western Dream,
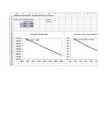
Hind -2,4 254,17 490,00 100 041,66 -2,3 264,13 492,50 105 459,23 -2,2 275,00 495,00 111 375,00 -2,1 286,90 497,50 117 860,11 -2 300,00 500,00 125 000,00 -1,9 314,47 502,50 132 898,02 -1,8 330,56 505,00 141 680,55 Sensitivity of Hind1 to input Data for chart When you select an output from the Hind1 #N/A dropdown list in cell $K$4, the chart will #N/A adapt to that output. #N/A #N/A #N/A #N/A #N/A #N/A Sensitivity of Hind1 to input 12 10 8 6 4
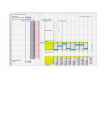
tundlikkus maksimaalselt lubatud ühele firmale liinide kohta Input (cell $B$4) values along side, output cell(s) along top Kogukulu 1 Not feasible 2 40300 3 39500 4 39500 5 39500 6 39500 7 39500 Sensitivity of Kogukulu to Input Data for chart Kogukulu When you select an output from the dropdown list in cell $K$4, the chart will Err:504 adapt to that output. Err:504 Err:504 Err:504 Err:504 Err:504 Err:504 Err:504 Sensitivity of Kogukulu to Input 12 10
kaksikud 35 25 70 vähk 15 40 45 lõvi 15 50 85 neitsi 40 85 65 kaalud 75 25 30 skorpion 40 70 15 ambur 25 70 15 kaljukits 45 50 60 veevalaja 65 70 60 kalad 85 70 20 istade kujunduse alt (Chart Tools - design). Postid värvi ja legend jääb ülesse. Y teljel olevad numbrid muuda teist ). Tulpdiagramm on mustal põhjal, aga diagrammi postid on Leia enne diagrammi koostamist toiduainete tüki hinnad ning koosta meelepärane sektordiagramm, kus nähtavad ja mustvalge printeriga diagrammi sektorid eristatavad. Diagrammi legend jääb vasakule. Toiduaine Kogus Hind Tüki hind suhkur 0,5 10,80 kr 10,30 kr
Esik 0..* 0..* Magamistub Pliit a 1 0..* Kraanikau Külmik Söögituba ss ... 7 Töövihi k DIAGRAMMILEH T Chart 1 Diagrammial 1..* a Chart Area 1 1 1 Jooniseala Pealkiri Legend Draw Area Title Legend 1..* 1..* Andmeseeria
Pliit 0..* 0..* Söögituba Külmik 1 0..* Kraanikauss Magamistuba 0..* Vannituba ... Elutuba Söögituba Magamistuba Variant 3 Töövihik DIAGRAMMILEHT Chart 1 Diagrammiala 1..* Kujund Chart Area Shape 1 1 1 Jooniseala Pealkiri Legend Draw Area Title Legend 1..* Andmeseeria 1.
30,00 118,000 102,000 86,000 60,000 60,000 62,000 35,00 118,000 102,000 86,000 60,000 60,000 62,000 40,00 118,000 102,000 86,000 60,000 60,000 62,000 Sensitivity of Actual_exposures_1 to input Data for chart Actual_exposures_1 When you select an output from the dropdown list in cell $K$4, the chart will adapt to that output. 118 118 118 118 118 118 Sensitivity of Actual_exposures_1 to input 118 140 120 100 80 60 40 20 0
19% Ema palk; 6% 5x Laste palk; 2% 2x Pensionärid; 2% Toetused; 1% üür; 19% Kulud (aasta kohta/€) Toit 5,000 Kommunaal 1,500 Transport 2,000 Tervishoid 0 Riided 100 Toit Komm Maksud 1,500 Maksud Meel Meelelahutus 100 Sidekulud 1,500 Kokku 11,700 Pere kasum 26900 Chart Title Toit Kommunaal Transport Tervishoid Riided Maksud Meelelahutus Sidekulud Kokku
Tuh. EEK Liha Piim 300 200 Piim 100 Jahu 0 2000 2001 2002 Aasta 32% Diagramm (Chart) peegeldab graafiliselt tabeli andmeid. Saab teha eri tüüpi diagramme (tulp, joon, ring jne.). Samade andmete pealt saab teha suvalise hulga erinevaid diagramme. Diagramm võib paikneda otse töölehel (nn. hõlmatud diagramm - embedded chart) või asuda eraldi nn. diagrammil Chart2,..). Diagrammide loomine: Insert, Charts Page 1 Diagrammid. Üldine Sektordiagramm - Pie
raamatu ilmumist ja sai siis ka tudengitele kätte jagatud. Kiviste raamatut võite kasutada kui lisa siinsele õpetusele, saamaks enam statistika ja ka tõenäosusteooria alaseid algteadmisi. Põhilised andmeanalüüsi teostamise vahendid MS Exceli keskkonnas on funktsioonid ja protseduurid, aga ka Chart Wizard'i abil lisatavad joonised ja Pivot Table'iga konstrueeritavad tabelid. Järgnevad kirjeldused baseeruvad versioonil MS Excel 97, kuid selle erinevus nii eelnevast kui ka uuemast (Excel 2000) versioonist on statistilise andmetöötluse osas minimaalne (nn
BACK TO GRAMMAR WORKSHEETS WORKSHEET Antworten zum Arbeitsblatt: Adjektivendungen 1 Be sure to refer to your fourquestion flow chart or memorize it and follow its rules! A. Frage 1: Artikel? These nouns have no articles before them, so the answer to question 1 is `no'. 1. Deutsches Brot (n) schmeckt immer gut. 8. Mein Vater darf fettes Fleisch (n) nicht essen. 2. Wir können hier frischen Käse (m) kaufen. 9. Ich möchte armen Leuten (pl) helfen (=dative verb!). 3. Kleine Kinder (pl) sind immer freundlich
r ... Diagramm 2 7 3. Töövihik 1..* DIAGRAMMILE Kujund HT Shape Chart 1 Diagrammiala 1 Chart Area 1 1 2,3 Jooniseala Pealkiri Legend Telg Draw 1..* Area Title 1..* Legend Axis Andmeseeria Punkt Data Serie Point
.* Kõvaketa RA RO s M M 0, 1 CD ROM 0, 1 DVD 0..2 Diskett Töövihik DIAGRAMMILEHT Chart 1 Diagrammiala 1..* Kujund Chart Area Shape 1 1 1 Jooniseala Pealkiri Legend Telg Draw Area Title Legend Axis 1..* Andmeteseeria 1..* Punkt Data seria Point 2, 3 Telg Axis
2 2 -b vh v- 8 d -d + 2 Auto 1 1 1 Mootor Kere Ratas Salong 1 2,4 1 Esiklaas Uks Tagaklaas Salong ... 2..* Iste 1 Armatuur ... Töövihik DIAGRAMMILEHT Chart 1 1..* Diagrammiala Kujund Chart area Shape 1 1 1 Jooniseala Pealkiri Legend Draw area Title Legend 1..* 1..* Andmeseeria Punkt Data Seria Point Kujund
võrdleb tulpadena esitatud väärtusi kategooriate lõikes - Vertikaalne - Horisontaalne Joondiagramm · Joondiagramms on omavahel ühendatud punktid · Hea muutuste esitamiseks Sektordiagramm · Sektordiagrammis kujutatakse arvväärtusi ringi sektoritema · Üldjuhul protsentidena Diagrammi koostamine · Koosta tabel ning märgista see osa, mille põhjal tahad diagrammi luua · Nüüd klõpsa standardnupureal järgnevale ikoonile (Chart) Diagrammi koostamine · Vali omale meelepärane diagrammitüüp · Siit saad oma poolt tehtava diagrammi näidist vaadata Diagrammi koostamine · Edasi liikudes ilmub järgnev aken · Siia tuleb kirjutada diagrammi pealkiri ning x- ja y-telje nimetused Diagrammi koostamine · Veel annab mängida telgede, ruudujoonte, legendi, andmesiltide ja andmetabeliga · Diagramm samale või uuele lehele Diagrammi koostamine · Tahtmise korral
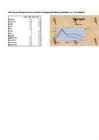
5 6 0 Jaanuar Veebruar Märts Aprill Mai Juuni Juuli August September Oktoober November Detsember Temperatuurid Sademed Hiina, Shanghai kliimadiagramm Chart Title 180 170 160 149 140 130 130 120 100 100 90 80 80 70
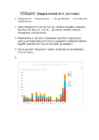
tervikus (midagi on 100 %). Iga sektor näitab vastava kategooria osa tervikust. 3. Teadustöös ei ole sobiv kasutada ruumilisi diagramme, sest ruumilised diagrammid on visuaalselt petlikud (sektori tegelik osakaal tervikus ei ole hästi arusaadav). 4. Tulpdiagramm diagramm sobib objektide omavaheliseks võrdlemiseks 5. 6. Lintdiagramm ehk ribadiagramm 7. See annab ülevaate nende jaotumisest esinemissageduse. 8. Chart Title 20 18 16 14 12 10 8 6 4 2 0 5 6 7 8 TÜDRUKUTE ARV POISTE ARV 8.2 ÕPILASTE ARV Iga päev Ei kasuta iga päev Ei kasuta üldse 8.3 10 9 8 7 6 5 4 3 2 1 0 1-2 tundi päevas 3-5 tundi päevas 5-8 tundi päevas Rohkem kui 8 tundi
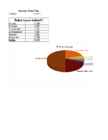
16. Nimetage tööleht nimetus "Sheet1" ümber nimeks "Tootmine". Ekraani all äärel valime lehe tähise Sheet1 ja paremanupu menüüst Rename nimetame selle ümber Tootmiseks. 17. Looge esimesele töölehele ridade B3:D3 ja B6:D6 põhjal sektordiagramm (Pie). Valime rea B3:D3 ja edasi hoiame all Ctrl klahvi valime täiendavalt B6:D6. Edasi valime menüüst Insert/Chart/Pie ning järgnevast aknast mingi sektordiagrammi. 18. Diagrammi pealkirjaks pange Tootmine. Valides hiirega diagrammi ilmub menüüreale uus menüü (Add-ins järel) ChartsTools millest valides Chart Title saame kirjutada diagrammi pealkirjaks Tootmine 19. Lisage iga sektori juurde väärtused. ja protsendid Valides hiirega diagrammi ilmub menüüreale uus menüü (Add-ins järel) ChartsTools millest valides DataLabels/MoreDataLabelsOptions... saame
98 St= 0.042312 v0= 4.64E-05 3) S0 1/S0 v0 1/v0 0.070 14.25 4.64E-05 2.15E+04 0.82 1.21951219512195 7.38E-05 1.36E+04 vmax= 7.8106693743654E-05 Km= 0.048672186206358 4) v0= 4.6119318748483E-05 v0=Vmax/2= 3.9053346871827E-05 Chart Tit S0= 0.056 9E-05 Km= 0.099593845192533 8E-05 7E-05 1.1602267E-05 0.017375 6E-05 2.0203438E-05 0.03475 𝑣_0 " = "5E-05 𝑣_𝑚𝑎𝑥/ 2 3.2102973E-05 0
Useful vocabulary To introduce: The aim/purpose of this report is(to describe/advise/recommend)… The reason for this report is… This report was written/carried out… This report describes… This report looks at… The aim of this report is to outline the results of a survey which was carried out… It is based on… 500 people were surveyed. This report was administered by… What is it based on - opinion poll, survey etc. bar chart, pie chart etc. To generalize: overall, generally speaking, on the whole, as a rule, as a general rule To describe results of surveys: one in tree… eight out of ten… eighty per cent… 80% are Or expressions: the majority, a minority, a largest proportion, a significant/substantial number of, a small number of, by far the largest proportion, 25% of the people questioned/surveyed… 68% of those who filled in the questionnaire…
These are drama groups,health clubs,folk groups,religious groups and car driving. In general it seems taht Russian and Estonian children are very active and keen on to providing for a bright future. Despite of many similarities there are some differences too.Surprisingly Estonian youngsters are not very interested in photography,pets' clubs,computer studies and youth societies.Although for compensation, they sing in choirs and they do handicraft.As we can see from the chart, Russian youth do not get involved in aforementioned activities. In conclusion it seems that Russian and Estonian children have mostly the same hobbies but they have also different preferences in their leisure activities.
.......... . 3.Mida näitab aeg? ................................................................................................................... . 4.Misssuguseid trajektoore on olemas? ..................................................................................................................... ................................................................................................................... . 5. Chart Title 40 35 30 25 Teepikkus, m s/m 20 15 10 5 0
parent and began selling territorial franchise licenses to private owners across the US. In 1967, after eight years of private operation, the Pillsbury Company acquired Burger King and its parent company Burger King Corporation. At the time of the purchase, BK had grown to 274 restaurants in the United States. Even though Pillsbury owned and operated the company, BK was still the object of a series of failed and successful acquisitions and divestitures. In 1973, Chart House, owner of 350 BK restaurants at the time and one of BK's largest franchise groups, attempted to purchase the chain from Pillsbury for $100 million (USD). When Chart House's bid failed, its owners, Billy and Jimmy Trotter, suggested that Pillsbury and Chart House spin off their respective Burger King holdings and merge the two entities into a separate company, an offer Pillsbury also declined. After the failed attempts to
·Diagrammi kujundamine - kustutada legend ja joonise pealkiri; y-telje põhikoordinaatjooned helehallid katkendlikud; y-teljele nimetus 'Tudengite arv'; x- teljele nimetus 'Mida te tavaliselt hommikul sööte?' ja tõstke see joonise sisse; telgede ühikute kirjasuurus 10 ja nimetustel 12 punkti; y-telje maksimum 29 ja miinimum 0 ühikut ning ühikute vahe (major unit) 5; tulpade vahe 120%; jooniseala (Chart Area) ümbert hall kastijoon kustutada; hall kastijoon teha ümber jooniseala (Plot Area) ·Suhteline sagedus grupi vaatluste arv/kõigi vaatluste arv. Home sakil saab teha protsendiks ·Pidevate arvtunnuste jaoks on vaja klasse. Klasside arvu leiab võttes vaatluste arvust ruutjuure, klassid peavad olema ühepikkused. Klasside intervalli leidmiseks (max-min)/vaatluste arv. Tuleb teha abitabel, kus on klasside ülempiirid, kuid viimase
Seda on hea liht Andmete kogumise viis: Valisin leheküljeks ühe telegrammi lehe. Kasutasin ctrl + f, et teada saada mitu korda on Allikas: http://www.telegram.ee/toit-ja-tervis/mikrolaineahi-havitab-kasulikud-toitained-ja Sagedus-jaotustabelid Sõna: on ja mis ei toidu kordade arv: 56 47 31 28 17 Diagrammid Chart Title 60 50 40 30 20 10 0 Järeldused Järeldusteks võib öelda, et populaarsemateks sõnadeks olid: "on", "ja", "mis", "ei", "toid Ma sain teada, et tervelt ühe lehekülje peale kasutati sõna "on" 56 korda, ning kuna leh tatistiline lühiuurimus: kui palju kasutatakse mingeid teatud sõnu nad. Seda on hea lihtne teha. a saada mitu korda on mingit kindlat sõna kasutatud. Otsisin välja 20 populaarsemat sõna -kasulikud-toitained-jattes-alles-tuhjad-kalorid
kursor andmetabelisse, vali Insert Insert menüüst menüüst 4:00 11.3 käsud käsud Insert Stock, Surface or Radar Insert Stock, Surface or Radar Chart-Radar. Chart-Radar. 6:00 11.4 Diagrammi Diagrammi skaala skaala muutmiseks muutmiseks klõpsaklõpsa skaalal skaalal hiire
According to the latest Census, the aim of this report is to figure out how much time people spend on household chores. The following points give us a good overview how men and women do it in Estonia. This report was commissioned by the Estonian Department of Statistics. It can be seen from the chart that both men and women spend about eight hours on household chores in Estonia. Men spend most of their time on building and making repairs. Less than an hour of their time is spent on gardening and pet care. Moreover men also like cooking and laundry in spite of losing their manhood. As expected, women occupy most of their time on child care. However it is surprising that they spend nearly one fifth on building. The reason for this may be due to men having
.. Windows Vista software XBOX 360 Corporation structure ·The company is run by a Board of Directors consisting of ten people, made up of mostly company outsiders. ·There are five committees within the board which oversee more specific matters ·There are several other aspects to the corporate structure of Microsoft. For worldwide matters there is the Executive Team, made up of sixteen company officers across the globe. Stocks Microsoft income chart,through the years The Microsoft innovation solution · Employees need support for their ideas whischoffers both a common language and easy ways for people to coordinate their efforts. Technology is a powerful tool for creating that pathway. · The Microsoft (IPM) Management solution offers just such a technology backbone to help the chemical industry facilitate and manage the innovation process. Microsoft's approach focuses on three key aspects of the process.
§ Popular songs: "Love is dead", "Walking on air" § Demi Lovato Skyscraper was co-written by Kerli. § Metsatöll is a folk-metal band combining runo-song and traditional folk instruments with metal. § Tanel Padar is best known internationally for winning the Eurovision Song Contest 2001. § http://www.youtube.com/watch?v=4iW5zTxHGE8 § Maarja-Liis Ilus, sometimes better known by her performing name Maarja is a popmusician. § Maarja has achieved some chart success in a number of countries across Europe and Asia. She has also represented her native Estonia in the Eurovision Song Contest twice. Click to edit Master text styles Second level Third level Fourth level Fifth level Bedwetters are an Estonian pop punk band formed in September 2004. On November 1 a miracle happened - when Nelly Furtado and Snoop Dogg handed