Intragenomic Profiling Using Multicopy
Genes : The
rDNA Internal Transcribed Spacer Sequences of the Freshwater
Sponge Ephydatia fluviatilis
Liisi
Karlep , To˜nu Reintamm,
Merike Kelve*
Department of Gene
Technology , Tallinn
University of Technology, Tallinn, Estonia
Abstract
Multicopy genes, like ribosomal RNA genes (rDNA), are widely used to
describe and distinguish individuals. Despite
concerted
evolution that homogenizes a large number of rDNA gene copies, the presence of
different gene variants
within a genome has been reported. Characterization of an organism by defining every
single variant of tens to thousands of rDNA
repeat units present in a eukaryotic genome would be
quite unreasonable.
Here we
provide an
alternative approach for the
characterization of a set of internal transcribed spacer sequences
found within every rDNA repeat unit by implementing
direct sequencing methodology. The
prominent allelic variants and their relative amounts characterizing an
individual can
be
described by a single sequencing electropherogram of the mixed amplicon containing the variants present within the
genome. We propose a
method for
rational analysis of heterogeneity of multicopy genes by compiling a
profile based on
quantification of different sequence variants of the internal transcribed spacers of the freshwater sponge Ephydatia fluviatilis
as an example. In
addition to using conventional
substitution analysis, we have
developed a mathematical method, the
proportion model method, to
quantify the relative amounts of allelic variants of different
length using data from direct
sequencing of the heterogeneous amplicon. This method is based on determining the
expected signal intensity
values (corresponding to
peak heights from the sequencing electropherogram) by sequencing clones from the
same or
highly similar amplicon and comparing hypothesized combinations against the values obtained by direct sequencing of the
heterogeneous amplicon. This method
allowed to differentiate
between all specimens analysed.
Citation : Karlep L, Reintamm T, Kelve M (2013) Intragenomic Profiling Using Multicopy Genes: The rDNA Internal Transcribed Spacer Sequences of the Freshwater
Sponge Ephydatia fluviatilis. PLoS ONE 8(6): e66601. doi:10.1371/
journal .pone.0066601
Editor :
Mary Bryk,
Texas A&M University, United
States of America
Received January 24, 2013; Accepted May 7, 2013; Published
June 18, 2013
Copyright : ß 2013 Karlep et al. This is an
open -
access article distributed under the
terms of the
Creative Commons Attribution License, which permits
unrestricted use, distribution, and reproduction in any
medium , provided the
original author and source are credited.
Funding: This
work was supported by the Estonian Ministry of Education and Research (Grant No. 0140108) and the Estonian Science Foundation (Grant
No. 9185) (www.
etis .ee). The funders had no
role in
study design, data
collection and analysis,
decision to publish, or preparation of the manuscript.
Competing Interests: The
authors have declared that no competing interests
exist .
* E-mail:
[email protected]Introduction (based on the peak heights of different nucleotides in the same
position on the electropherogram) have been focused on analysing
Ribosomal RNA genes (rDNA) have been widely used in
alleles that
differ by nucleotide substitutions [5,6]. Whereas, if the
taxonomy, biogeographic and phylogenetic analyses. A eukaryotic
gene variants differ due to insertion or deletion
events , and
genome has tens to thousands of rDNA copies, containing genes
substitutions may be absent, a different
strategy is needed to
for 18S, 5.8S, and 28S rRNAs. Between
these genes, on either side
adequately analyse the heterogeneity of the gene pool. We hereby
of the 5.8S rRNA gene, the internal transcribed sequences (ITS),
describe a method that also allows for the quantification of the
ITS1 and ITS2, are
located [1]. In
order to preserve the
amounts of different alleles containing heterogeneities caused by
functionality of multicopy genes, concerted evolution is at play.
indel events. We use the ITS sequences of the freshwater sponge
However , homogenisation of all the gene variants is not always
Ephydatia fluviatilis as an example, and describe
intra -individual
complete [2].
Divergent copies may interfere in obtaining
heterogeneity in this
species for the
first time. Our method enables
adequate
results from phylogenetic [3] or phylogeographic
to distinguish between individuals by compiling a
specific profile
analysis [4].
Therefore it is
crucial to distinguish between
real for each individual analysed. Comparing these profiles can help us
informative allelic variants and the misleading single mutated
to assess which specimens are similar enough on a genetic level to
copies, to achieve reproducible findings. For this reason, a small
be used together for one analysis e.g. for separating an
enzyme of
number of cloned sequences may not suffice to describe the
whole interest or compiling a cDNA library.
complement of the genome and
there is no guarantee that these
few sequences are actually the most prominent and true
Materials and Methods
descriptors for the individual studied. To overcome this problem,
the allelic variants obtained should be quantified (either in the
Sample collection and gemmule culture
absolute or relative quantity they possess within the genome) in
Sponges containing gemmules were collected manually from
order to assess their
importance (representability).
shallow depths (up to 0.5 m) from 6
sites in Estonian
rivers and
Previously described methods that
employ PCR and direct
streams from 3 drainage basins (see [7]) – the
Peipsi -Pihkva Lake
sequencing for determining
allele frequencies in pooled DNA
and the Narva
River drainage basin: River Piusa (
specimen Pi) and
PLOS ONE | www.plosone.org
1
June 2013 |
Volume 8 |
Issue 6 | e66601
Intragenomic Profiling Using Multicopy Genes
River Ro˜uge (specimen R); the Gulf of Finland drainage basin:
denaturation at 95uC for 45 s, annealing at 55uC or 61uC for 45 s,
Stream Vanamo˜isa (specimens V1, V2, V3, V4, V5 and V6); the
and extension at 72uC for 1 min with a
final extension at 72uC for
Moonsund Sea and the Gulf of Riga drainage basin: River Lokuta
10 min.
(specimen L), River Pedetsi (specimens Pe1 and Pe2) and River
The
success of PCR amplifications was initially evaluated by
Ko˜pu (specimens K1 and K2). The study was approved by The
electrophoresis of the
products in 1% agarose gel. The amplifi-
Estonian Environmental
Board . No additional permits or approv-
cation products were purified using the JetQuick PCR Purification
als were required. The cosmopolitan sponge species Ephydatia
Kit (Genomed,
Germany ).
fluviatilis is a representative of the phylogenetically lowest
DNA fragments of ,1091 bp obtained by PCR amplification
multicellular
animals and there are no ethics regulations
concern -
were directly sequenced using ABI
PRISM 3130 Genetic Analyzer
ing this species. E. fluviatilis is widely distributed in Estonia and not
(Applied Biosystems) with the primers mentioned
above . All
under
protection . The sites of collection were not located in
sequencing PCR procedures were conducted using J of the
protected or privately
owned areas .
recommended amounts of reagents.
To identify the species by
light microscopy, spicule preparations
The PCR products from
five specimens were cloned into the
were made by treatment of aliquots of samples with
concentrated pTZ57R/T
vector using InsTAclone PCR
Cloning KitTM
nitric acid for 10 min at 95uC. After removing the
organic matter (
Fermentas ),
following the manufacturer’s instructions. Either
the spicules were extensively washed with water and
mounted on
vector specific primers or PCR product specific primers were
slides .
used to sequence the cloned fragments.
Gemmules were isolated from sponge specimens and
stored at
4uC in
mineral medium (M medium: 0.1 mM
NaHCO3 ,
Data analysis and the proportion model
0.05 mM Na2SiO3, 0.01 mM KCl, 0.1 mM
MgSO4 , 0.2 mM
The data obtained by sequencing were analysed using the
CaCl2 [8]). In
parallel ,samples of sponge
material were
frozen in
BioEdit
program (
http://www.mbio.ncsu.edu/bioedit/bioedit .
liquid nitrogen and stored at 220uC.
html). Only sequencing data that displayed electropherograms of
Before starting, the culture gemmules were treated with 1%
good quality were used.
hydrogen peroxide for 1
minute to minimize bacterial and fungal
The absence or presence of notable intraindividual heteroge-
contamination [8]. Sponges were hatched on Petri dishes in M
neity was assessed by visual examination of the electropherograms
medium. Fully
functional young sponges were removed from the
obtained by direct sequencing. The presence of heterogeneities
dishes using a scraper and dispersed in calcium and
magnesium was indicated by
double peaks in substitution
positions , and by a
free medium (CMF medium: 0.1 mM NaHCO3, 0.005 mM
series of mixed peaks in
case of indel events,
both positioned after a
Na2SiO3, 0.01 mM KCl). Gemmule shells were discarded by a
sequence of good quality. In the case of nucleotide substitutions,
short sedimentation and the spicules were eliminated by filtration
the peak heights corresponding to the
particular nucleotides in the
of the
suspension through nylon gauze (50 mm mesh) [9]. The cells
same position on the electropherogram were compared as
to be used for DNA extraction were isolated by centrifugation
previously described [12]. A
novel modelling strategy, the
(5006g, 4uC, 10 min), frozen in liquid nitrogen and stored at
proportion model method, was developed for relative quantifica-
220uC.
tion of the alleles differing due to indels. This method allows for
Gemmules from specimens K1, K2, L, Pe1, Pe2, Pi, V1 and V2
quantifying the sequences
having insertions or deletions within a
were tested for their fusibility to distinguish the specimens
pool of otherwise highly similar sequences.
belonging to the same strains [10]. Two gemmules from different
The method is based on comparing the signal intensity values
samples were placed for
hatching close enough on a Petri
dish and
obtained by direct sequencing of the amplicon to the correspond-
the possible fusion of
formed young sponges was monitored. The
ing intrinsic values. The intrinsic intensity values for each
results were photographed using a Zeiss Axiovert 200 M
nucleotide in the sequence are used to model the same sequence
microscope.
being placed in different
frames in various proportions.
Each nucleotide has its specific intensity
value in each position
DNA extraction
because the intensity measured for each nucleotide depends on the
The sponge genomic DNA was extracted using CTAB
nucleotides that precede it in the sequence. To assemble the
technique [11] according to the
protocol described earlier [7].
model, the information obtained by sequencing 48 clones was used
DNA extraction from gemmules was performed using the same
for
finding the intrinsic (expected) intensity values for each mainly
technique. In the experiments where only 1 or 5 gemmules were
represented nucleotide in every position of the
alignment . The
used they were crushed with pipette
tips in 50 ml M medium and
numerical values were acquired by exporting
trace values from
the volumes of liquids used were J of those described by
Lopp et
BioEdit and extracting only the reads that corresponded to the
al. [7].
points where the program had placed the nucleotides.
As each run has its specific signal intensity level, the
signals from
PCR amplification, cloning and sequencing
different runs were normalized, so that the
mean of the intensities
The ITS
region including ITS1, 5.8S gene and ITS2 was
in a sequence would be as close as possible to 1000 units. Then to
amplified using the primers 18Sfw: 59-TAC ACA CCG CCC
obtain the expected values, the mean value
among clones for a
GTC GCT ACT A and 28S59rev: 59-GAC GTG CCT TTC
particular nucleotide in each position was found. The normaliza-
CAG GTC AAC TT. The primers were
designed to
include the
tion was needed also because different primers were used for
invariant sequence before the heterogenic positions in the
sequencing the clones, so any particular nucleotide in the rDNA
amplicon. This allowed the
assessment of the quality of the
was positioned at a different
distance from the primer.
sequencing electropherogram data obtained.
The data obtained by direct sequencing were normalized in a
The PCR amplifications were performed either in 30 ml or
similar manner, but because the
maxima of the
minor peaks did
50 ml reaction volume containing about 1, 10 or 100 ng genomic
not always coincide with the points where the nucleotides were
DNA and 0.5 mM of each primer, using 26 PCR Master Mix
placed by the program, the
greatest intensity values registered for
(Fermentas). The temperature profile was as follows: initial
other nucleotides for each position in a 5 point window from these
denaturation at 95uC for 1 min, followed by 30 or 35 cycles of
data were also found. To take into
account all nucleotides
PLOS ONE | www.plosone.org
2
June 2013 | Volume 8 | Issue 6 | e66601
Intragenomic Profiling Using Multicopy Genes
registered at the position, these intensity values of a position were
by direct sequencing. This
makes our method advantageous for
summed up, and the sums were used for normalization.
characterizing a sponge individual based on direct sequencing the
The intrinsic values were used to model the expected signal
ITS region.
intensities for different frameshift (or phase
shift [13]) combina-
tions, depicting the mixture containing various amounts of
2. Repeatability and robustness of the method
sequences of different length due to indel events in the specific
2.1. Repeatability of the results obtained using the
region. Signal intensities from these simulations of hypothetical
proportion model.
The first experiments to test the repeat-
combinations were compared to the information obtained by
ability of the method were performed using a single DNA
direct sequencing and the
best fitting situation was
established ; this
extraction from young sponges
grown in
vitro from about a
defined the relative contents of particular length variants in the
thousand gemmules of the specimen V2 as an example. The
amplicon. The
part of the sequence that was used for
comparison relative amounts of the ITS1 sequence variants of different length
comprised of at
least 200 nt following an indel position.
and variants containing the substitution in Position 169, found in
Since we found different annotations in NCBI GenBank for the
these different PCR experiments are presented in Table 1. The
borders of E. fluviatilis ITS sequences, we
aimed to
avoid further results from the substitution analysis are rounded to integer
confusion about the lengths of ITS sequences described and
percentage values, because when analysing a substitution,
infor -
designated the borders as follows: the last 8 nucleotides of 18S are
mation only from one position in the sequence is used (the peak
GATCATTA and the first of 5.8S ACAACTTC; between those
heights from two peaks in the same position in case of a single
sequences the ITS1 is positioned. ITS2 is positioned between the
nucleotide substitution),
while in the length analysis using the
end of 5.8S (TCTGAGCG) and the
beginning of 28S
proportion model, hundreds of downstream positions following the
(CGCTGAAT).
site of an indel provide the data, and therefore a more accurate
assessment can be made.
Data Access
The results from three parallel PCR amplifications with 100 ng
The sequences of the clones have been submitted to the NCBI
of DNA from the same extraction, conducted in same
conditions ,
GenBank (
http://www.ncbi.nlm.nih.gov/ ) under accession num-
showed a variance of less
than 1% for the ITS1 length analysis
bers KC243990–KC244049.
(Table 1), which is far less than the permitted error
rate of 5%
(established from clone sequencing results), and a variance of 2%
Results
for the substitution analysis, which is also significantly
lower than
the permitted error rate of 10%.
1. Elaboration of the method
2.2. Robustness of the method.
To assess the robustness of
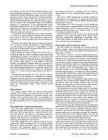
The amplicons obtained from all 13 Ephydatia fluviatilis
the method, first the
concentrations of either primer in the PCR
specimens analysed contained the ITS region, including the 39
mixture were
doubled (Table 1). This had no
influence on the
end of the 18S gene, the
full length ITS1, 5.8S gene, ITS2, and the
results: the absolute
deviation from the mean value of 100 ng
59 end of the 28S gene. Direct sequencing of those amplicons
experiments was from 0.35% to 0.38% for the length analysis.
displayed intra-individual heterogeneities in all specimens ana-
Secondly, the amounts of
template DNA were varied. The
lysed. The
examples of heterogeneities revealed by direct
reactions conducted with 10 or 1 ng of DNA were more variable
sequencing are displayed in
Figures 1 and 2 for ITS1 and ITS2,
than those with 100 ng, the absolute deviations from the mean
respectively. The direct sequencing electropherograms obtained
values of 100 ng experiments being 1.14% and 2.26%, respec-
for a single individual exhibited significant similarity, whereas the
tively (Table 1); showing that the
amount of template DNA can be
similarity decreased noticeably in the case of different individuals.
reduced to 1 ng with the
experiment still giving reliable results.
To elucidate the
visible heterogeneity, the amplicons from the
Further on we found that the method was
sensitive to limiting
specimens K1, Pe1, Pe2, R, and V2 were cloned and 12 clones per
the amount of starting sponge material, e. g. number of gemmules.
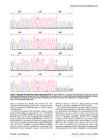
specimen were sequenced. The summary of the heterogeneities in
When extracting the DNA from just one gemmule or five
the ITS region displayed by the clones is depicted on
Figure 3
gemmules of the same specimen V2, the
yield of DNA was minute
(only heterogeneities that were visible in more than one clone from
(about 34 ng DNA for 1 gemmule, 240 ng to 500 ng for 5
a specimen are shown). Some of these sequences were specific to
gemmules, vs ,10 000 ng for young sponges grown from about a
one
animal ;
others were represented in
several animals. All
thousand gemmules; for PCR amplifications ,1 ng, 8 ng and
individual sequences obtained from clones are
posted in NCBI
17 ng vs 100 ng of DNA was used, respectively), and therefore the
GenBank (
http://www.ncbi.nlm.nih.gov/ ) under accession num-
accuracy of the results of corresponding PCR amplifications were
bers KC243990–KC244049.
comparable to those where 1 ng or 10 ng of DNA extracted from
The data obtained by sequencing individual clones suggested
young sponges had been used.
considerable repeatability of signal intensity values; the mean
In the experiments where DNA was extracted from young
standard deviation of the standardized signal intensities for each
sponges grown from about a thousand gemmules, only the ITS1
position was
around 5%. Every position in the sequence had a
sequence variants of 253 nt and 254 nt were detected above the
specific repeatable value for a particular nucleotide. It allowed us
5% threshold (established from acceptable noise level in sequenc-
to
compare the results of different sequencing experiments of
ing electropherograms). Whereas amplifying the DNA extracted
highly similar sequences numerically and to
construct the
either from 1 gemmule or 5 gemmules, sequence variants of
proportion model (described in Materials and Methods) and
252 nt and 255 nt length also
became detectable above the 5%
perform overall quantitative analysis of the
complex electrophe-
threshold (in experiments with 100 ng of DNA used in PCR they
rogram obtained by direct sequencing. In order to quantify the
were detected around 3% and 2%, respectively, since the noise
rate of substitution in a position more accurately, the expected
level in the particular electropherograms was very low; for an
signal intensity values were taken into account for the two
example see Figure 1, second electropherogram from the top).
nucleotides appearing in the position analysed.
Besides substitu-
Mostly these variants were represented in quantities of less than
tions, our proportion model permitted us to unravel the
10%. The accuracy of the results remaining close to the detection
contribution of indels to the complex electropherograms obtained
threshold may be
affected by possible distortions from
random PLOS ONE | www.plosone.org
3
June 2013 | Volume 8 | Issue 6 | e66601
Intragenomic Profiling Using Multicopy Genes
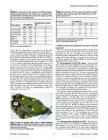
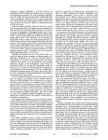
Figure 1. Examples of results from direct sequencing of ITS1.
Aligned fragments of sequence electropherograms (sequenced using the
forward primer) starting from Position 156 of ITS1. Samples (from top to
bottom ): V1, V2, L, and K2.
Black arrows indicate the substitution in Position
169; dashed arrows indicate the first position where a deletion has occurred in more than 5% of sequences in a sample (an indel).
doi:10.1371/journal.pone.0066601.g001
noise in sequencing data; therefore the results for the most
method is sensitive to using very small quantities of starting
represented variants are more reliable. Since a
greater accuracy
material, i.e. less than 5 gemmules, for DNA extraction.
cannot be guaranteed, the following results are rounded to integer
The results for more frequently represented sequence variants of
percentage values.
253 nt and 254 nt long ITS1 were also more variable in the case
In detail, the experiments with 5 gemmules, sequence variants
of a small
numbers of gemmules used as starting material, but the
of 252 nt ITS1 length were represented by 7% (17 ng DNA in
discrepancies were not as drastic as in the case of 252 nt and
PCR) and 5% (8 ng DNA in PCR); for 1 gemmule (1 ng DNA in
255 nt variants. The 253 nt sequence variants comprised 29% and
PCR) this value was 5%. For 5 gemmules, the contribution of
25% in 5 gemmules experiments and 20% for 1 gemmule
sequence variants of 255 nt ITS1 length
fell below 5% in one case
(compared to 25% which was
considered to be descriptive of that
(for the PCR with 17 ng DNA) and was therefore considered equal
specimen by the experiments where 100 ng of DNA was used for
to 0% but in a parallel experiment (for the 8 ng DNA PCR) the
PCR). For 254 nt sequences, the respective values were 63%,
value was 8%. For 1 gemmule (1 ng DNA in PCR) the amplified
62%, and 41% (compared to 75%, respectively). These results
sequence variant 255 nt ITS1 comprised 34% of all variants. This
suggest that amplification of DNA isolated from too small amounts
discrepancy
beyond permissible variance indicates that the
of starting material (fewer than 5 gemmules) cannot guarantee
PLOS ONE | www.plosone.org
4
June 2013 | Volume 8 | Issue 6 | e66601
Intragenomic Profiling Using Multicopy Genes
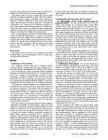
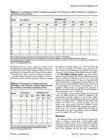
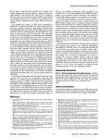
Figure 2. Examples of results from direct sequencing of ITS2. Aligned fragments of sequence electropherograms (sequenced using the
reverse primer). Samples (from top to bottom): Pe2, R, K2, and V2. Dashed arrows indicate the position of an indel.
doi:10.1371/journal.pone.0066601.g002
accurate results. To ensure the presence of sufficient amount of
analysing the substitution in ITS1 Position 169, the results were
template DNA for quantitative analysis all further experiments
very similar: 4 clones had A in that position and 8 clones had T. In
were conducted using 100 ng DNA in a PCR.
case of the length analysis the results were not that correlated: the
The proportions of heterogeneities in ITS1 found using the
majority of clones, 8 of
them , had an ITS1 length of 254 nt, 2
direct sequencing data were comparable to the amounts of
clones had 253 nt, but 2 clones had the shortest ITS1 variant,
sequence variants from 12 clones of the same specimen V2. When
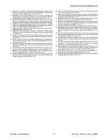
Figure 3. Schematic representation of heterogeneities found in ITS1 and ITS2 revealed by cloning from 5 specimens. Red and
blue rectangles mark the locations of indels and substitutions, respectively. The heterogenous positions (accompanied by a few surrounding nucleotides)
found in those locations are
given in the boxes below.
doi:10.1371/journal.pone.0066601.g003
PLOS ONE | www.plosone.org
5
June 2013 | Volume 8 | Issue 6 | e66601
Intragenomic Profiling Using Multicopy Genes
Table 1. Percentages of ITS1 sequences of different length
Table 2. Percentages of ITS1 sequences of different length
and nucleotides found in ITS1 Position 169 in different PCR
contained within samples taken from different sites of the
conditions(the same DNA extract from the sponge specimen
same specimen, V3.
V2 was used in all amplifications).
V3: Sample
ITS1 length (nt)
Nucleotide inITS1 Position
252
253
254
255
PCR conditions
ITS1 length (nt)
169
1
6
31
57
5
253
254
A
T
2
7
30
56
6
1) 100 ng of DNA
25.49
74.51
34
66
3*
*10
*31
*51
*8
2) 100 ng of DNA
24.76
75.24
35
65
4
8
32
54
6
3) 100 ng of DNA
24.84
75.16
36
64
5
8
31
55
6
Primers 2:1
25.41
74.59
34
66
Primers 1:2
24.68
75.32
37
63
*sequencing results were unsuitable for the analysis as the noise level on the
electropherogram
exceeded the permissible 10%.
10 ng of DNA
26.17
73.83
36
64
doi:10.1371/journal.pone.0066601.
t002 1 ng of DNA
27.29
72.71
38
62
3. rDNA heterogeneities displayed in Estonian E. fluviatilis
doi:10.1371/journal.pone.0066601.
t001 population
252 nt, that was represented by less than 5% in the direct
All 13 specimens of E. fluviatilis studied displayed intraindividual
sequencing results (when 100 ng of DNA was used for PCR).
heterogeneity in their ITS region (for direct sequencing
electro -
The results for the samples taken from various parts of an
adult pherograms see File S1). According to the results of direct
sponge (specimen V3; Figure 4) displayed a
uniform distribution of
sequencing neither substitutions nor indels were detected in the
the amounts of all heterogeneities found in ITS1 (see Table 2).
sequence of 5.8S gene, the
latter was identical to the sequences for
The
highest variability was noted for the most represented length
E. fluviatilis disclosed in NCBI GenBank (accession numbers:
variant (254 nt): the
maximum range between samples 1, 2, 4, and
AJ705048; EF151942; EF151951).
5 was 3%, which is still smaller than the permitted error rate of
3.1. Heterogeneities in the ITS1 region.
Sequencing the
5%. In the case of Sample 3 the electropherogram was not of good
clones of the ITS region amplified from 5 specimens (K1, Pe1,
quality as the noise level exceeded 10% of the
average signal
Pe2, R and V2) revealed 6 informative positions in ITS1 that were
intensity, and therefore the sequencing results were not
eligible for
confirmed by the results of direct sequencing, three of them being
the quantitative analysis (the direct sequencing electropherograms
substitution positions and others being the sites of indels: the length
are shown in File S1). However, including the data of Sample 3
of ITS1 varied from 252 nt to 255 nt. The direct sequencing of the
into the analysis would only
increase the maximum range for
amplicons from other specimens showed additional heterogeneities
254 nt length variant to 6%. There were no substitution positions
in ITS1. For example, in Position 173 two specimens (L and K2;
found in either ITS1 or ITS2 sequences for this specimen. Most of
see Figure 1, two lower electropherograms, respectively) displayed
the ITS2 sequences obtained for this specimen were of
such bad
a
distinct signal for A in addition to T. The same substitution also
quality, that they were unsuitable for precise analysis. However,
appeared in one of the clones from the specimen R, whereas direct
visual examination of the chromatograms confirmed that in all of
sequencing of the ITS1 region amplified from the same specimen
them the length variant of 323 nt was
dominant , and the other
showed the signal intensity caused by this substitution below the
ones , if present, were there in indistinguishable amounts or
10% threshold. Accordingly, this substitution was not considered
comparable to the noise level.
as one of those describing the particular animal.
The most heterogeneous substitution position in ITS1 was 169,
where all the previously published sequences had T. The majority
of specimens analysed in this study, except V3, had both kinds of
sequence variants, i.e. having either A or T in this position, in
different proportions; the specimen R displayed
exclusively A.
All heterogeneities in ITS1 appeared between positions 163 and
180. Five of them were substitutions: 163 G/T, 169 A/T, 173 A/
T, 174 A/T, 180 T/C; all given in relation to the
consensus of
different E. fluviatilis sequences found in NCBI GenBank, numbers
representing the positions in ITS1. The ITS1 length
variation was
caused by the
differences in a homopolymer T-
track length with
indels in positions 177 to 179. The substitution rates, as well as
relative amounts of ITS1 variants of different length, for all
specimens analysed are presented in Table 3. Taken together,
these data make up the ITS1 profiles for all 13 sponge individuals
studied.
3.2. Heterogeneities displayed in ITS2.
Heterogeneities
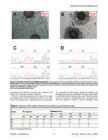
Figure 4. Sites of samples taken from a single individual
detected in ITS2 were more dispersed. Substitutions occurred in
(specimen V3). The
yellow labels indicate the sites of the sponge
ITS2 positions 151 (CRA), 244 (TRA) and 268 (CRG) (Table 4).
where the samples were taken. The excised sponge areas were always
smaller than the label area.
Our proportion model allowed us to detect single substitutions
doi:10.1371/journal.pone.0066601.g004
even in the case where they were located in the sequence following
PLOS ONE | www.plosone.org
6
June 2013 | Volume 8 | Issue 6 | e66601
Intragenomic Profiling Using Multicopy Genes
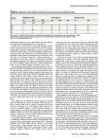
Table 3. ITS1 heterogeneities in different individuals: percentages of ITS1 sequences of different length and of nucleotides in
substitution positions analysed.
Sample
ITS1 length (nt)
Substitution in ITS1
163
169
173
174
180
252
253
254
255
G (T)
A (T)
A (T)
A (T)
T (C)
K1
0
23
77
0
0
52
0
0
0
K2
0
34
34
32
0
63
17
0
0
L
0
42
5
52
0
83
43
48
43
Pe1
0
6
35
59
0
74
0
49
41
Pe2
0
6
32
62
0
75
0
54
41
Pi
0
12
33
56
0
68
0
0
0
R
0
7
88
5
0
97
0
0
0
V1
0
82
10
8
0
79
0
0
0
V2
0
25
75
0
0
35
0
0
0
V3
7
31
56
6
0
0
0
0
0
V4
0
19
81
0
0
48
0
0
0
V5
0
18
82
0
0
61
0
0
0
V6
0
19
81
0
17*
63
0
0
0
The nucleotides in brackets are the ones most frequently represented in sequences found from NCBI GenBank.
The asterisk (*)
marks the substitution that was not found in any of the clones and therefore is calculated using direct sequencing results only.
For specimen V2 the results displayed here are the average from the experiments where 100 ng of DNA was used; for specimen V3 they are the average from
four successful experiments (see Table 2).
doi:10.1371/journal.pone.0066601.
t003 indel positions, where the sequence appeared as a mixture due to
from Position 10 (variants displayed were TTTT and TTT) and
the different allelic variants being visible in different frames in the
the other one in Position 246 of ITS2 (being either TT or T).
electropherogram. One of those substitutions
discovered with our
These variants occurred in different combinations. The amounts
model appeared in Position 244 and occurred in two specimens,
of sequence variants of different ITS2 length are given in Table 4.
V1 and K2; neither of the specimens was subjected to cloning.
3.3. ITS profiles of sponge strains.
Specimens collected
The indel events in ITS2 had occurred in Positions 13 and 247.
from one site of River Pedetsi, Pe1 and Pe2 belonged to the same
Both of them involved tracks of T nucleotides, the first one starting
strain (according to the
definition by Van de Vyver 1970): young
sponges grown from gemmules of those two specimens fused
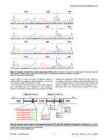
completely and formed a single functional animal (Figure 5A). All
Table 4. ITS2 heterogeneities in different individuals:
other specimens tested for fusibility formed a barrier between two
percentages of ITS2 sequences of different length and those
young individuals when grown pairwise from gemmules, i.e. they
of nucleotides in the analysed substitution positions.
belonged to different strains. An example of two specimens of
different strains found from one locality, the stream Vanamo˜isa, is
the one involving V1 and V2 (Figure 5B).
Sample
ITS2 length (nt)
Substitution in ITS2
The ITS profiles of the specimens belonging either to the same
strain or to different strains were compared, exemplified by the
321
322
323
151*
244*
268
aforementioned specimens. Figure 5 (C and D)
shows aligned
A (C)
A (T)
G (C)
fragments of sequence electropherograms from direct sequencing
K1
32
29
39
51
0
0
with the reverse primer 28S59rev (around the region of the indel at
K2
21
62
17
17
28
0
Position 247 of ITS2) of the respective specimens, below the
images of the young sponges grown from gemmules of those
Pe1
54
19
27
0
0
0
specimens. The full ITS profiles of the specimens are enclosed in
Pe2
48
36
13
0
0
0
Tables 5 and 6. These data
refer to highly similar ITS profiles for
Pi
0
70
29
0
0
0
the specimens of the same strain, while the specimens of different
R
10
73
17
0
0
32
strains had distinctly different ITS profiles.
V1
87
8
5
0
86
0
V2
20
25
55
0
0
0
Discussion
V3
5
7
88
0
0
0
The method developed in this study allows for the analysis of a
V5
0
8
92
0
0
0
mixture of amplicons derived from a pool of highly similar
V6
0
7
93
0
0
0
sequences (e.g. multicopy genes) by direct sequencing. In addition
to the conventional substitution analysis, our method considers the
The substitution results that are calculated from sequencing data of mixed
contribution of indels into the sequence pattern of a multicopy
sequences (the area following indels) are marked with an asterisk (*).
doi:10.1371/journal.pone.0066601.
t004 gene of an individual. For the first time, intraindividual
PLOS ONE | www.plosone.org
7
June 2013 | Volume 8 | Issue 6 | e66601
Intragenomic Profiling Using Multicopy Genes
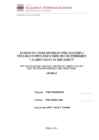
Figure 5. Examples of results from fusibility experiments. Young sponges grown from gemmules of the same strain, Pe1 and Pe2 (A) and of
different strains, V1 and V2 (B) and aligned fragments of sequence electropherograms (c and d, respectively) from direct sequencing with the reverse
primer 28S59rev (around the region of the indel at position 247 of ITS2). The black arrow (B) shows the barrier formed between two individuals that
signifies them belonging to different strains.
doi:10.1371/journal.pone.0066601.g005
heterogeneity of E. fluviatilis is described, and a distinctive ITS
As a prerequisite for this method, cloning the amplicons and
profile of each individual analysed is composed.
subsequent sequencing of a small number of clones is still required
The direct sequencing approach proved
suitable for
assessing to establish the intrinsic signal intensity values. Using the intrinsic
the informativeness of the heterogeneities found in the clones
values is a novel way to quantify indels but it also allows us to
because the data from direct sequencing proved to be repeatable.
assess the amounts of sequence variants containing certain
Table 5. Comparison of ITS1 profiles of specimens of the same strain and of different strains.
Sample
ITS1 length (nt)
Substitution in ITS1
169
173
174
180
163
252
253
254
255
A (T)
A (T)
A (T)
T (C)
G (T)
Pe1
0
6
35
59
74
0
49
41
0
Pe2
0
6
32
62
75
0
54
41
0
V1
0
82
10
8
79
0
0
0
0
V2
0
25
75
0
35
0
0
0
0
doi:10.1371/journal.pone.0066601.
t005 PLOS ONE | www.plosone.org
8
June 2013 | Volume 8 | Issue 6 | e66601
Intragenomic Profiling Using Multicopy Genes
Table 6. Comparison of ITS2 profiles of specimens of the same strain and of different strains.
Sample
Substitution in ITS2
ITS2 length (nt)
Deletion in ITS2
151
244
268
321
322
323
13
247
A (C)
A (T)
G (C)
Pe1
0
0
0
54
19
27
65**
62
Pe2
0
0
0
48
38
13
70**
64
V1
0
86*
0
87
8
5
95**
87
V2
0
0
0
20
25
55
32**
33
An asterisk (*) marks the substitution results calculated from sequencing data of mixed sequences (the region following an indel).
Two asterisks (**) mark the results calculated using other results of length analysis obtained using the proportion model.
doi:10.1371/journal.pone.0066601.
t006 substitutions with more accuracy than possible with using only the
compared to the other experiments of the same sample (the shift
data from the electropherogram of direct sequencing.
was around 34% for 254/255 nt). DNA extracted from five
In this work we used the direct sequencing approach together
gemmules of the same sample showed less, but still detectable
with the proportion model for both the ITS1 and ITS2
regions ,
inconsistency with young sponges grown from about a thousand
treating them separately.
Although the sequence variants of the
gemmules (see 2.2. Robustness of the method). Nevertheless, in
whole ITS region cannot be presented using this approach, the
practice there is much more
available material for characterization
results provide specific profiles for every individual analysed. Even
of an individual and the analysis of a single gemmule is neither
though the results of direct sequencing may not describe the actual
necessary nor
practical .
and
entire set of sequence variants (i.e. which combinations of
There have been only a few
studies describing intraindividual
heterogeneities exist), these results are reproducible; accordingly
heterogeneity in sponges. In the first publication [16], the ITS
the method is applicable. The sequences obtainable from clones of
region of the
marine sponge Crambe crambe was analysed. The
the mixed amplicon cannot depict the existing heterogeneities
authors reported that all intraindividual heterogeneities displayed
better, as the same PCR technique with all its errors is used.
by the clones sequenced were also visible on the electropherogram
The proportion model method is used with maximal accuracy if
of the amplicon sequenced directly after PCR. Wo¨rheide et al.
indels are positioned with sufficient intervals in the sequence under
[17] also performed direct sequencing of ITS regions of several
investigation. These distances can be
determined from the cloned
marine sponges and compared the results with sequences from
sequences. The
fact that the positions analysed in this study were
clones to compare the intraindividual heterogeneity appearing.
more than 200 nt apart meant that the proportion model was
Most of the results of that study were based on heterogeneities
suitable. Whenever the distance between indels is just a few
found by sequencing clones, including those
missing on the
nucleotides, the results may be less precise, because the variation of
electropherograms of direct sequencing. Generally, the analysis of
single intensity values will have more influence on the results if
electropherograms does not
seem to be a common practice and
data from only a few positions can be used. Also, the noise level is
often the ambiguities may be overlooked. A
recent example is the
higher in the sequence following additional indels since individual
study of the ITS2 sequences from the
elephant ear sponge Ianthella
signals are weaker because the signal is
spread out to more
basta [18]. It is difficult to decide whether the representative set of
positions. High noise level in sequencing data can
affect the results
sequence variants was revealed in that study, as the authors do not
by artificially increasing the content of heterogeneities that are
specify the limiting amount of the minor nucleotide present (the
present in relatively small amounts. Therefore it should be
kept in
peak heights on the electropherogram) in the direct sequencing
mind while comparing profiles of individuals that for
drawing any
results at a position considered to be a heterogeneous one.
conclusions, the amounts of the most represented heterogeneities
Data published on the heterogeneity of the ITS sequences of E.
are more reliable than those of the ones closer to the detection
fluviatilis have been scarce. Itskovic et al. [19] found that the ITS1
limit .
fragments from two E. fluviatilis individuals from
Japan were of a
The method has its limitations in the amount of starting
length of 254 nt. All specimens collected from Estonia contained
material. Reducing the amount of template DNA may
lead to
this length variant (it was the main variant in about
half of the
more variable results due to random events (like PCR
drift samples) among others; up to 4 different length variants in a single
described by Wagner et al. [14]). Different PCR results can be
sample (252 nt to 255 nt) were found, and there were no
cases caused by particular sequence variant(s) having advantages in
where only a single ITS1 length variant was present. Compared to
being replicated; even if this
advantage is small, it can amount to a
our sequences the two sequences from Japan displayed a few
significant
difference [14]. In the amplification of different ITS
additional indel sites and around ten substitution positions
setting sequence variants, the amount of which is sufficient for detection,
them apart from each other and from our sequences.
the PCR conditions play a crucial role [15].
For ITS2, the existence of different length variants in E. fluviatilis
The smallest amount of DNA, 1 ng, used in our experiments,
has been found in individuals separated by a long geographical
was sufficient to obtain
equivalent results to 100 ng from the same
distance: from
Italy [20], the length variant of 324 nt (323 nt by
extraction (from young sponges grown from about a thousand
our
annotation ) and from Japan [19], the length variants of 321
gemmules of the same sample). On the contrary, 1 ng of DNA
and 322 nt by our annotation (289 nt by their own annotation).
extracted from a single gemmule, may not
contain an ample
The specimens collected from Estonia had their ITS2 lengths from
amount of template DNA to give representative results. A single
321 to 323 nt. Both of the specimens from Japan contained the
gemmule displayed different ITS1 length variant contents
same deletions we had detected and 3 additional indel and 4
PLOS ONE | www.plosone.org
9
June 2013 | Volume 8 | Issue 6 | e66601
Intragenomic Profiling Using Multicopy Genes
substitution positions. Gigliarelli et al. [20] described one
quenced. A. queenslandica is
estimated to have
approximately 14.5
substitution in ITS2, Position 263 (showing both A and G); by
copies of rDNA sequences per haploid complement [25],
our annotation this position is 24th in the beginning of 28S RNA
(Reintamm, unpublished). The fact that we detected various
gene. The authors did not specify the number of clones with either
heterogeneities in very different amounts
across the specimens
of those substitutions. Otherwise the two sequences from Italy
implies that the rDNA
copy number for E. fluviatilis may be larger.
were identical to one of the most
popular variants we found in our
Making it even more complicated, individuals of the same species
clones. In the present study three informative substitution positions
can have very different numbers of rDNA copies because the
in ITS2 were found.
clusters
display both meiotic rearrangements and somatic mosa-
Freshwater sponges generally
exhibit more conservancy in their
icism. It has been shown that in
humans for example, the number
ITS1 region than in ITS2. The
middle parts of both regions are
of rDNA sequences even within a single cluster can
vary in an
most conserved: 90% of sponges studied by Itskovic et al. [19] (16
enormous extent, from one repeat unit up to .140
repeats [26].
accessions of Spongillidae, Echinospongilla brichardi and 2 Lubo-
In our study we
observed the discrepancy of the results between
mirskiidae, Baikalospongia bacillifera and Lubomirskia baicalensis)) had
experiments with one gemmule and/or five gemmules and from
120 nt conserved in the middle part of ITS2 and 145 nt in the
those with the young sponges grown from about a thousand
middle part of ITS1. This conservancy may
result from the
gemmules. It is possible that different sequence variants can
functionality of these regions. The heterogeneities found for E.
appear in different relative amounts, and minor variants that
could fluviatilis in our study were also positioned towards the ends of the
be ignored in the whole sponge sample, may seem to be
sequences. The variable portion of ITS1 spanned from Positions
dominating in a gemmule. It can also be proposed that single
169 to 180, the whole length of ITS1 being 252 nt to 255 nt. The
gemmules do harbour ITS variants in proportions different from
indels in ITS2 were located even closer to the ends – in Positions
the
parent sponge. Intra-individual heterogeneity in sponges may
13 and 247 of ITS2, while the substitution positions were more
be present either due to the heterogeneity within the genome or
dispersed
along the region – in Positions 151, 244, and 268 (the
the chimerism of the animal [27].
Working with
tiny amounts of
ITS2 length
ranged from 321 nt to 323 nt).
material (DNA extracted from one
larva or 1–2 mm2 of sponges
All length heterogeneities detected in the present study were
body area), Blanquer and Uriz [27] demonstrated genetic
caused by indels in tracks containing a different number of T
intraindividual heterogeneity of a sponge, as well as genetic
nucleotides. Wo¨rheide et al. [17] also described indels in
variation of its progeny. Unfortunately the repeatability of such
homopolymer T repeats for 3 marine sponge species. The authors
experiments cannot be assessed, since the sponge material for
considered these sequences to be questionable because of possible
DNA extraction is used up in a single experiment in such case.
polymerase slippage in the homopolymer region
during the
Although our study of different parts of the whole sponge body
sequencing reaction. In our study the homopolymer track was
of a single individual suggested that the animal was not
mosaic between 1 to 13 nt, that is far below the limit (25 nt) suggested by
concerning the ITS variants, the possibility exists that somatic
the manufacturer of the sequencing kit [21]. The examination of
mutations may have occurred, as described by Blanquer and Uriz
sequencing electropherograms of the clones showed that only a
[27]. The
change of the ratios of sequence variants can also be
few clones containing the
longest homopolymer tracks displayed
caused by the
frequent recombination of rDNA [28]. A large part
some noise after the repeat region.
of the cells in a gemmule might have been the decendants of a
The direct sequencing did not
reveal any heterogeneity in 5.8S
single cell where such DNA rearrangements had taken
place .
gene; its sequence was identical to the E. fluviatilis sequences
It is also possible that chimerism in sponges is not observed
disclosed in NCBI GenBank. A few inconsistencies were found in
while analysing a large amount of sponge material, because the
the clones sequenced; these can be attributed either to PCR or
cells are constantly
moving around within the body of a sponge
cloning artefacts or to pseudogenes, remaining under the detection
[29]. The cells containing different ITS
sets may spread out more
limit for direct sequencing. A similar amount of noninformative
or less evenly all around the body and give the same results, if a
heterogeneities were observed all over the sequence analysed. The
sample of a sufficient
size is taken from any part of the sponge
fact that the ITS sequence variants found were represented in
body. However, in a gemmule the cells are
fixed within its
limits ,
various proportions in different individuals – there was no single
and it is not
known whether the cells there have aggregated from
(or even a few) dominant variant(s)
throughout the species –
different parts of the body, or are the descendants of only some of
implies that a majority of these ITS sequence variants found do
the
local cells. In the latter case, a single mutation in one cell may
not belong to pseudogenes.
contribute (through a large population of its descendants) to
Every animal studied displayed an
array of different sequence
obtaining different results for a gemmule compared to the parent
variants. rDNA repeats in E. fluviatilis have been mapped to two
sponge.
chromosomes [22]. Our data indicate that the homogenization of
Taking it ever further, these results obtained with tiny amounts
copies within chromosomes is far from being complete. Similarly,
of the starting material can be considered as coming from different
in humans the existence of up to three different IGS (intergenic
individuals, since a functional sponge can
grow from a single
spacer)
classes in one rDNA block has been recorded [23]. rDNA
gemmule, and the cells exiting from gemmules originating from
has been shown to be positioned in clusters, which may contain
one individual (or individuals of the same strain) can also form a
copies in different orientation [24]; the clusters being positioned in
single animal when the gemmules germinate in close proximity.
different orientation may contribute to the incomplete homoge-
Even though, concerning sponges, the issue of individuality has
nisation.
been debated for quite some time, most scientists have agreed to
The number of different sequence variants in an individual’s
consider a morphologically separate sponge as an individual [30].
genome is very difficult to assess because the heterogeneities were
The different result for one gemmule might have arisen from
present in highly varied proportions throughout the samples, and
not having an ample amount of copies of the genome in PCR for
in various combinations in the clones sequenced.
Furthermore , the
quantitative analysis. Considering that one gemmule contains
copy number of rDNA sequences in the genome of E. fluviatilis is
around 500 binucleated cells [31], and the size of E. fluviatilis
not known. The closest assessment that can be made is for
another haploid genome has been estimated to be 0.376109 bp [22], a
sponge, Amphimedon queenslandica,
whose genome has been se-
single gemmule should contain around 0.77 ng genomic DNA.
PLOS ONE | www.plosone.org
10
June 2013 | Volume 8 | Issue 6 | e66601
Intragenomic Profiling Using Multicopy Genes
Recent studies suggest that the gemmule of E. fluviatilis may
However, the fusibility experiments
require gemmules to be
contain thousands of cells [32]. Still, the amount of DNA in a
available and are very time-consuming. Our method provides a
single gemmule would remain in the range of a few nanograms.
quicker way to determine which specimens have the potential to
However, in the present study the amount of DNA extracted from
be genetically similar enough to be used further as one sample.
one gemmule appeared to be around 34 ng referring to the
Even many structural genes are present in various copies in a
content of other components besides sponge DNA, absorbing at
genome of a sponge [25]. This variance is further increased by
260 nm.
different allelic variants. Since the amount of material available
Even though the amount of DNA from commensals is
from one individual tends to be small, as sponges grow slowly, it
minimized by analysing gemmules and young sponges grown in
would be necessary to combine material from different individuals
vitro from gemmules instead of adult sponges collected from
to
gain material for analysing an enzyme of interest. Using our
natural habitats, there may still be bacterial DNA present in the
method can help reduce the disorienting heterogeneity that arises
extraction. Besides containing sponge cells, gemmules have been
from combining random samples even from the same sampling
shown to house
bacteria and also eukaryotic cells, most likely
site since individuals similar enough on the genetic level (close
symbiotic ones [33]. In sponges,
vertical transmission of symbionts
relatives) harbour a limited amount of allelic variants of the
occurs; the presence of symbionts in larvae has been recorded for
structural genes. The heterogeneity revealed in this work further
several species [34,35,36,37]. Sequencing the genomes of A.
emphasizes the need to determine the homogeneity of samples
queenslandica larvae also yielded many bacterial sequences [25]. It
being used.
would not be surprising to
find the specific bacterial community of
The proportion model method was developed for the analysis of
E. fluviatilis [38] in gemmules, since this would
serve to conserve
ITS sequences and proved to be useful for distinguishing
the same community in their adults. Presumably, the presence of
individuals of E. fluviatilis; however the underlying principle can
DNA from other organisms did not affect the results of our
be used for low copy number genes, as well. If a sample yields a
analysis, as the primers were designed specifically for freshwater
sequence electropherogram displaying a double peak, the relative
sponges and the sequences obtained were explicit for E. fluviatilis.
content of sequence variants having one or another nucleotide in
We can further propose that besides individuals of E. fluviatilis
that position can be assessed by sequencing a few clones to
also the strains of E. fluviatilis can be distinguished by using our
ascertain the respective intrinsic intensity values for both
method. The strains are determined by immunological mecha-
nucleotides, and comparing those to the values from the initial
nisms underlying recognition of their own and
foreign cells. For
electropherogram. The accuracy of the results (around 610%)
different sponges to be
able to form a single unified body and their
would
allow anyone to decide if the sequence variants are present
cells to adhere, the aggregation factors (supramolecular proteo-
either in 1:3 or 2:2
ratio , for example. For indels the same
glycan -like
complexes ) and their interactions with cell surface
receptors must be specific enough [39,40], therefore the cells need
modelling approach can be used with higher precision.
to be similar enough on a genetic level as well. These recognition
mechanisms are not directly linked with rDNA, nevertheless
Supporting Information
studying the ITS profiles allows us to assess the genetic similarity of
File S1
Direct sequencing electropherograms.
Catalogue individuals.
names in the
archive refer to the specimens specified in Materials
In our study the ITS profiles of the individuals of the same strain
and Methods. PCR amplifications were performed with 100 ng of
(specimens Pe1 and Pe2) were recognizably similar; the only
DNA if not indicated otherwise in the trace name. Experimental
difference was in ITS2 length variants which appeared in different
details for specimens V2 and V3 are explained in text.
proportions (Figure 5, Tables 5 and 6). The two samples from
(ZIP)
Vanamo˜isa
location belonging to different strains (samples V1 and
V2) exhibited 10 distinguishing
features in their ITS profiles
(Tables 5 and 6). Also, all the other specimens,
proven to belong to
Author Contributions
different strains, had features setting them apart from all others.
Conceived and designed the experiments: LK TR MK. Performed the
To confirm that the specimens do belong to the same strain, it is
experiments: LK. Analyzed the data: LK TR MK. Contributed reagents/
still necessary to conduct the fusibility experiments (Figure 5).
materials/analysis
tools : LK TR MK. Wrote the
paper : LK TR MK.
References
1. Long EO, David ID (1980) Repeated genes in eukaryotes.
Annu Rev Biochem
9. Buscema M, De Sutter D, Van de Vyver G (1980) Ultrastructural study of
49: 727–764.
differentiation
processes during aggregation of purified sponge archaeocytes.
2. Ganley AR, Kobayashi T (2007) Highly efficient concerted evolution in the
Wilhelm Roux’s Archives 188: 45–53.
ribosomal DNA repeats:
total rDNA repeat variation revealed by whole-genome
10. Van de Vyver G (1970) La non
confluence intraspecifique
chez les spongiaires et
shotgun sequence data. Genome Res 17: 184–191.
la
notion d9individu. Ann Embryol Morph 3: 251–262.
3.
Alvarez I, Wendel JF (2003) Ribosomal ITS sequences and
plant phylogenetic
11.
Murray MG,
Thompson WF (1980) Rapid isolation of high molecular weight
inference . Mol Phylogenet
Evol 29: 417–434.
plant DNA. Nucleic Acids Res 8: 4321–4325.
4. Queiroz C de S, Batista FR, de Oliveira LO (2011) Evolution of the 5.8S
12. Higuchi M,
Maas S, Single FN, Hartner J, Rozov A, et al. (2000) Point mutation
nrDNA gene and internal transcribed spacers in Carapichea
ipecacuanha in an AMPA receptor gene rescues lethality in
mice deficient in the RNA-editing
(Rubiaceae) within a phylogeographic
context . Mol Phylogenet Evol 59: 293–
enzyme ADAR2.
Nature 406: 78–81.
302.
13. Dmitriev DA, Rakitov RA (2008) Decoding of superimposed traces produced by
5. Amos CI, Frazier ML, Wang W (2000) DNA pooling in mutation detection with
direct sequencing of heterozygous indels. PLoS Comput.Biol 4: e1000113.
reference to sequence analysis. Am J Hum
Genet 66: 1689–1692.
14. Wagner A, Blackstone N, Cartwright P,
Dick M, Misof B, et al. (1994) Surveys of
6. Wilkening S, Hemminki K, Thirumaran J, Bonn S, Forsti A, et al. (2005)
gene
families using polymerase
chain reaction: PCR
selection and PCR drift.
Determination of allele frequency in pooled DNA: Comparison of three PCR-
Syst Biol 43: 250–261.
based methods. Biotechniques 39: 853–857.
15.
Buckler -IV ES, Ippolito A, Holtsford TP (1997) The evolution of ribosomal
7. Lopp A, Reintamm T, Vallmann K, Pa¨ri M, Mikli V, et al. (2007) Molecular
DNA: divergent paralogues and phylogenetic implications. Genetics 145: 821–
identification, characterization and distribution of freshwater sponges (Porifera:
832.
Spongillidae) in Estonia. Fundam
Appl Limnol 168: 93–103.
16. Duran S, Giribet G, Turon X (2004) Phylogeographical history of the sponge
8. Rasmont R (1961) Une technique de culture des e´ponges d9eau douce en milieu
Crambe crambe (Porifera, Poecilosclerida): range expansion and recent invasion of
controˆle´. Ann Soc Roy Zool Belg 91: 147–156.
the Macaronesian islands from the Mediterranean Sea. Mol
Ecol 13: 109–122.
PLOS ONE | www.plosone.org
11
June 2013 | Volume 8 | Issue 6 | e66601
Intragenomic Profiling Using Multicopy Genes
17. Wo¨rheide G, Nichols SA, Goldberg J (2004) Intragenomic variation of the
29.
Bond C (1992)
Continuous cell movements rearrange anatomical
structures in
rDNA internal transcribed spacers in sponges (Phylum Porifera): implications for
intact sponges. J Exp Zool 263: 284–302.
phylogenetic studies. Mol Phylogenet Evol 33: 816–830.
30. Ereskovskii AV (2003) Problems of coloniality, modularity, and individuality in
18. Andreakis N,
Luter HM, Webster NS (2012) Cryptic speciation and
sponges and
special features of their morphogeneses during
growth and asexual
phylogeographic relationships in the elephant ear sponge Ianthella basta (Porifera,
reproduction. Russ J Mar Biol 29: 46–56.
Ianthellidae) from
northern Australia . Zool J Linnean Soc 166: 225–235.
31. Ruthmann A (1965) The fine structure of RNA-storing archaeocytes from
19. Itskovich V, Gontcharov A, Masuda Y, Nohno T, Belikov S, et al. (2008)
gemmules of
fresh -water sponges. Q J Microsc Sci s3-106: 99–114.
Ribosomal ITS sequences allow resolution of freshwater sponge phylogeny with
32. Funayama N, Nakatsukasa M, Hayashi T,
Agata K (2005) Isolation of the
alignments guided by secondary structure
prediction . J Mol Evol 67: 608–620.
choanocyte in the fresh water sponge, Ephydatia fluviatilis and its lineage marker,
20. Gigliarelli L, Lucentini L, Palomba A, Sgaravizzi G, Lancioni H, et al. (2008)
Ef annexin.
Develop Growth Differ 47: 243–253.
Applications of PCR-RFLPs for differentiating two freshwater sponges: Ephydatia
33. Simpson TL (1984) The Cell Biology of Sponges. Springer, New
York , 662.
fluviatilis and Ephydatia mu¨
lleri . Hydrobiologia 605: 265–269.
34. Enticknap JJ, Kelly M, Peraud O,
Hill R (2006) Characterization of a culturable
21. Applied Biosystems (1998) Automated DNA Sequencing Chemistry
Guide ,
alphaproteobacterial symbiont common to many marine sponges and
evidence Perkin-
Elmer Corp.,
Foster City, CA.
for vertical transmission via sponge larvae. Appl Environ Microbiol 72: 3724–
22. Ishijima J, Iwabe N, Masuda Y, Watanabe Y, Matsuda Y (2008) Sponge
3732.
cytogenetics – mitotic chromosomes of ten species of freshwater sponge. Zoolog
35.
Schmitt S, Weisz JB, Lindquist N, Hentschel U (2007) Vertical transmission of a
Sci 25: 480–486.
phylogenetically complex microbial consortium in the viviparous sponge Ircinia
23. Gonzalez IL, Sylvester JE (2001) Human rDNA: evolutionary
patterns within
felix
the genes and
tandem arrays derived from multiple chromosomes. Genomics,
. Appl Environ Microbiol 73: 2067–2078.
73: 255–263.
36.
Sharp KH, Eam B,
Faulkner DJ, Haygood MG (2007) Vertical transmission of
24. Caburet S, Conti C, Schurra C, Lebofsky R, Edelstein SJ, et al. (2005) Human
diverse microbes in the
tropical sponge Corticium sp. Appl Environ Microbiol 73:
ribosomal RNA gene arrays display a
broad range of palindromic structures.
622–629.
Genome Res 15: 1079–85.
37. Lee OO,
Chui PY, Wong YH, Pawlik JR, Qian PY (2009) Evidence for vertical
25. Srivastava M, Simakov O, Chapman J, Fahey B, Gauthier ME, et al. (2010) The
transmission of bacterial symbionts from adult to embryo in the
caribbean Amphimedon queenslandica genome and the evolution of animal
complexity . Nature
sponge Svenzea zeai. Appl Environ Microbiol 75: 6147–6156.
466: 720–6.
38.
Costa R, Keller-Costa T, Gomes NC, da Rocha UN, van Overbeek L, et al.
26. Stults DM, Killen MW,
Pierce HH, Pierce AJ (2008) Genomic architecture and
(2012) Evidence for selective bacterial community structuring in the freshwater
inheritance of human ribosomal RNA gene clusters. Genome Res 18: 13–18.
sponge Ephydatia fluviatilis. Microb Ecol DOI 10.1007/s00248-012-0102-2.
27. Blanquer A, Uriz MJ (2011) ‘‘
Living together apart’’: the
hidden genetic
39. Curtis AS, Van de Vyver G (
1971 ) The
control of cell adhesion in a
diversity of sponge populations. Mol Biol Evol 28: 2435–2438.
morphogenetic system. J Embryol Exp Morphol 26: 295–312.
28. Cazaux B, Catalan J, Veyrunes F, Douzery EJ, Britton-Davidian J. (2011) Are
40.
Fernandez -Busquets X,
Burger MM (1999) Cell adhesion and histocompatibility
ribosomal DNA clusters rearrangement hotspots?: a case study in the
genus Mus
in sponges. Microsc Res
Tech 44: 204–218.
(
Rodentia , Muridae). BMC Evol Biol 11: 124.
PLOS ONE | www.plosone.org
12
June 2013 | Volume 8 | Issue 6 | e66601


Kõik kommentaarid