Vormistamine ülesanne 2 (0)
VORMISTAMISE ÜLESANNE 2
TUNNITÖÖ
Õppeaines: SISSEJUHATUS ERIALASSE
Tehnoloogia ja ringmajanduse instituut
Õpperühm:
Juhendaja:
Tallinn 2021
SISUKORD
2
ABSTRACT
Pilling is an undesired defect of textile fabrics, consisting of a surface characterized by a number of
roughly spherical masses made of entangled fibers. Mainly caused by the abrasion of fabric surface
occurring during washing and wearing of fabrics, this defect needs to be accurately controlled and
measured by companies working in the textile industry. Pilling measurement is traditionally
performed using manual procedures involving visual control of fabric surface by human experts.
Since the early nineties, great efforts in developing automatic and non-intrusive methods for pilling
measurement have been made all around the world with the final aim of overcoming traditional,
visual-based and subjective, procedures. Machine Vision proved to be among the best options to
perform such defect assessment since it provided increasingly performing measurement equipment
and tools, serving the purpose of automatic control. In particular, a relevant number of interesting
works have been proposed so far, sharing the idea of helping (or even replacing) traditional
measurement methods using image processing-based ones. The present work provides a rational
and chronological review of the most relevant methods for pilling measurement proposed so far.
This work serves the purposes of 1) understanding whether today automatic machine vision-based
pilling measurement techniques are ready for supplanting traditional pilling measurement and 2)
providing the textile technology researchers with a bird’s eye view about the main methods studied
to confront with this problem.
3
KEYWORDS
Review, Fabrics, Pilling assessment, Machine Vision, Image Processing, Artificial Neural
Networks.
4
INTRODUCTION
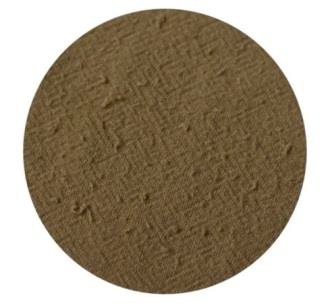
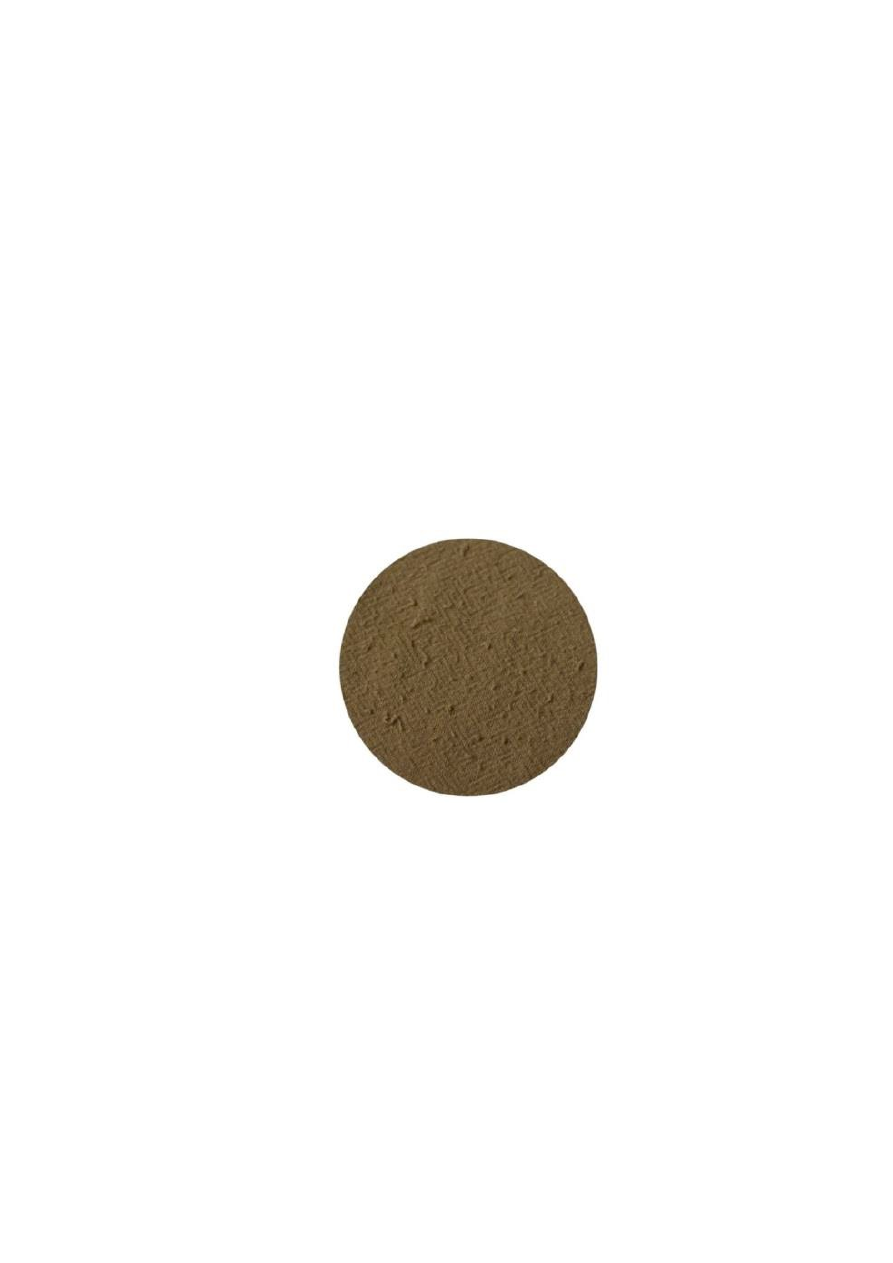
As widely recognized [1], the term “pilling” is referred to a surface defect occurring in textile
fabrics and consisting of entangled fibers forming the so called “pills”. Such pills are, usually,
caused by the combination of washing and wearing of fabrics; in detail, due to the abrasion of fabric
surface, a number of loose fibers tend to entangle into short fine hairs thus developing into spherical
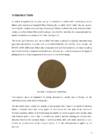
bundles anchored to the surface of the fabric (see Figure 1).
The fabric’s pills formation (i.e. the so called “resistance to pilling”) is typically measured using
procedures described in Standards such as the D4970/D4970M-10e1 (ASTM, 2010) and the UNI
EN ISO 12945– 2004; since fabrics take a long time to be pilled in normal use, resistance to pilling
needs to be tested by a simulated accelerated wear, followed by a visual assessment of the degree of
pilling based on a visual comparison of the sample to a set of test images.
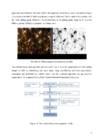
FIGURE 1. Example of pilled fabric
Two common pieces of equipment for pilling measurement, mainly used in Europe, are the
Martindale pilling tester and the Pilling Box.
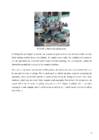
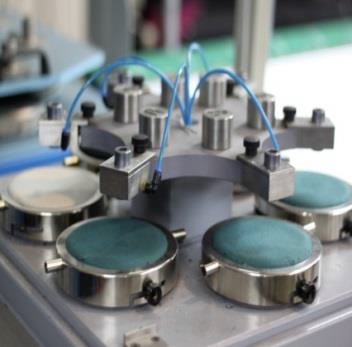
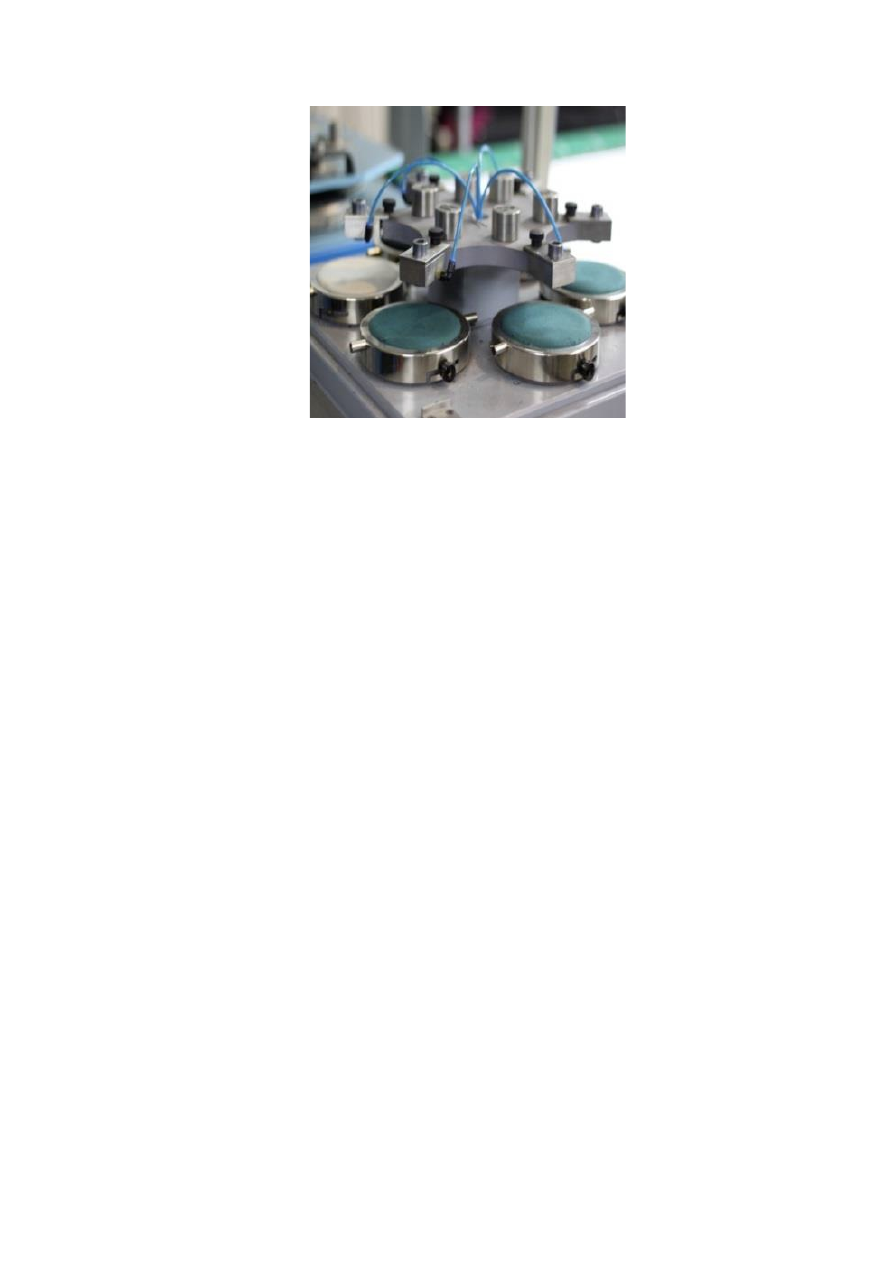
The Martindale tester consists of a number of testing plates (See Figure 2) on which the abrading
fabrics is attached; these four testing plates are mounted on the base plate of the instrument.
Generally speaking, fabrics to be tested using Martindale are cut in an approximate circular shape
with diameter equal to 90± 1 mm. A worsted wool cloth is used for abrading the samples and a
trajectory based on the Lissajous figure is used to perform each cycle (more precisely, a cycle
consists of 16 movements in the Lissajous figure). A 12 kPa head pressure is applied by the
machine.
5
FIGURE 2. Martindale pilling tester.
In Pilling Box (see Figure 3) samples are mounted on polyurethane tubes and are tumbled in cork-
lined rotating wooden boxes. Accordingly, the samples move under the condition of no pressure
and the specimens are conducted under mutual transient touching. As a consequence, unlike the
Martindale method, the rubbing for the samples is random.
Whichever is the device (Martindale or Pilling Box), the final result consists of abraded fabrics to
be assessed in terms of pilling. This is performed by skilled operators (experts) comparing the
specimens, after a predefined number of cycles performed by the testing equipment, with visual
standards (which may be actual fabrics samples or photographs). On the basis this comparison, the
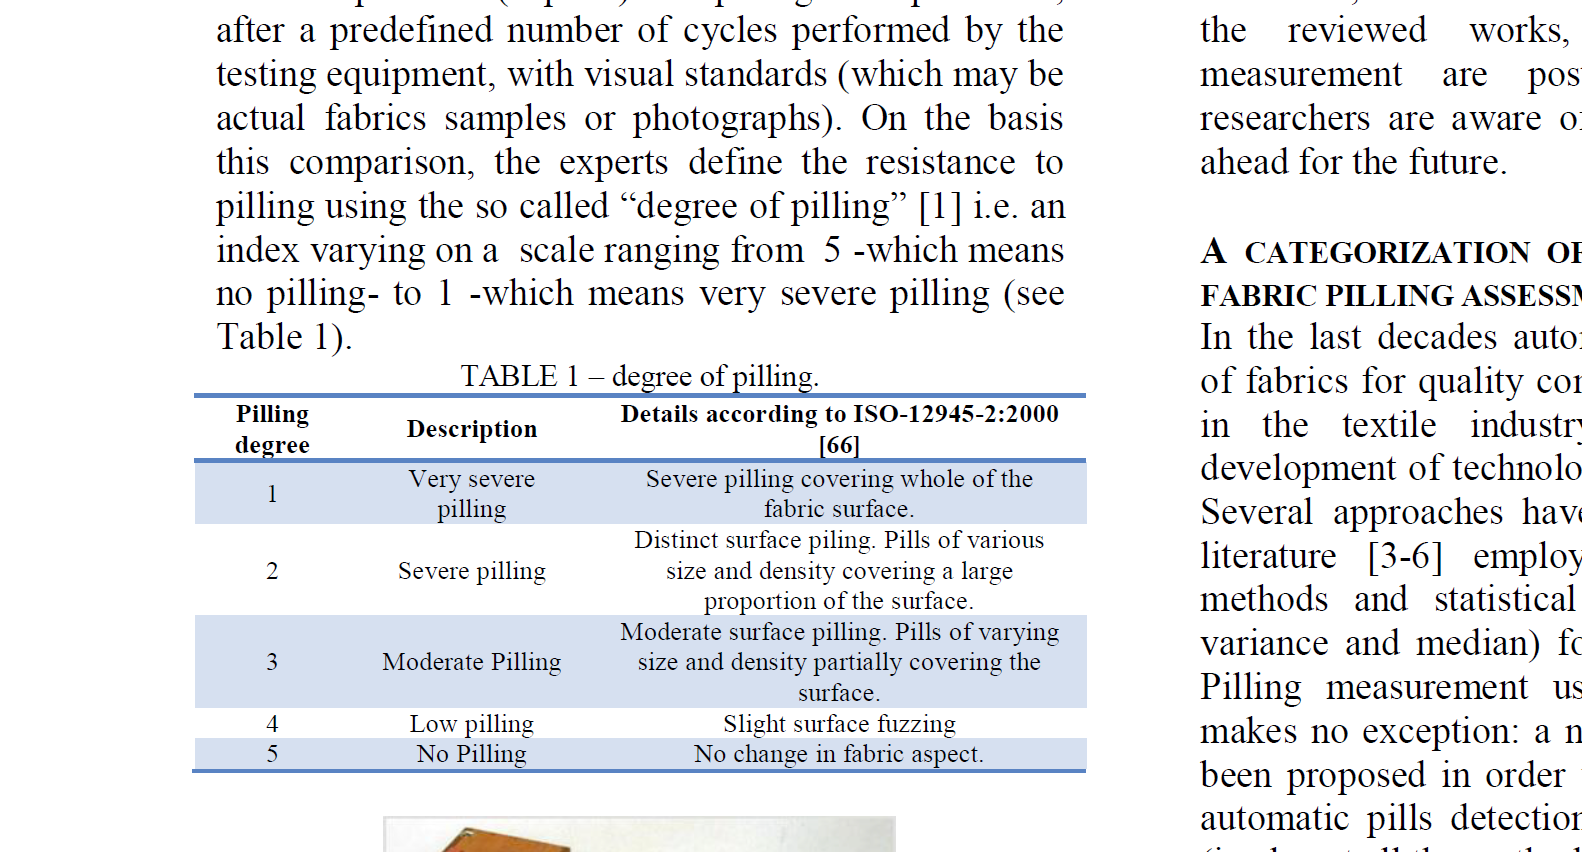
experts define the resistance to pilling using the so called “degree of pilling” [1] i.e. an index
varying on a scale ranging from 5 -which means no pilling- to 1 -which means very severe pilling
(see Table 1).
6
TABLE 1. degree of pilling.
This method proves to be suitable for predicting the actual behavior of fabrics everyday use only in
some specific conditions. For instance, according to the ASME Standard, laboratory test is
considered reliable as an indication of relative end-use performance in cases where the difference in
abrasion resistance of various materials is large, but they should not be relied upon in prediction of
actual wear-life in specific end uses, unless there are data showing the specific relationship between
laboratory abrasion tests and actual wear in the intended end-use.
According to [2], the main drawback of the subjective methods based on estimation by experts is
their inconsistency and the inaccuracy of the rating results. Henceforward, there is still today a need
for devising objective evaluation methods, relying in automatic and non-intrusive pilling
measurement. [ CITATION Fur15 \l 1061 ]
With the aim of speeding up the pilling measurement procedure and, at the same time, to increase
the reliability of the visual control, in the last years a number of Machine Vision (MV) systems
have been proposed in order to overcome the limitations of traditional, visually-based, pilling
measurement.
On the basis of the most relevant results obtained in this field, the present paper provides a rational
and chronological review of the most promising methods proposed so far. It is authors’ opinion that
such a review can help researchers in understanding the working principles of today’s best
automatic machine vision-based pilling measurement techniques. Moreover, on the basis of the best
practices offered by the reviewed works, future trends in pilling measurement are postulated, so that
interested researchers are aware of the future scenario that lies ahead for the future.
7
1. A CATEGORIZATION OF METHODS FOR AUTOMATIC
FABRIC PILLING ASSESSMENT USING MACHINE VISION
In the last decades automated visual inspection (AVI) of fabrics for quality control faced an
increasing trend in the textile industry due to the considerable development of technologies related
to vision systems. Several approaches have been proposed in scientific literature [3-6] employing
image processing-based methods and statistical parameters (such as mean, variance and median) for
defect detection on fabrics. Pilling measurement using machine vision systems makes no exception:
a number of methodologies have been proposed in order to explore automatic or semi-automatic
pills detection and classification. Basically (in almost all the methods) the starting point consists of
digital images of pilled fabrics. These images (representing either pilled fabric specimens to be
evaluated or standard reference) are, then, processed in several different ways in order to extract
some features describing fabric pilling. Finally, such parameters are used for grading the fabrics or
for characterizing their quality. While the starting point and the final results are ultimately shared by
all the techniques, what changes is the method adopted for extracting the information used for
pilling grading. On the basis of main literature works, in the present work the following categories
are identified:
1) 2D imaging methods based on thresholding.
2) 2D imaging methods based on Fourier and/or Wavelet analysis.
3) 3D imaging methods.
4) AI-based methods (using either 2D or 3D images).
Understandably, different categories could be used for describing existing works. Moreover some
more recent techniques use approaches comprised in more than one of the above categories.
Nevertheless, it is authors’ opinion that the given categorization, although open to improvement, is
effective for understanding and systematizing the knowledge about how the pilling assessment
problem has been faced by more than a few authors all over the world. As already mentioned,
possible approaches are presented in a chronological order so that the main improvements brought
by researchers are time-streamed.
8
2. 2D IMAGING METHODS BASED ON THRESHOLDING
The main idea of almost all the papers dealing with 2D imaging methods is to perform pills
detection using image segmentation [1] i.e. the process of partitioning the original image into
multiple segments including fabric background and pills. This process is usually, in its turn, aimed
at determining parameters such as the number and the density of pills and/or the area occupied by
the pills on the fabric surface. Once this task is performed, pilling grade is obtained as a parameter
inferred from the number of pills, or by comparing the pilled fabric with a reference fabric (either
with or without pills). As a matter of fact, almost all methods classified in this category use, at some
point, an image binarization by applying one or more thresholds and, possibly, morphological
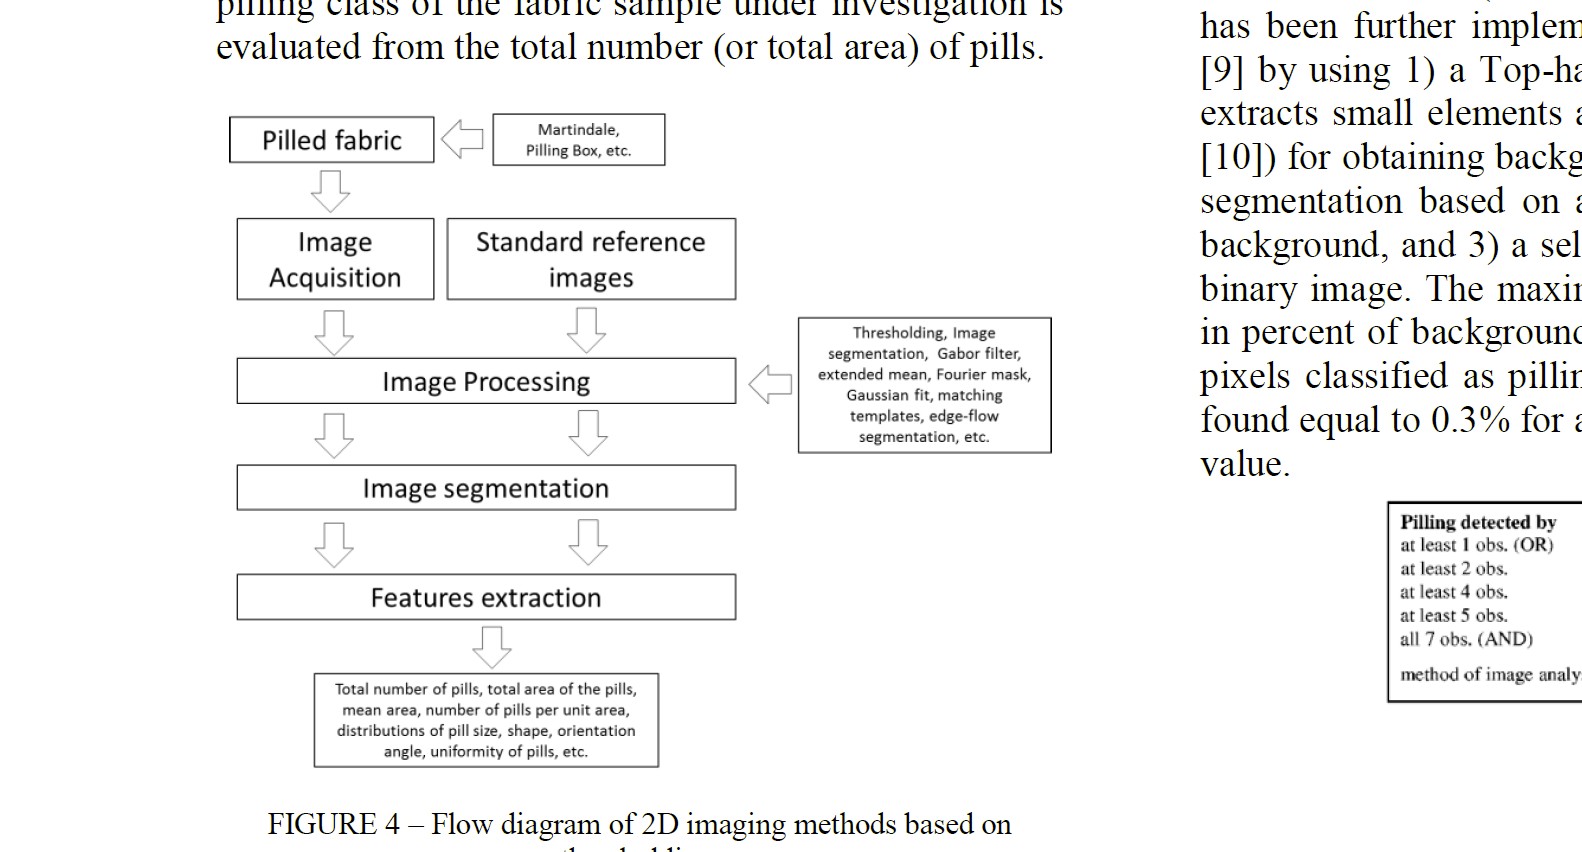
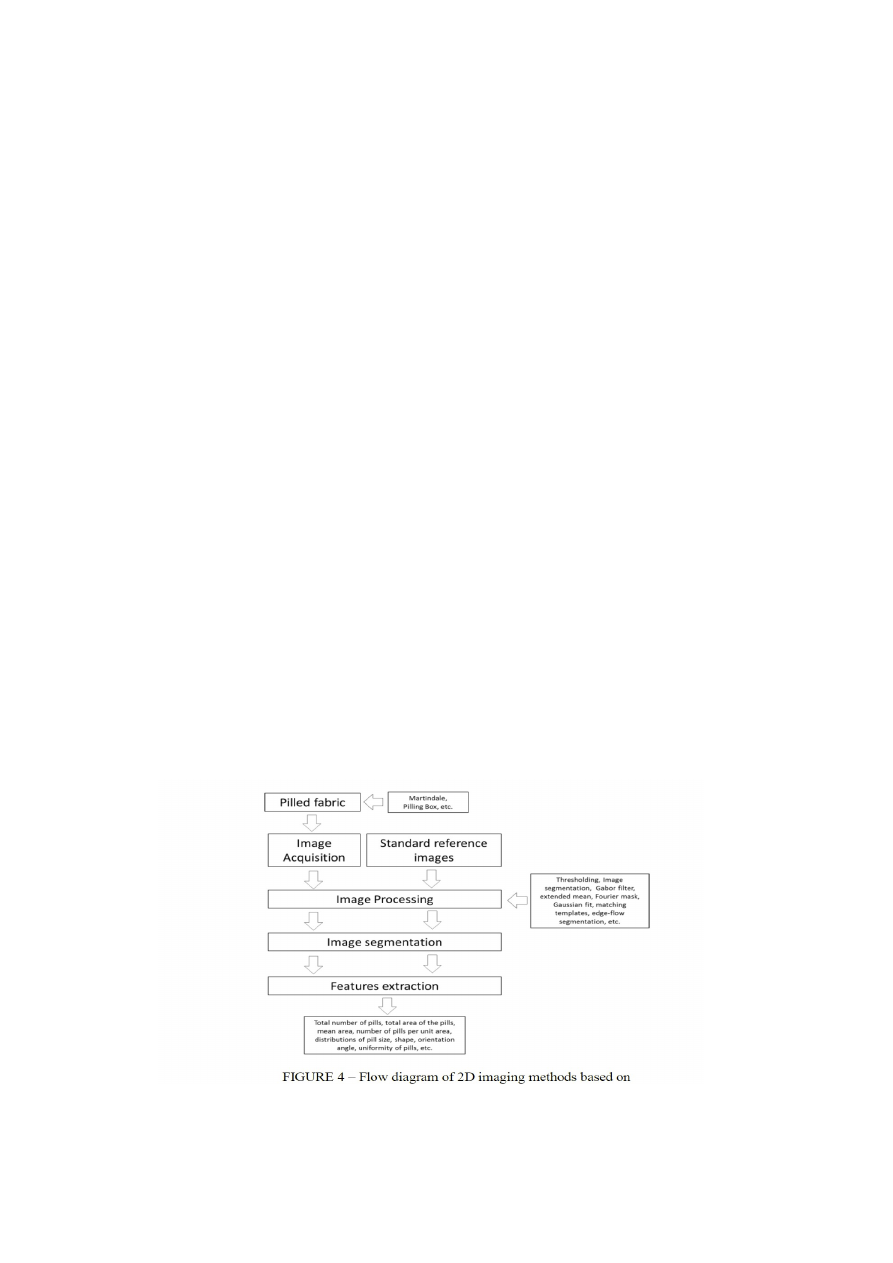
operations on images. In Figure 4 an exemplificative flow diagram characterizing this category of
methodologies is shown.
An early work dealing with image segmentation was carried out by Konda et al. in 1990 [7]; images
of fabric samples, pilled using Martindale equipment, were acquired using a commercial camera
under near-tangential illumination thus obtaining images with high pill-to-background contrast.
Obtained images are then binarized using two different thresholds with the final result of detaching
the background from the pills. In Konda’s work, the background is represented with black (pixel
value equal to 0) while pills are depicted as white blobs (pixel value equal to 1). Eventually, pilling
class of the fabric sample under investigation is evaluated from the total number (or total area) of
pills.
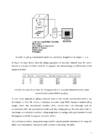
FIGURE 4. Flow diagram of 2D imaging methods based on thresholding.
9
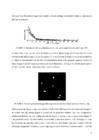
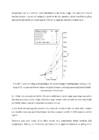
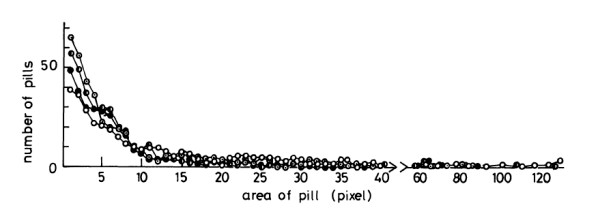
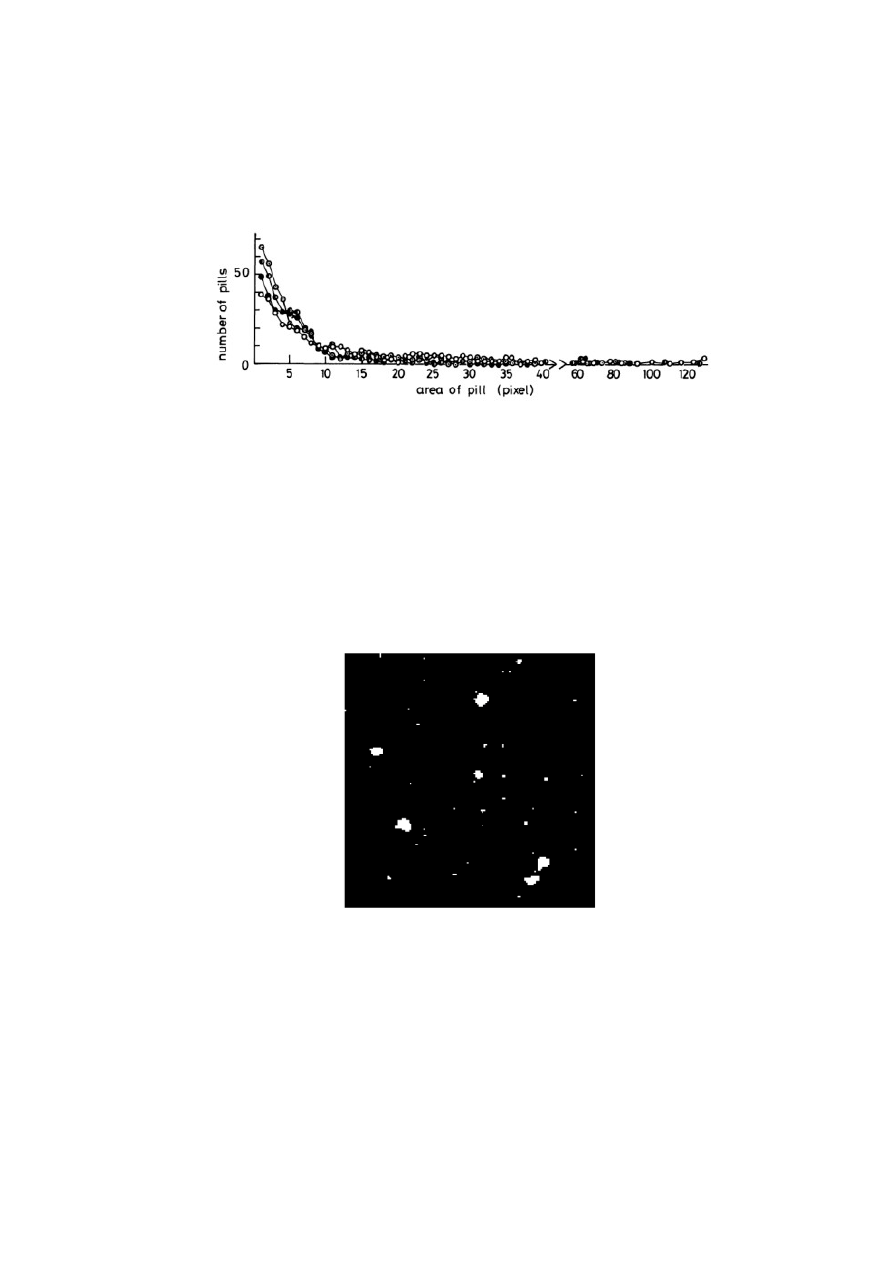
In Figure 5 an illustrative image from Konda’s work describing the number of pills as a function of
pill size is proposed.
FIGURE 5. Number of pills as a function of pill size: an example from Konda’s work [7].
In 1996, Abril et al. [8] used some techniques typical of digital image processing with the aim of
evaluating the pilling degree. From the analysis of a set of standard images a sequential method for
an objective measurement was devised. An intermediate result of the proposed approach consists of
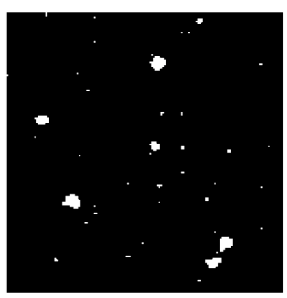
binary image obtained using segmentation by local binarization. In Figure 6 a 64x64 pixels portion
of such binarized image, taken from Abril’s work, is shown.
FIGURE 6. Part of a processed image after segmentation by local binarization (Abril et al.[8])
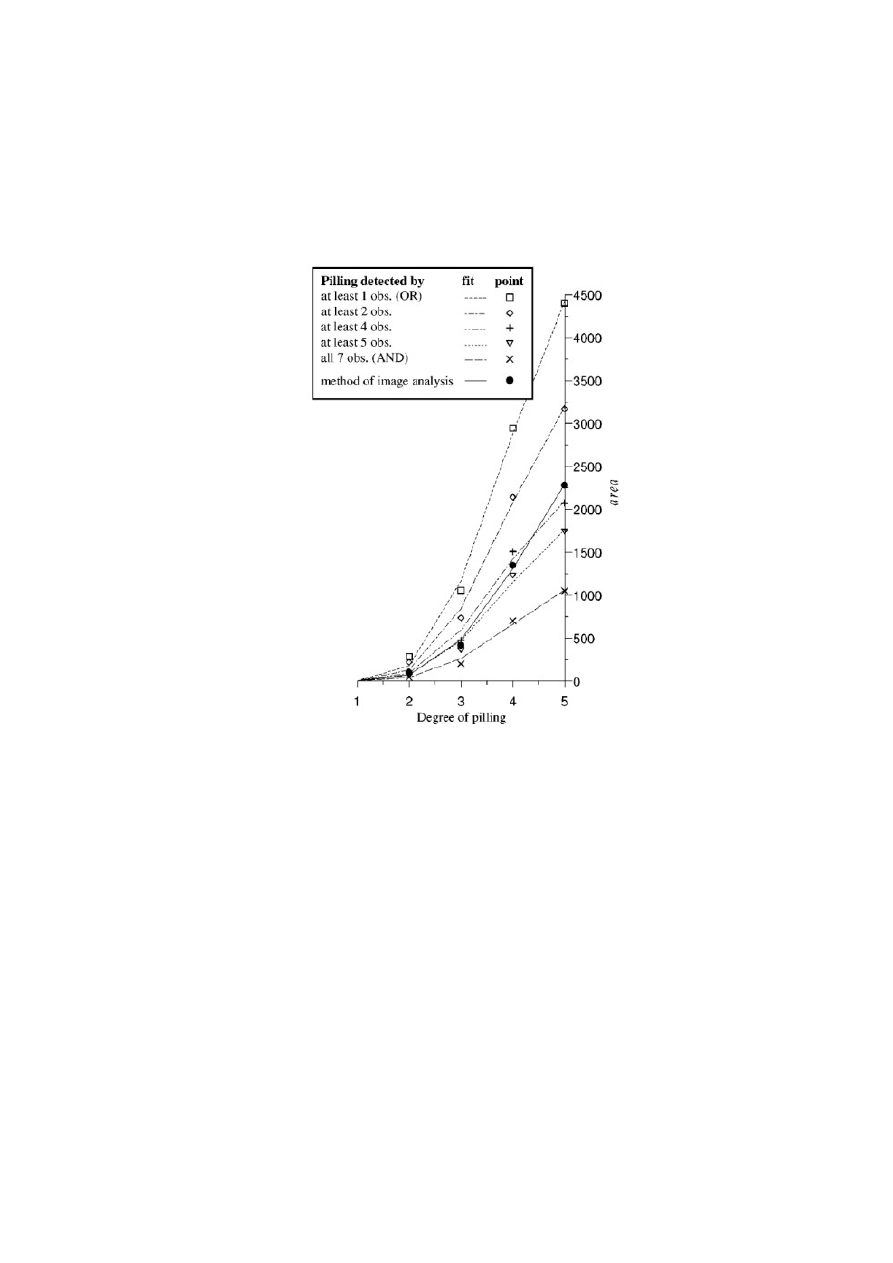
Starting from the binary image, an evaluation of the total pilled area (for each processed image) to
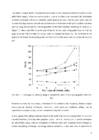
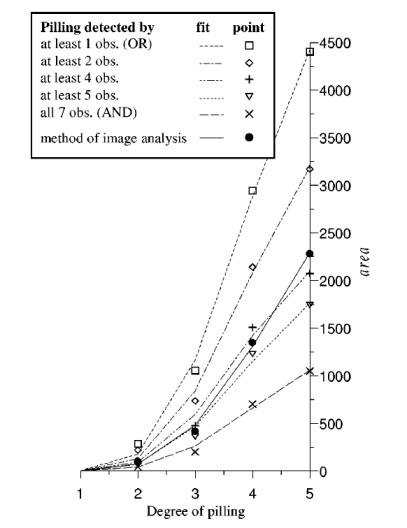
be related with the pilling degree is carried out. In particular, authors claim that a logarithmic
relationship between the total pilling area and the degree of pilling subsists observed (see Figure 7).
The proposed method has been further implemented by the same authors in [9] by using 1) a Top-
hat transform (an operation that extracts small elements and details from given images [10]) for
obtaining background uniformity, 2) an image segmentation based on a Gaussian model [11] of the
10
background, and 3) a selective noise elimination in the binary image. The maximum error of
misclassification in percent of background pixels in the total amount of pixels classified as pilling
(beyond the threshold) was found equal to 0.3% for an optimally selected threshold value.
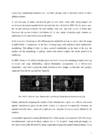
FIGURE 7. Areas of pilling corresponding to the standard images of pilling degree varying in the
range [1-5]: comparison between human visual performance and image-processing based method
proposed by Abril et al. [8]
In [12] the main concept described in [8] were recalled and a digital image processing was used to
determine pills size, number, shape, orientation angle, contrast, total area and the mean area of pills
on a fabric surface, especially using thresholding techniques.
A MV-based methodology that automatically counts the number of pills on textile fabric samples
and classifies them into pre-defined classes has been proposed in [13]. A CCD camera is used to
capture
Successive gray scale images of the fabric sample; then, segmentation, Radon transform [14],
morphological filtering, and de-trending operations [15] are applied to determine the pilling count.
11
Using fuzzy membership functions [16], the fabric pilling count is ultimately related to fabric
pilling resistance.
A tool developed to detect and describe pills on solid-shade fabrics (after being imaged with
conventional personal-computer-based hardware) has been devised in 1998 [17]. In such a work,
the devised software evaluated the total number, total area, and total volume of fabric pills.
Moreover, the system evaluated distributions of pill size, shape, orientation angle, contrast and
uniformity of pill spatial distribution on the fabric.
In the same year, Xiaohong and Mu [18] proposed a method for pilling evaluation where the image
of pilled fabric is preprocessed on the basis of image's gray-scale statistical and/or mathematical
morphology. The pilling of fabric is, then, assessed synthetically on the basis of the size, the
number and the morphology of pilling. Tested with knitted samples, the results proved to be
satisfactory.
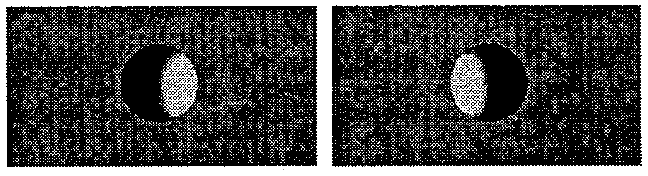
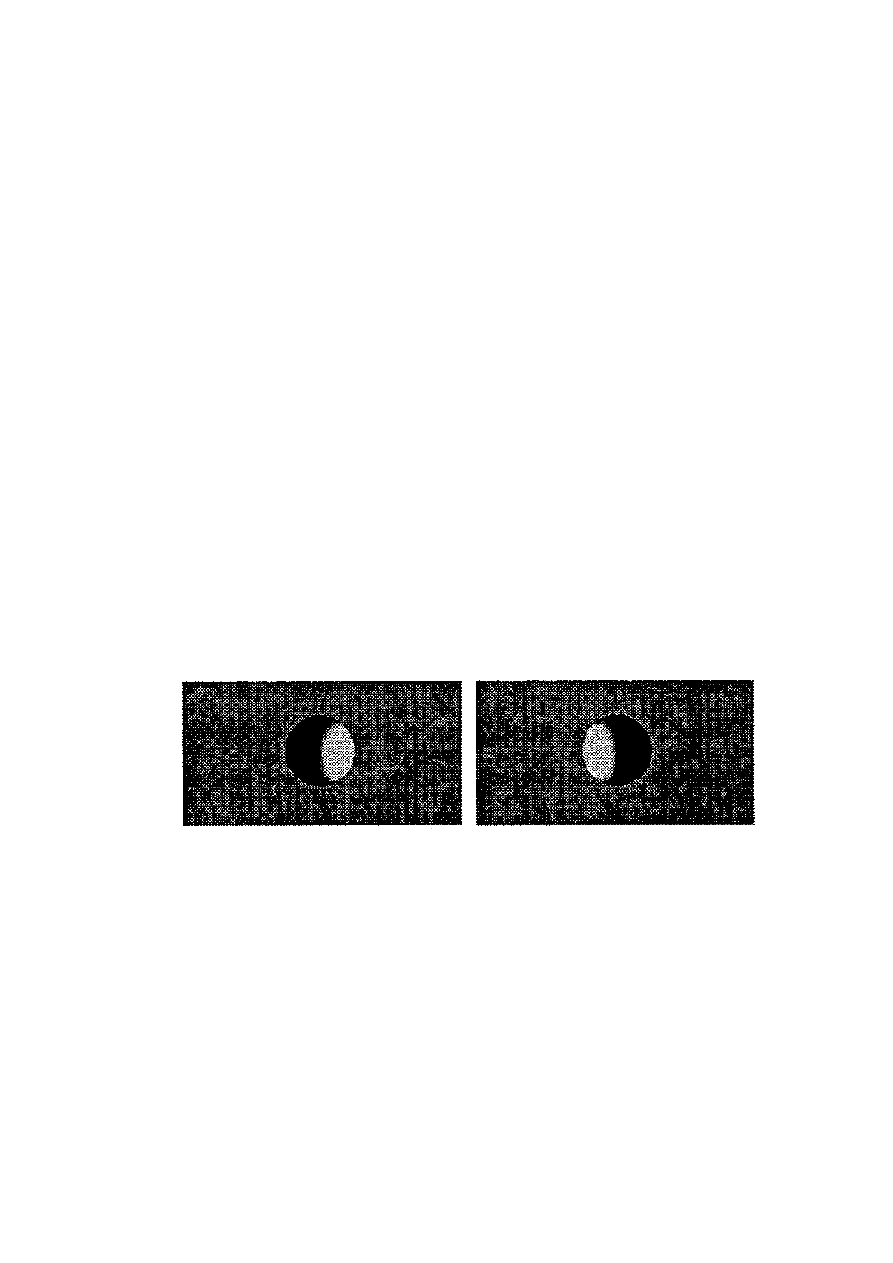
In 1999, Fazekas et al. [19] located pill regions on fabric samples by combining template matching
techniques and image thresholding. Special illumination arrangements, i.e. a bi-directional
illumination, were used to grasp the depth information from images, so that pills were properly
segmented from the background (see Figure 8).
FIGURE 8. Bi-directional illumination used for pill-detection by Fazekas et al [19]
Finally, statistically comparing the number of pills detected over a given area with the assessment
(quality classification) given by the textile experts, it is possible to empirically determine the
optimal threshold values - measured in pills per area - between the quality classes defined by the
standard.
A remarkable approach to extract pill features from fabric images was proposed in [21 20]; using a
two-dimensional Gaussian fit theory, authors train a “pill template'' using actual pill images and
determine a reasonable threshold for image segmentation using a histogram-fitting technique. Using
12
the described approach five parameters to describe pill properties (i.e. pill number, mean area of
pills, total area of pills, contrast and density) are defined. Finally, from such data, a definition of
pilling grade is provided.
The level of pilling has been also identified and characterized using the size and numbers of the
existing pills in 2005 by Huang et al. [21].
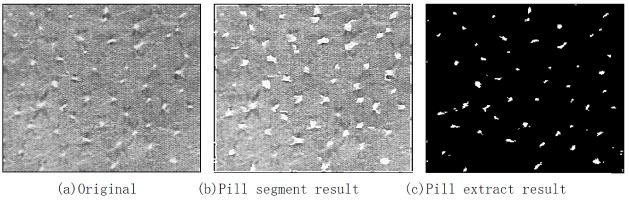
Since segmentation algorithms can be affected by fabric texture, color, and pattern, an edge-flow
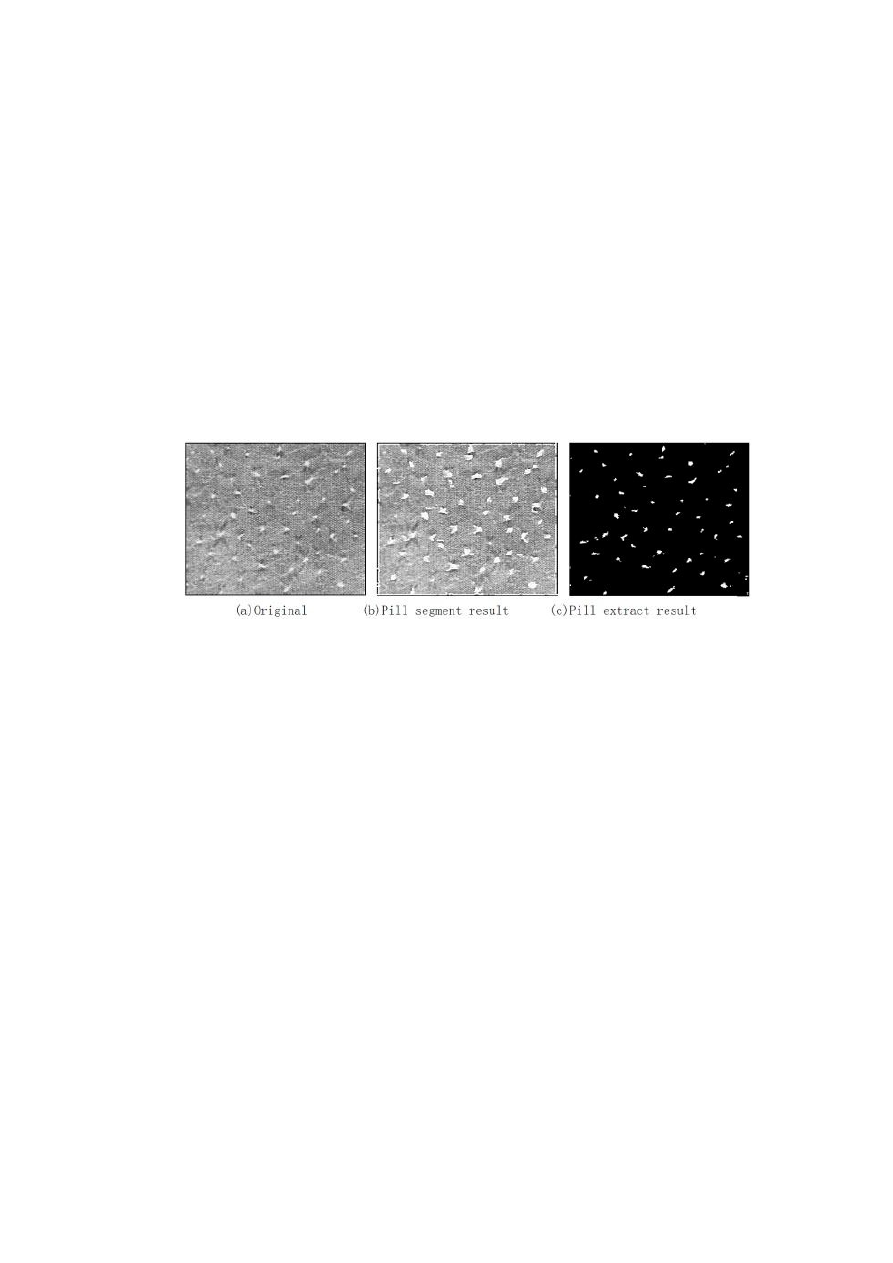
based algorithm taking all these factors into account has been proposed in [22]. This approach can
be used in different kinds of fabrics, especially those having complex background. In Figure 9 the
pilling segmentation obtained in such a work starting from fine texture woven is shown.
FIGURE 9. Pilling segmentation performed in [21].
The final result of the proposed method consists of properly segmented images where pills are easy
detectable from the background. Awkwardly, no information regarding the pilling grade deriving
from image analysis is provided.
A more recent application of image analysis to assess the fabric wrinkle and abrasion resistance in
order to compare with experimental methods is described in [23]. By employing an appropriate
lighting method, sample images were captured by using a scanner; then, images prepared from
samples were processed using MATLAB® in order to extract the pills from the background thus
deriving a pilling grade.
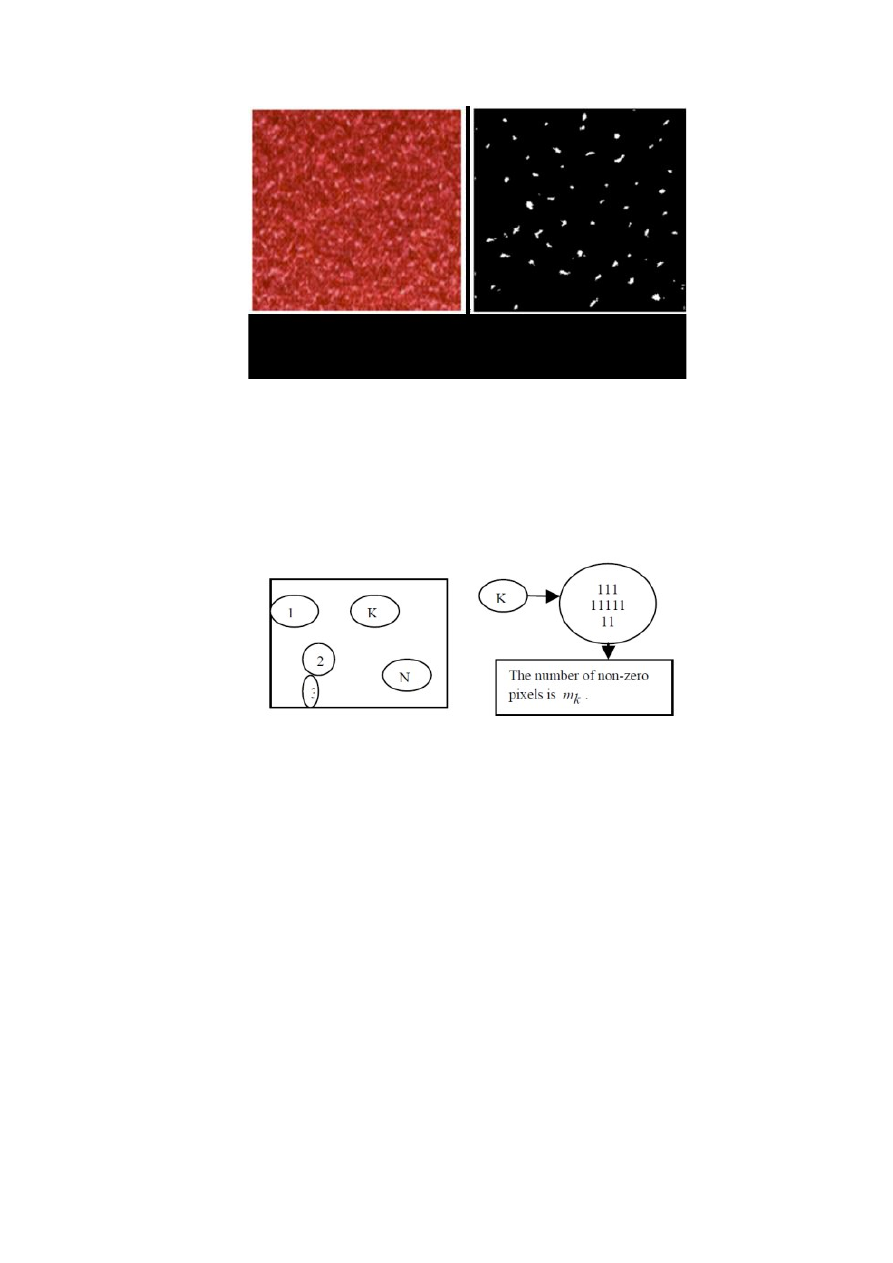
In [24] an edge-flow based fabric pilling segmentation algorithm which utilizes image color, texture
and phase of the edge flow vector [25] was adopted in order to implement the pilling segmentation
of various complex fabrics.
13
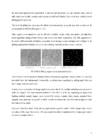
FIGURE 10. Pilling segmentation performed in [24].
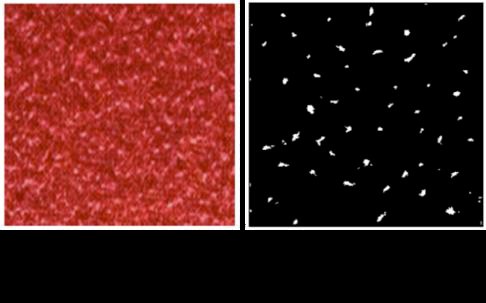
After recognizing the pilling from its background, the total number of pilling can be obtained by
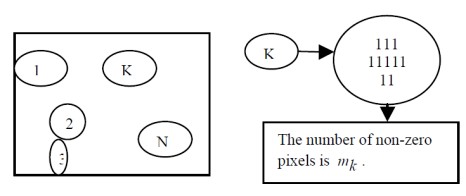
searching the connective regions in binary image. As depicted in Figure 11, every connective region
is labelled and the total number of non-zero pixel values is calculated.
FIGURE 11. A schematic representation of the method for searching pilling regions provided in
[24].
The relationships between pilling grades and the total number of pilling, the size of the total area
and the optical pilling grading are declared equal to, respectively 0.96, 0.94 and 0.92.
A novel method for locating the pills in woven fabric based on Gabor filter [26] is proposed in [27];
Gabor filter is applied to pilled fabric images in order to remove fabric textures, thus enhancing the
pills. In the enhanced fabric image, threshold method is finally used to segment and locate the fabric
pills.
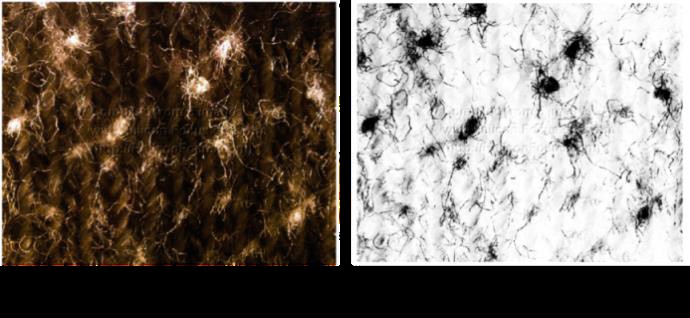
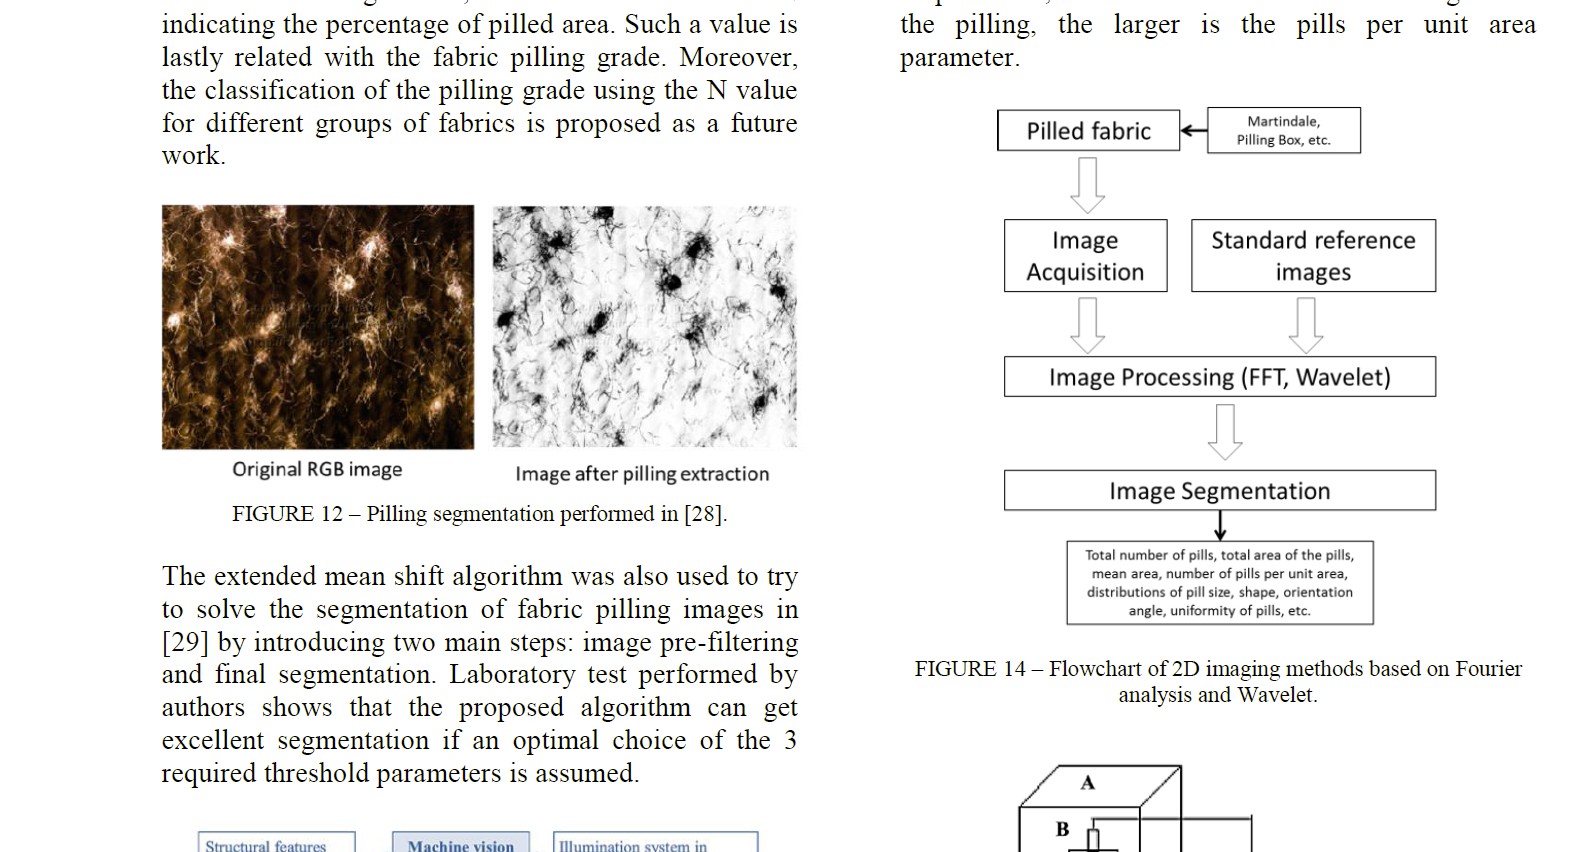
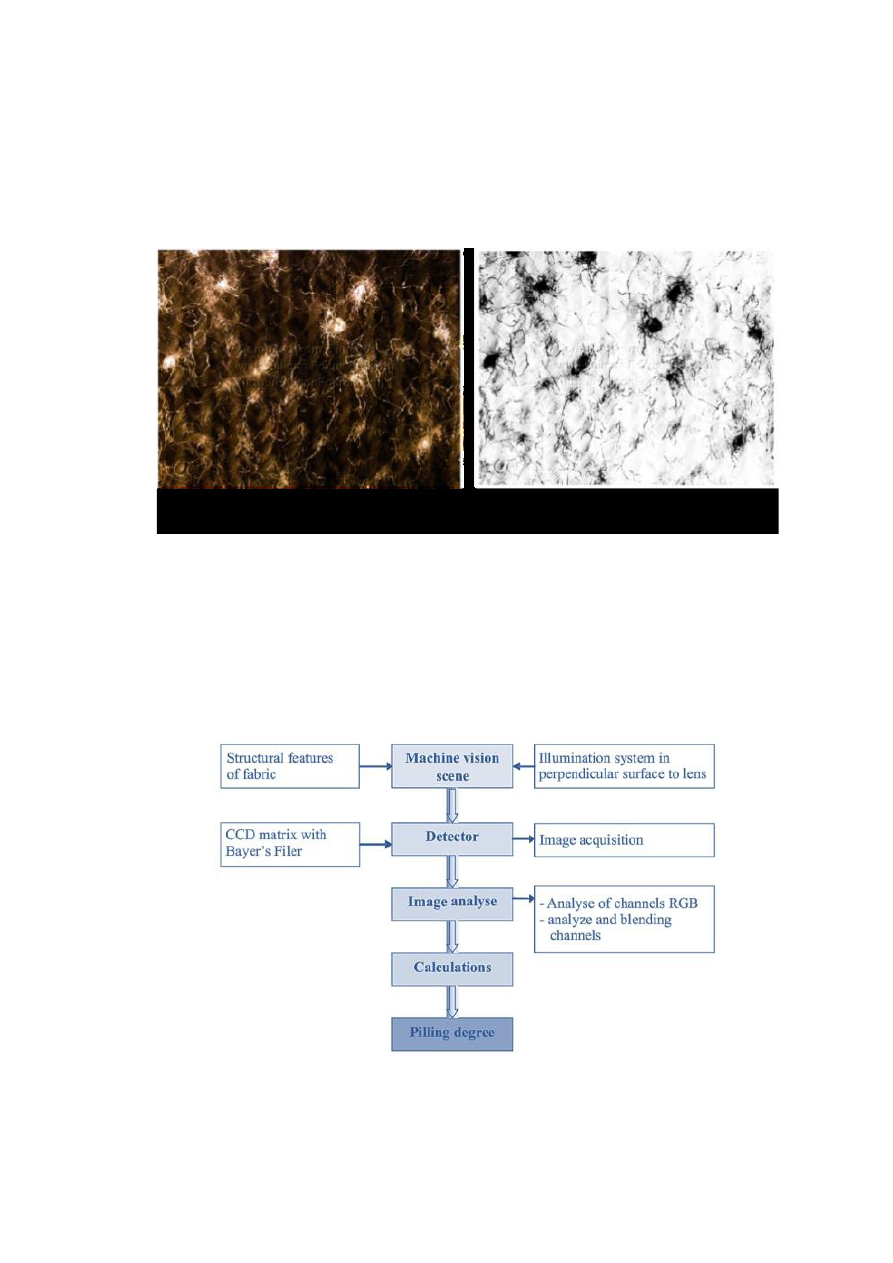
In [28] a method to analyze a pilled knitted fabric surface by using color digital images (RGB
model) is proposed. Application of the RGB model for the acquired images (see Figure 12) allows
differentiating pilling from fuzzing changes more effectively and precisely with respect to
14
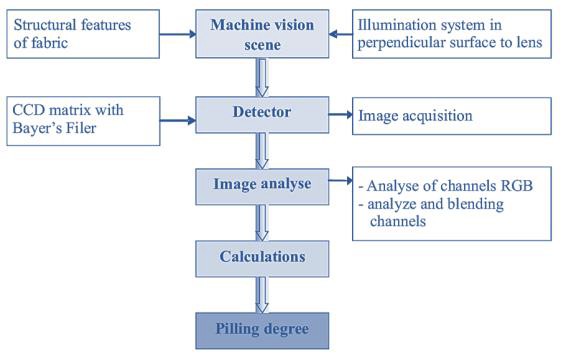
grayscale-based methods. The final result of this approach, whose flow-chart is illustrated in Figure
13, consists of an index N indicating the percentage of pilled area. Such a value is lastly related with
the fabric pilling grade. Moreover, the classification of the pilling grade using the N value for
different groups of fabrics is proposed as a future work.
FIGURE 12. Pilling segmentation performed in [28].
The extended mean shift algorithm was also used to try to solve the segmentation of fabric pilling
images in [29] by introducing two main steps: image pre-filtering and final segmentation.
Laboratory test performed by authors shows that the proposed algorithm can get excellent
segmentation if an optimal choice of the 3 required threshold parameters is assumed.
Figure 13. Flow-chart of the method proposed in [28].
15
3. 2D IMAGING METHODS BASED ON FOURIER ANALYSIS
AND WAVELET
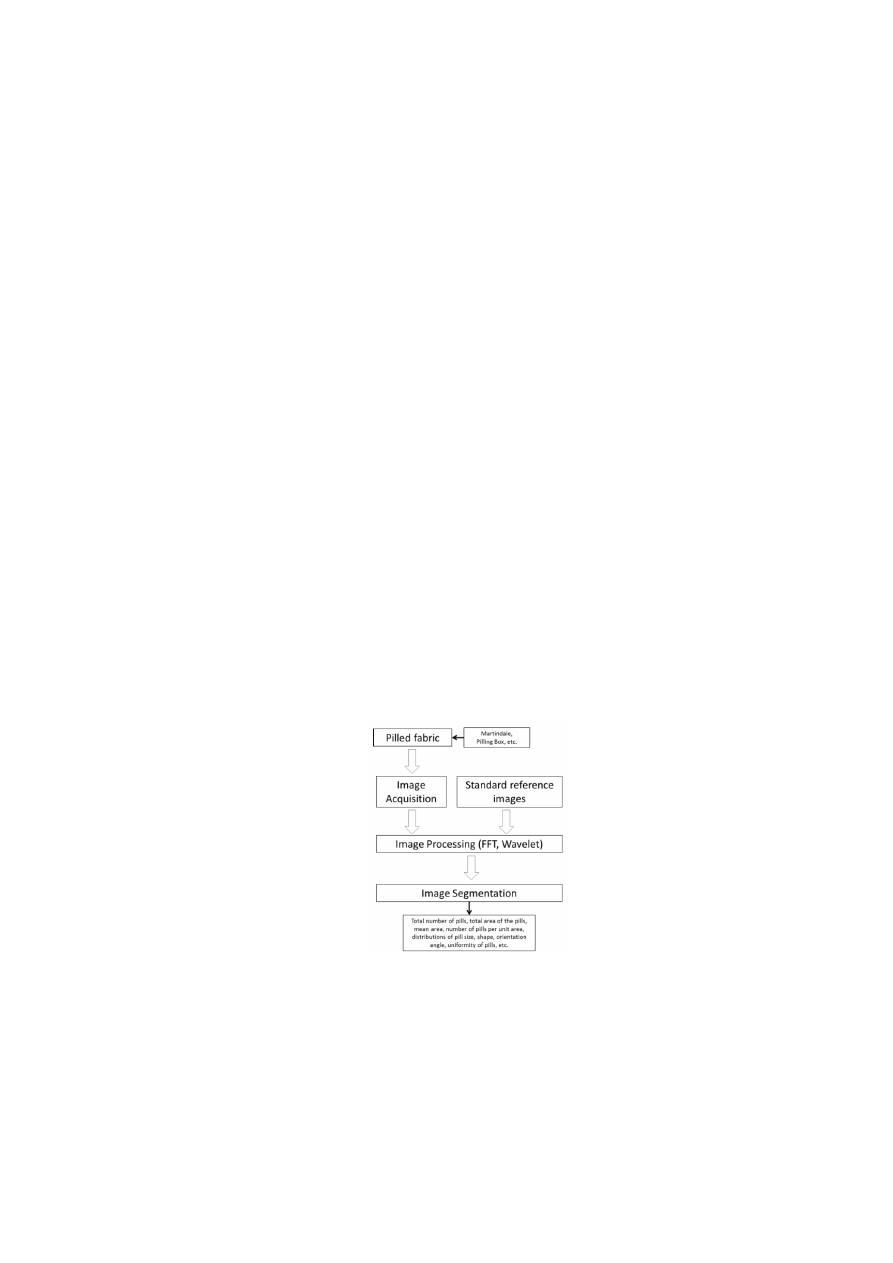
While the above mentioned papers are mostly based on image thresholding, another range of 2D
image processing based methods developed for assessing pilling grade is related to Fourier
Transform and Wavelet analysis (see Figure 14).
In 2002, Jensen and Carstensen [30] took an image from fabric surface and used a Fourier mask to
filter the knitted stitch background from the fuzz and pill. In particular, the Fourier mask has been
used to filter the knitted stitch background from the fuzz and pill.
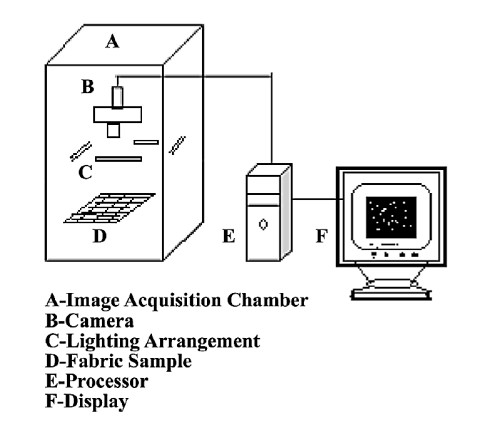
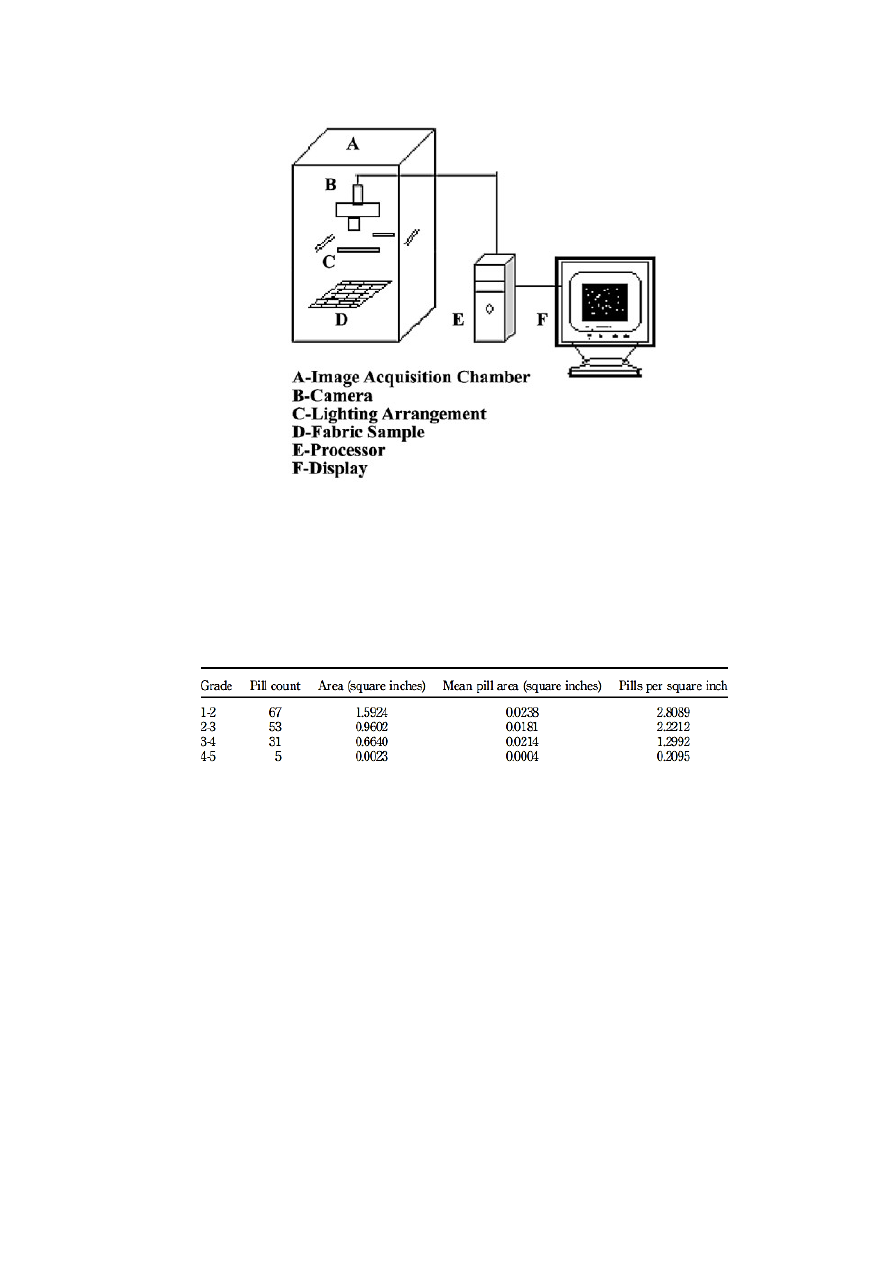
A pilling measurement cabinet was specifically designed and developed in [31] (see Figure 15).
Captured images were analyzed using appositely developed software based on thresholding and
various pilling parameters such as total number of pills, total area of the pills, mean area and
number of pills per unit area are measured. Such parameters were, then, compared with the same
ones obtained manually, thus showing a good correlation with fabric grading performed by experts.
In particular, authors demonstrated that the highest is the pilling, the larger is the pills per unit area
parameter.
FIGURE 14. Flowchart of 2D imaging methods based on Fourier analysis and Wavelet.
16
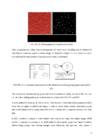
FIGURE 15. pilling measurement cabinet was specifically designed and developed in [31].
In Figure 16 some details about the pilling parameters of standards obtained from the system
devised in [31] and the EMPA standards are proposed thus demonstrating the effectiveness of the
proposed method.
FIGURE 16. some details about the pilling parameters of standards obtained from the system
devised in [31] and the EMPA standards.
A more recent approach to pilling evaluation based on the wavelet reconstruction scheme was
investigated in [32]. The method, preliminary evaluated using SM50 European standard pilling
images, shows that reconstructed resolution level, wavelet bases and sub-image used for
reconstruction affect the segmentation of pills and, thus, pilling grading. The area ratio of pills to
total image was successfully used as a pilling rating factor (in analogy with a good number of works
belonging to the all the 3 categories mentioned before).
In [33] frequency-domain image processing is used to separate periodic structures in the image (the
fabric weave/knit pattern) from non-periodic structures in the image (the pills).
17
The authors propose that for two-dimensional discrete wavelet transform (2DDWT) analysis of un-
pilled fabric images, where the wavelet scale is close to the fabric inter-yarn pitch, the distribution
of detail coefficients will have a relatively small standard deviation. On the other hand, when the
amount of pilling increases, also the standard deviation will increase as the pills introduce variations
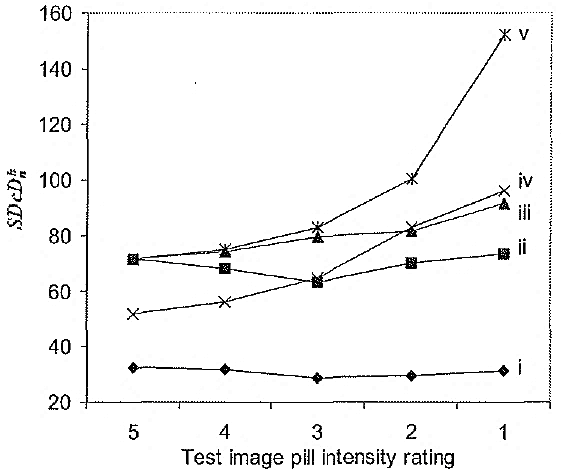
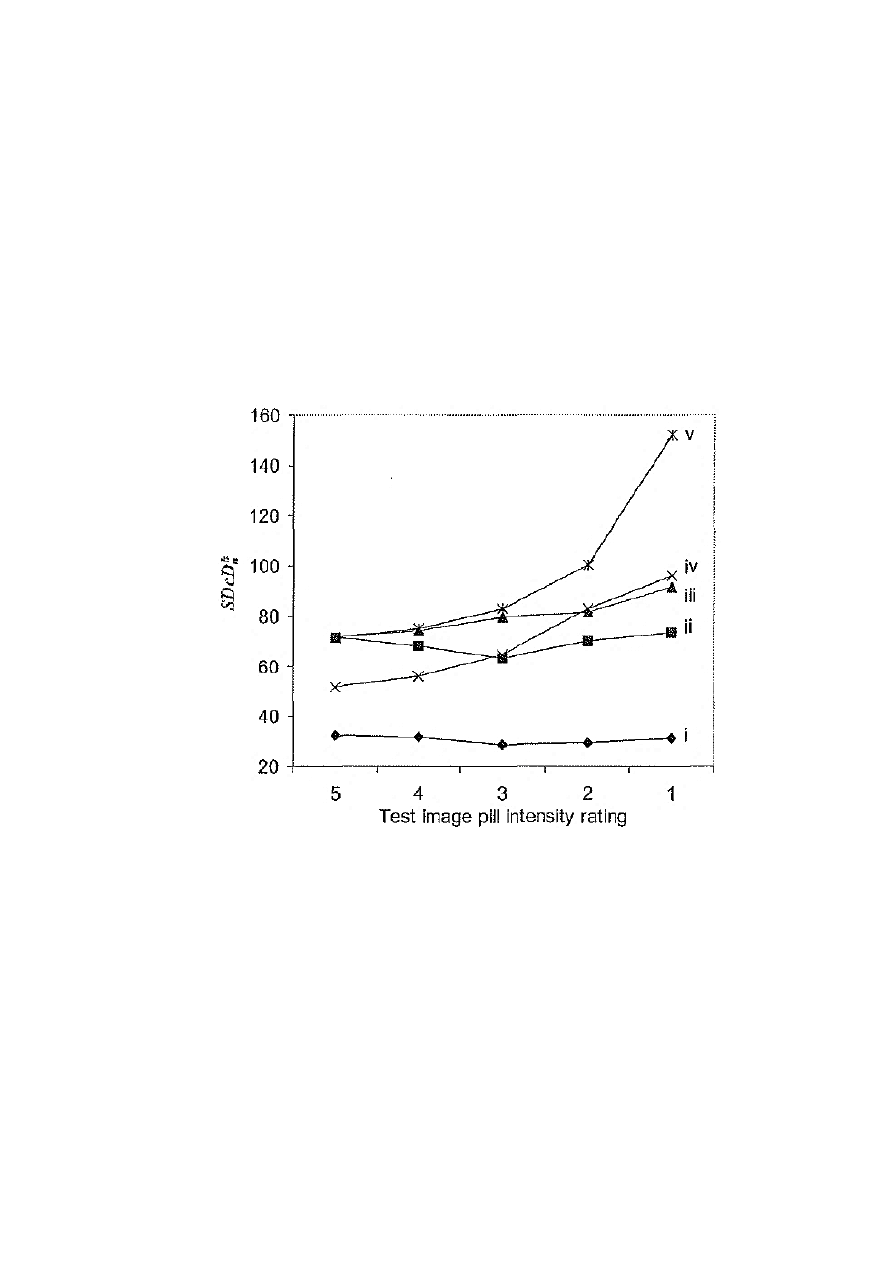
into the image that disrupt the underlying pattern of the fabric structure. Referring, for instance, to
Figure 17, taken from [33], it can be noticed that for fabrics with pilling grade equal to 1 (in the
paper indicated with the letter i) a lower value for standard deviation (i.e. the coefficient in the
paper) can be found. As the pilling grade rise from 1 to 5 (in the paper from i to v), also the tends to
rise.
FIGURE 17. Test image pill intensity rating vs. standard deviation for five pilling grades from i to v
[33].
However, as stated by the authors, a drawback of this method is that frequency domain analysis
cannot provide location information. Moreover, under particular conditions, pilling may be
expected to occur periodically, so that it cannot be easily discriminated.
A new approach for pilling evaluation based on the multi-scale two-dimensional dual tree complex
wavelet transform (CWT) has been proposed in [34]. The CWT method [35] is used to decompose
the pilled fabric image with six orientations at different scales and reconstruct fabric background
texture and pilling sub-images. An energy analysis method is, at that time, used to search for an
18
optimum image decomposition scale and to dynamically discriminate pilling image from noise,
fabric texture, fabric surface unevenness and brightness variation in the pilled fabric image.
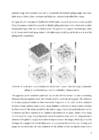
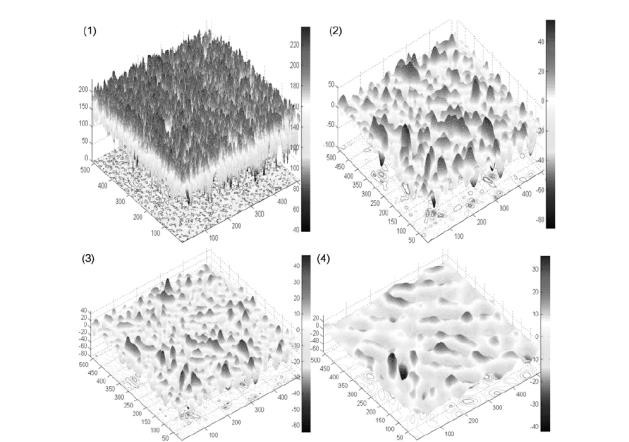
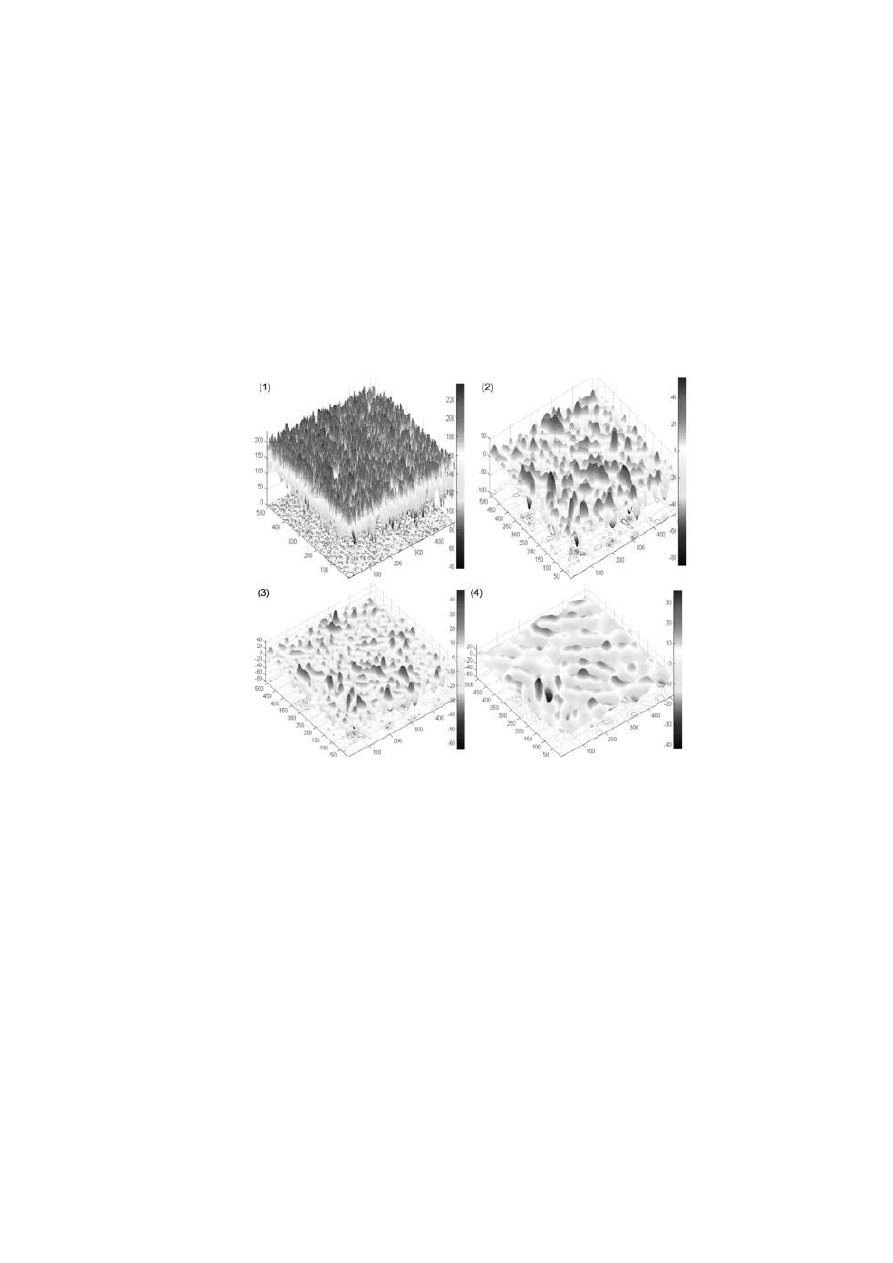
In Figure 18 a 3D mesh plot of WoolMark® SM50 Grade 1 woven fabric is shown, taken by [34].
Using the proposed method it is possible to identify pilling information over a fused and smoothed
background of gray value zero at different scales. The positive and negative maximum gray values
of the reconstructed detail image represent the highest point of pilling and the deepest point of the
pilling shadow respectively.
FIGURE 18. 1) 3D mesh plot of WoolMark® SM50 Grade 1 woven fabric from [34]; 2) identified
pilling; 3) identified pilling at scale 5; 4) identified pilling at scale 6.
This approach can be considered hybrid with the ones described in Section 1.4. since a Levenberg-
Marquardt back-propagation neural rule is finally used to classify the pilling grade. The robustness
of the above proposed method has been assessed by Zhang et al. in 2012 [36]. In detail robustness
in terms of image rotation, image dilation, image brightness variation and image contrast variations
has been assessed. The results provided by the authors suggest that the pilling identification method
is robust to significant variation in the brightness and contrast of the image, rotation of the image
and dilation of the image. The pilling feature vector developed to characterize the pilling intensity is
robust to the brightness change (but sensitive to large rotations of the image). Obviously, it requires
all images be arranged such that the illumination is coming from the same direction. As long as all
images are adjusted to have the same contrast level, the method provides an objective measurement
19
of the pilling volume and so it can be used to classify the pilling intensity[ CITATION Fur15 \l
1061 ].
Viidatud allikad
CITATION Fur15 \l 1061 : , [1],
CITATION Fur15 \l 1061 : , [1],
20
See on täidetud versioon TKTK vormistus aine ülesanne 1-st
Sarnased õppematerjalid
![Book Analog Interfacing to Embedded Microprocessors]()
568
pdf
Book Analog Interfacing to Embedded Microprocessors
�Analog Interfacing to Embedded
Microprocessors
Real World Design
��Analog Interfacing to Embedded
Microprocessors
Real World Design
Stuart Ball
Boston Oxford Auckland Johannesburg Melbourne New Delhi
�Newnes is an imprint of Butterworth–Heinemann.
Copyright © 2001 by Butterworth–Heinemann
A member of the Reed Elsevier group
All rights reserved.
No part of this publication may be reproduced, stored in a retrieval system, or transmitted in
any form or by any means, electronic, mechanical, photocopying, recording, or otherwise,
without the prior written permission of the publisher.
Recognizing the importance of preserving what has been written, Butterworth–Heinemann
prints its books on acid-free paper whenever possible.
Library of Congress Cataloging-in-Publication Data
Ball, Stuart R., 1956–
Analog interfacing to embedded microprocessors : real world design / Stuart Ball.
p. cm.
ISBN 0-7506-7339-7 (pbk. : alk. paper)
1. Embedded computer
![Capillary electrophoresis i k]()
60
pdf
Capillary electrophoresis i.k.
Tallinn University
Natural and exact sciences
Molecular Biochemistry and Ecology
Maria Gnidenko
Capillary electrophoresis
Essay
Supervisor: Kert Martma
Tallinn
2015
�Table of contents
Acronyms and symbols used
Introduction
History and development
Physical basis and principle of separation
Elektrophoresis
Electroosmotic flow
Separation process
Electrodispersion
Various methods of separation
Capillary zone?
![Vormistamine ülesanne 3]()
18
docx
Vormistamine ülesanne 3
Edith D. de Leeuw, Joop J. Hox, Don A. Dillman
INTERNATIONAL HANDBOOK OF
SURVEY METHODOLOGY
ÜLESANNE
Õppeaines: SISSEJUHATUS ERIALASSE
Tehnoloogia ja ringmajanduse instituut
Õpperühm:
Juhendaja:
Tallinn 2021
�TABLE OF CONTENTS
2
�1 THE CORNERSTONES OF SURVEY RESEARCH
1.1 Introduction
The idea of conducting a survey is deceptively simple. It involves identifying a specific group or
category of people and collecting information from some of them in order to gain insight into what
the entire group does or thinks; however, undertaking a survey inevitably raises questions that may
be difficult to answer. How many people need to be surveyed in order to be able to describe fairly
accurately the entire group? How should the people be selected? What questions should be asked
and how should they be posed to respondents? In addition, what data collectio
![Mageveekäsna Ephydatia fluviatilis populatsiooni geneetiline analüüs]()
12
pdf
Mageveekäsna Ephydatia fluviatilis populatsiooni geneetiline analüüs
Intragenomic Profiling Using Multicopy Genes: The rDNA
Internal Transcribed Spacer Sequences of the Freshwater
Sponge Ephydatia fluviatilis
Liisi Karlep, To~nu Reintamm, Merike Kelve*
Department of Gene Technology, Tallinn University of Technology, Tallinn, Estonia
Abstract
Multicopy genes, like ribosomal RNA genes (rDNA), are widely used to describe and distinguish individuals. Despite
concerted evolution that homogenizes a large number of rDNA gene copies, the presence of different gene variants within
a genome has been reported. Characterization of an organism by defining every single variant of tens to thousands of rDNA
repeat units present in a eukaryotic genome would be quite unreasonable. Here we provide an alternative approach for the
characterization of a set of internal transcribed spacer sequences found within every rDNA repeat unit by implementing
direct sequencing methodology. The prominent allelic variants and their relative amounts c
![Thesis Kivimaa August 2022]()
140
pdf
Thesis Kivimaa August 2022
Thesis
“How is it possible to calculate IT security effectiveness?”
Kristjan Kivimaa
August 2022
1
�Abstract
In IT Security world, there is lack of available, reliable systems for measuring security
levels/posture. They lack the range of quantitative measurements and easy and fast deployment,
and potentially affects companies of all sizes.
Readily available security standards provide qualitative security levels, but not quantitative results
– that would be easily comparable. This deficiency makes it hard for companies to evaluate their
security posture accurately. Absence of security metrics makes it complicated for customers to
select the appropriate measures for particular security level needed.
The research question for this research project is – “How is it possible to calculate IT security
effectiveness?”.
The aim of this research is to use this reference m
![Automaatika referaat-eng]()
10
doc
Automaatika referaat (eng)
Tallinna Polütehnikum
Automation
Author: TomTom2
Group :AA-09
Instructor: Marina Zotikova
� Tallinn 2010
Contents
Introduction......................................................................................................................3-4
Person Knowledge Technologies supports......................................................................4-6
Online Essay Evaluation Service.....................................................................................6-7
WordNet lexical database................................................................................................7-8
Practice Online (TPO)......................................................................................................8-9
Conclusion..........................
![Integration of Lean Con-and Building Information Modelling]()
109
pdf
Integration of Lean Con. and Building Information Modelling
Ergo Pikas
Integration of Lean
Construction and Building
Information Modelling
DISSERTATION
Tallinn 2010
2
�UNIVERSITY OF APPLIED SCIENCES
Author: Ergo Pikas- Civil Engineering student, Faculty of Construction, Tallinn
University of Applied Sciences
Supervisor: Rafael Sacks- Associate Professor, Faculty of Civil and Env. Engineering,
Technion Israel Institute of Technology
Consultant: Roode Liias- Professor and Dean, Faculty of Civil Engineering, Tallinn
University of Technology
Title: Integration of Lean Construction and Building Information Modelling
Archived: University of Applied Sciences, Faculty of Construction
ABSTRACT
This research can be divided into two. The first part investigates the current state of the construction
industry, while the second part looks at new emerging busin
![Kuidas muudab mudelprojekteerimine teraskonstruktsioonide valmistamist ja ehitamist]()
228
pdf
Kuidas muudab mudelprojekteerimine teraskonstruktsioonide valmistamist ja ehitamist
EHITUSTEADUSKOND
Ehitustootluse instituut
KUIDAS MUUDAB MUDELPROJEKTEERIMINE
TERASKONSTRUKTSIOONIDE PROJEKTEERIMIST,
VALMISTAMIST JA EHITAMIST?
HOW ARE 3D AND BIM CHANGING THE DESIGN, FABRICATION AND
CONSTRUCTION OF COMPLEX STEEL STRUCTURES?
EPJ 60 LT
Üliõpilane: Tanel Friedenthal
Juhendaja: Prof. Roode Liias
Kaasjuhendaja: Prof. Carrie S. Dossick
Tallinn, 2010.a.
�Olen koostanud lõputöö iseseisvalt.
Kõik töö koostamisel kasutatud teiste autorite tööd, olulised seisukohad,
kirjandusallikatest ja mujalt pärinevad andmed on viidatud.
……………………………………………..
(töö autori allkiri ja kuupäev)
Üliõpilase kood: 041399
Töö vastab magistritööle esitatud nõuetele
…………………………………………?
Meedia
Kommentaarid (0)
 50 punkti
Autor soovib selle materjali allalaadimise eest saada 50 punkti.
50 punkti
Autor soovib selle materjali allalaadimise eest saada 50 punkti.
 ~ 20 lehte
Lehekülgede arv dokumendis
~ 20 lehte
Lehekülgede arv dokumendis
 2021-11-25
Kuupäev, millal dokument üles laeti
2021-11-25
Kuupäev, millal dokument üles laeti
 2 laadimist
Kokku alla laetud
2 laadimist
Kokku alla laetud
 0 arvamust
Teiste kasutajate poolt lisatud kommentaarid
0 arvamust
Teiste kasutajate poolt lisatud kommentaarid
 SipsikuEma
Õppematerjali autor
SipsikuEma
Õppematerjali autor
 annaabi.ee


























Kõik kommentaarid