ELEKTROENERGEETIKA INSTITUUT
ReferaatTaastvad Energiaallikad Esitamise
tähtaeg
14.04.2009
Õppejõud:
Hannes Agabus
Tudeng:
Sergei Belosapko
Nikita Naumov
Tallinn
2009
Contents:1.
Renewable energy
1.1.
Costs …………………………………………………………………………………………………….2
1.2.
Potential future
utilization……………………………………………………………………4
1.3.
Why Don’t We Use More Renewable Energy? …………………………………….5
2.
Energy
Types 2.1.
Wind Energy………………………………………………………………………………………….6
2.1.1.
Annual Generation…………………………………………………………………………….7
2.1.2.
Growth and
cost trends ……………………………………………………………………..8
2.1.3.
Theoretical potential………………………………………………………………………….9
2.1.4.
Benefits of wind energy……………………………………………………………………..10
2.2.
Solar Energy…………………………………………………………………………………………..11
2.2.1
Development ,
deployment and
economics …………………………………………12
2.3.
Hydroenergy………………………………………………………………………………………….13
2.4.
Geothermal Energy………………………………………………………………………………..14
2.5.
Biomass Energy……………………………………………………………………………………….16
3.
Conclusion ………………………………………………………………………………………………….18
4.
Sources …………………………………………………………………………………………………….…19
Renewable
energyRenewable
energy
is energy generated from natural
resources—
such as , wind, rain,
tides and geothermal
heat —which are renewable
(naturally replenished). In 2006, about 18% of
global final energy
consumption came from renewables, with 13%
coming from traditional
biomass, such as
wood -burning.
Hydroelectricity was the next
largest renewable source,
providing 3% (15% of global electricity
generation),followed by solar hot
water/heating, which contributed 1.3%. Modern technologies, such
as geothermal energy, wind
power , solar power, and
ocean energy together provided some 0.8% of final energy consumption.
While there are many large-
scale renewable energy projects and
production ,
renewable technologies are also suited to small
off-
grid applications, sometimes in rural
and remote
areas , where energy is often crucial in human
development.
Kenya has the world's
highest household solar ownership
rate with roughly 30,000 small (20–100
watt ) solar power systems
sold per
year .
Some
renewable energy technologies are criticised for being intermittent
or unsightly, yet the
market is
growing for many
forms of renewable
energy. Climate change
concerns coupled with high oil
prices,
peak oil and increasing
government support are
driving increasing renewable energy
legislation , incentives and commercialization.
New government spending,
regulation , and policies should help the
industry weather the 2009
economic crisis better
than many
other sectors.
CostsRenewable
energy systems encompass a broad,
diverse array of technologies, and
the
current status of
these can
vary considerably. Some technologies
are
already mature and economically
competitive (e.g. geothermal and
hydropower ), others need additional development to become competitive
without subsidies. This can be helped by improvements to
sub-
components , such as
electric generators.
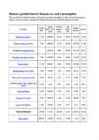
The
table
shows an
overview of costs of various renewable energy
technologies. For
comparison with the prices in the table,
electricity production from a conventional
coal -
fired plant costs
about 4¢/kWh. Though in some G8 nations the cost can be
significantly
higher at 7.88p (~15¢/kWh).Achieving further cost
reductions as indicated in the table below
requires further
technology development, market deployment, an
increase in production
capacities to mass production
levels,and of the
establishment of an
emissions trading scheme and/or
carbon tax
which would
attribute a cost to each
unit of carbon emitted; thus
reflecting the true cost of energy production by fossil
fuels which then
could be used to
lower the cost/kWh of these
renewable energies.
Type2001 energy costsPotential future energy costWind
4–8 ¢/kWh
3–10 ¢/kWh
Solar photovoltaic
25–160 ¢/kWh
5–25 ¢/kWh
Solar thermal
12–34 ¢/kWh
4–20 ¢/kWh
Large hydropower
2–10 ¢/kWh
2–10 ¢/kWh
Small hydropower2–12 ¢/kWh
2–10 ¢/kWh
Geothermal
2–10 ¢/kWh
1–8 ¢/kWh
Biomass
3–12 ¢/kWh
4–10 ¢/kWh
Coal (comparison)
4 ¢/kWh
Geothermal heat
0.5–5 ¢/kWh
0.5–5 ¢/kWh
Biomass — heat1–6 ¢/kWh
1–5 ¢/kWh
Low temp solar heat
2–25 ¢/kWh
2–10 ¢/kWh
All costs are in 2001 US$-cent per
kilowatt -hour.
Source: World Energy
Assessment , 2004
update [28]
Potential
future utilizationPresent renewable energy sources
supply about 18% of current energy use and
there is much potential that could be exploited in the future. As the
table below illustrates, the technical potential of renewable energy
sources is more than 18
times current global
primary energy use and
furthermore several times higher than projected
energy use in 2100.
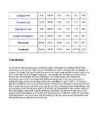
The Renewable Energy Resource Base (Exajoules per year)Current use (2001)Technical potentialTheoretical
potentialHydropower9
50
147
Biomass energy50
>276
2,900
Wind energy0.12
640
6,000
Solar energy0.1
>1,575
3,900,000
Geothermal energy0.6
--
Ocean energynot
estimated not estimated
7,400
Total 60
>1,800
>4,000,000
Current use is in primary energy
equivalent .
For comparison, the global primary energy use was 402 EJ per year in 2001.
Source: World Energy Assessment 2001[53]
Current use is in primary energy equivalent.
For comparison, the global primary energy use was 402 EJ per year in 2001.
Source: World Energy Assessment 2001[53]
Why
Don’t We Use More Renewable Energy?
In
the past, renewable energy has generally been more
expensive to use
than fossil fuels. Plus, renewable resources are often located remote
areas and it is expensive to
build powerlines to the cities where
they are needed. The use of renewable sources is also limited by the
fact that they are not always
available (for example, cloudy
days reduce solar energy, calm days
mean no wind blows to
drive wind
turbines , droughts reduce water availability to produce
hydroelectricity).
The
production and use of renewable fuels has
grown more quickly in
recent
years due to higher prices for oil and natural gas, and a
number of State and Federal Government incentives,
including the
Energy Policy
Acts of 2002 and 2005. The use of renewable fuels is
expected to
continue to
grow over the next 30 years,
although we will
still rely on non-renewable fuels to meet most of our energy needs.
trends
ConsumptionTotal
renewable energy consumption increased by 478 trillion Btu or 7
percent between 2005 and 2006 to 6,922 trillion Btu . At the
same time total US energy consumption decreased 1 percent largely due to
decreases across the
board in fossil fuel energy consumption. The
combination of these trends resulted in
moving renewable energy's
share of total US energy to
nearly 7 percent, up from over 6 percent
in 2005
During 2006 renewable energy consumption reached its highest level
since 1997, which was a
record year for hydropower due to water
availability . Hydropower is the second largest source of renewable
energy consumption.
Biomass
and conventional hydroelectric power had the largest volumetric
increases at 220 and 166 trillion Btu respectively, while wind energy
consumption had the fastest annual rate of growth at
almost 50
percent.
The
electric power
sector continued to be the largest consumer of
renewable energy in 2006 (55 percent of total), primarily due to the
very large
contribution of conventional hydroelectric power . The
industrial sector was second (29 percent of the total), due to that
sector's
major consumption of wood and derived fuels. Geothermal and
conventional hydropower played only
minor roles in the industrial
sector. The
residential sector also consumed wood for
space heating
and solar energy for water heating and electricity. The commercial
sector accounted for just 2 percent of total renewable energy
consumption. The transportation sector was the fastest growing
sector, consuming 40 percent more renewable fuel between 2005 and
2006. This is mainly due to increased
ethanol consumption, by far the
larger component of biofuels during those years.
Renewable
energy used to produce electricity contributed 4.229 quadrillion Btu
or 61 percent of total renewable energy consumption in 2006 .
Ninety
percent of this energy was consumed in the electric power sector,
which includes traditional electric utilities and independent power
producers whose primary purpose is to sell electricity, or
electricity and heat, to the public. Almost all of the remainder is
used by the industrial sector. Nonhydro renewable electricity energy
consumption
expanded slowly from 1,278 to 1,360 trillion Btu between
2002 and 2006. Increases in wind consumption were partially offset by
decreases in biomass.
Nonelectric
uses of renewable energy made up the
balance (2,693 trillion Btu or
39 percent) of renewable energy consumption.
Nonelectric
uses
include applications such as wood for space heating, noncentral
station solar,
process heat from biomass for manufacturers,
geothermal heat pumps and
direct use of geothermal, biofuels for
transportation and
losses and coproducts from the production of
biofuels. Over the last
five years the share of renewable energy
consumed for nonelectric use expanded from 33 to 39 percent.
Types
Wind
EnergyWind
power
is the conversion of wind energy into a useful form, such as
electricity, using wind turbines. At
the end of 2008,
worldwide nameplate
capacity of wind-powered generators was 121.2 gigawatts.Although
wind produces only about 1.5% of worldwide electricity use, it is
growing rapidly,
having doubled in the three years between 2005 and
2008. In several countries it has achieved relatively high levels of
penetration, accounting for
approximately 19% of electricity
production in
Denmark , 11%
in
Spain and
Portugal ,
and 7% in
Germany and the
Republic of Ireland in
2008.
Wind
energy has historically been used directly to propel sailing
ships or converted into mechanical energy for pumping water or
grinding grain, but the principal application of wind power
today is
the generation of electricity. Wind power,
along with solar
power, is non-dispatchable, meaning that for economic operation
all of the available output must be taken when it is available, and
other resources, such as hydroelectricity,
must be used to
match supply with
demand .
Large
scale wind farms are
typically connected to the
local electric
power transmission
network , with smaller turbines being used to
provide electricity to isolated locations. Utility companies
increasingly buy
back surplus
electricity produced by small domestic turbines. Wind energy as a
power source is favoured by many environmentalists
as an
alternative to fossil fuels, as
it is plentiful, renewable,
widely distributed,
clean , and produces lower greenhouse
gas emissions, although the
construction of wind farms is not
universally welcomed due to their visual impact and other effects
on the environment. The intermittency
of wind seldom creates problems when using wind power to supply a low
proportion of total demand. Where wind is to be used for a moderate
fraction of demand, additional costs for compensation of
intermittency are
considered to be modest.
Annual
generationAnnual
Wind Power Generation (TWh) for Top 10 countries and their total
electricity consumption(TWh
Rank Nation 2005200620072008Wind
Power
Total
Power
Wind
Power
Total
Power
Wind
Power
Total
Power
Wind
Power
Total
Power
1
Germany
27.2
5.1%
533.7
30.7
5.4%
569.9
38.5
6.6%
584.9
2
United States
17.8
0.4%
4048.9
26.6
0.7%
4058.1
34.5
0.8%
4149.9
52.0
1.3%
4108.6
3
Spain
20.7
7.9%
260.7
22.9
8.5%
268.8
27.2
9.8%
276.8
31.4
11.1%
282.1
4
India
679.2
726.7
14.7
1.9%
774.7
5
China 2474.7
2.7
0.1%
2834.4
5.6
0.2%
3255.9
12.8
0.4%
3426.8
6
Italy 2.3
0.7%
330.4
3.0
0.9%
337.5
4.0
1.2%
339.9
7
Denmark
6.6
18.5%
35.7
6.1
16.8%
36.4
7.2
19.7%
36.4
6.9
19.1%
36.2
8
France
1.0
0.2%
482.4
2.2
0.5%
478.4
4.0
0.8%
480.3
5.6
1.1%
494.5
9
United Kingdom
1.0
0.2%
407.4
383.9
379.8
10
Portugal
1.7
3.6%
47.9
2.9
5.9%
49.2
4.0
8.0%
50.1
5.7
11.3%
50.6
Growth
and cost trendsWind
and hydroelectric power generation
have negligible fuel costs and relatively low
maintenance costs; in
economic
terms , wind power has a low
marginal cost and a high proportion of capital cost. The estimated
average cost per unit incorporates the cost of construction of the
turbine and transmission
facilities , borrowed funds,
return to
investors (including cost of risk), estimated annual production, and
other components, averaged over the projected useful life of the
equipment , which may be in
excess of twenty years. Energy cost
estimates are
highly dependent on these assumptions so published cost
figures can
differ substantially. A
British Wind Energy Association
report gives an average generation cost of onshore wind power of
around 3.2 cents per kilowatt hour (2005).Cost per unit of energy
produced was estimated in 2006 to be comparable to the cost of new
generating capacity in the United States for coal and natural gas:
wind cost was estimated at $55.80 per MWh, coal at $53.10/MWh and
natural gas at $52.50. Other sources in various studies have
estimated wind to be more expensive than other sources (see Economics
of new
nuclear power
plants , Clean
coal, and Carbon
capture and
storage ).
In
2004, wind energy cost one-fifth of what it did in the 1980s, and
some expected that downward trend to continue as larger
multi-megawatt turbines were
mass-produced.
However , installed cost averaged €1,300 per kilowatt
in 2007,compared to €1,100 per kilowatt in 2005. Not as many
facilities can produce large modern turbines and their towers and
foundations, so
constraints develop in the supply of turbines
resulting in higher costs. Research from a wide variety of sources in
various countries shows that support for wind power is consistently
between 70 and 80 percent amongst the general public.
Global
Wind Energy Council (GWEC) figures show that 2007 recorded an
increase of installed capacity of 20 GW, taking the total installed
wind energy capacity to 94 GW, up from 74 GW in 2006. Despite
constraints facing supply chains for wind turbines, the annual market
for wind continued to increase at an estimated rate of 31% following
32% growth in 2006. In terms of economic
value , the wind energy
sector has become one of the
important players in the energy markets,
with the total value of new generating equipment installed in 2007
reaching €25
billion , or US$36 billion.
Although
the wind power industry will
be impacted by the global
financial crisis in 2009 and 2010, a BTM
Consult five year
forecast up to 2013 projects substantial
growth. Over the past five years the average growth in new
installations has been 27.6 percent each year. In the forecast to
2013 the expected average annual growth rate is 15.7 percent
More than 200 GW of new wind power capacity could
come on line
before the end of 2013. Wind power market penetration is expected to
reach 3.35 percent by 2013 and 8 percent by 2018
Existing
generation capacity represents sunk costs,
and the
decision to continue production will
depend on marginal costs
going forward , not estimated average costs at
project inception. For
example, the estimated cost of new wind power capacity may be lower
than that for "new coal" (estimated average costs for new
generation capacity) but higher than for "old coal"
(marginal cost of production for existing capacity).
Therefore , the
choice to increase wind capacity will depend on factors including the
profile of existing generation capacity.
Theoretical
potentialWind
power available in the atmosphere is much
greater than current world
energy consumption. The most comprehensive
study to date
found the
potential of wind power on
land and
near -shore to be 72 TW,
equivalent to 54,000 MToE
(million tons of oil equivalent) per year, or over five times the
world's current energy use in all forms. The potential takes into
account only locations with mean annual wind speeds ≥ 6.9 m/s at 80
m. It assumes 6 turbines per
square kilometer for 77 m
diameter , 1.5
MW turbines on roughly 13% of the total global land area (though that
land would also be available for other compatible uses such as
farming). The
authors acknowledge that many
practical barriers would
need to be overcome to reach this theoretical capacity.
AdvantagesWind
energy is fueled by the wind, so it's a clean fuel source. Wind
energy doesn't pollute the air like power plants that rely on
combustion of fossil fuels, such as coal or natural gas. Wind
turbines don't produce atmospheric emissions that
cause acid rain or
greenhouse gasses.
Wind
energy is a domestic source of energy, produced in the United States.
The nation's wind supply is abundant.
Wind
energy relies on the renewable power of the wind, which can't be used
up. Wind is actually a form of solar energy; winds are caused by the
heating of the atmosphere by the sun, the
rotation of the earth, and
the earth's surface irregularities.
Wind
energy is one of the lowest-priced renewable energy technologies
available today, costing between 4 and 6 cents per kilowatt-hour,
depending upon the wind resource and project financing of the
particular project.
Wind
turbines can be
built on farms or ranches, thus benefiting the
economy in rural areas, where most of the
best wind
sites are found.
Farmers and ranchers can continue to work the land because the wind
turbines use only a fraction of the land. Wind power plant owners
make rent
payments to the
farmer or rancher for the use of the land.
DisadvantagesWind
power must
compete with conventional generation sources on a cost
basis . Depending on how energetic a wind site is, the wind farm may
or may not be cost competitive.
Even though the cost of wind power
has decreased dramatically in the past 10 years, the technology
requires a higher initial investment than fossil-fueled generators.
The
major challenge to using wind as a source of power is that the wind
is intermittent and it does not always blow when electricity is
needed. Wind energy cannot be
stored (unless batteries are used); and
not all winds can be harnessed to meet the timing of electricity
demands.
Good
wind sites are often located in remote locations, far from cities
where the electricity is needed.
Wind
resource development may compete with other uses for the land and
those alternative uses may be more highly valued than electricity
generation.
Although
wind power plants have relatively
little impact on the environment
compared to other conventional power plants, there is some
concern over the noise produced by the rotor blades, aesthetic (visual)
impacts, and sometimes birds have been
killed by flying into the
rotors. Most of these problems have been resolved or greatly reduced
through technological development or by properly siting wind plants.
The
Benefits of 20% Wind Energy by 2030According
to the American Wind Energy Association, if we increase our nation's
wind energy capacity to 20% by 2030, it would…
Reduce
Greenhouse Gas EmissionsA
cumulative total of 7,600 million tons of CO2 would be avoided by
2030, and more than 15,000 million tons of CO2 would be avoided by
2050 .
Conserve
Water
Reduce
cumulative water consumption in the electric sector by 8% or 4
trillion gallons from 2007 through 2030.
Lower
Natural Gas PricesSignificantly
reduce natural gas demand and reduce natural gas prices by 12%,
saving consumers approximately $130 billion.
Expand Manufacturing To
produce enough turbines and components for the 20% wind scenario, the
industry would
require more than 30,000 direct manufacturing
jobs across the nation (assuming that 30% – 80% of major turbine
components would be manufactured domestically by 2030).
Generate Local Revenues Lease
payments for wind turbines would generate well over $600 million for
landowners in rural areas and generate additional local tax revenues
exceeding $1.5 billion annually by 2030. From 2007 through 2030,
cumulative economic activity would exceed $1 trillion or more than
$440 billion in net present value terms.
Solar
Energy
Solar
energy technologies use the sun's energy and
light to provide heat,
light, hot water, electricity, and even cooling, for
homes ,
businesses, and industry.
There
are a variety of technologies that have been developed to take
advantage of solar energy. These include:
Photovoltaic
Systems
Producing
electricity directly from sunlight. Solar cells
convert sunlight
directly into electricity. Solar cells are often used to power
calculators and watches. They are made of semiconducting materials
similar to those used in computer chips. When sunlight is absorbed by
these materials, the solar energy knocks electrons loose from their
atoms, allowing the electrons to flow through the
material to produce
electricity. This process of converting light (photons) to
electricity (voltage) is called the photovoltaic (PV) effect. Solar
cells are typically combined into modules that hold about 40 cells; a
number of these modules are
mounted in PV arrays that can
measure up
to several meters on a side. These
flat -plate PV arrays can be
mounted at a fixed angle facing
south , or they can be mounted on a
tracking
device that follows the sun, allowing
them to capture the
most sunlight over the
course of a day. Several connected PV arrays
can provide enough power for a household; for large electric utility
or industrial applications, hundreds of arrays can be interconnected
to form a
single , large PV system.
Solar
Hot Water
Heating
water with solar energy. The
shallow water of a lake is
usually warmer than the
deep water. That's because the sunlight can heat the
lake
bottom in the shallow areas, which in turn, heats the water.
It's nature's way of solar water heating. The sun can be used in
basically the same way to heat water used in buildings and
swimming pools. Most
solar water heating systems for buildings have two main parts: a
solar
collector and a storage tank. The most common collector is
called a
flat-plate
collector.
Mounted on the
roof , it consists of a
thin , flat, rectangular box
with a transparent
cover that faces the sun. Small tubes run through
the box and
carry the fluid – either water or other fluid, such as
an antifreeze solution – to be heated. The tubes are attached to an
absorber plate, which is painted black to absorb the heat. As heat
builds up in the collector, it heats the fluid passing through the
tubes.
Solar
Electricity
Using
the sun's heat to produce electricity. Many power plants today use
fossil fuels as a heat source to
boil water. The steam from the
boiling water rotates a large turbine, which activates a
generator that produces electricity. However, a new generation of power plants,
with concentrating solar power systems, uses the sun as a heat
source. There are three main types of concentrating solar power
systems:
parabolic -trough,
dish/ engine ,
and
power
tower.
Parabolic-trough systems concentrate the sun's energy through long
rectangular, curved (U-shaped)
mirrors . The mirrors are tilted toward
the sun, focusing sunlight on a
pipe that runs down the
center of the
trough. This heats the oil
flowing through the pipe. The hot oil then
is used to boil water in a conventional steam generator to produce
electricity.
Passive Solar Heating and Daylighting
Using
solar energy to heat and light buildings.
Step outside on a hot and
sunny summer day, and you'll
feel the power of solar heat and light.
Today, many buildings are
designed to take advantage of this natural
resource through the use of passive solar heating and daylighting. The
south side of a
building always receives the most sunlight.
Therefore, buildings designed for passive solar heating usually have
large, south-facing
windows . Materials that absorb and
store the
sun's heat can be built into the sunlit
floors and walls. The floors
and walls will then heat up during the day and slowly
release heat at
night, when the heat is needed most. This passive solar design
feature is called
direct gain .
Development,
deployment and economicsThe
1973 oil
embargo and 1979
energy crisis caused a reorganization of energy policies around
the world and
brought renewed
attention to developing solar
technologies. Deployment strategies
focused on
incentive programs
such as the Federal Photovoltaic Utilization
Program in the US and
the Sunshine Program in
Japan . Other efforts included the
formation of research facilities in the US (
SERI , now NREL),
Japan (NEDO),
and Germany (Fraunhofer
Institute for Solar Energy Systems ISE).
Commercial
concentrating solar power (CSP) plants were
first developed in the
1980s. CSP plants such as SEGS project in
the United States have a LEC of 12–14 ¢/kWh.[139]
The 11 MW PS10 power tower in Spain,
completed in late 2005, is Europe's first commercial CSP system, and
a total capacity of 300 MW is expected to be installed in the same
area by 2013.
Solar
installations in recent years have also largely
begun to expand into
residential areas, with governments offering incentive programs to
make "green" energy a more economically viable
option . In
Canada the government offers the RESOP (Renewable Energy Standard
Offer Program). The program allows residential homeowners with solar
panel installations to sell the energy they produce back to the grid
(i.e., the government) at 41¢/kWh, while drawing power from the grid
at an average rate of 20¢/kWh . The program is designed to help
promote the government's green agenda and lower the
strain often
placed on the energy grid at peak hours. With the incentives offered
by the program the average payback
period for a residential solar
installation (sized between 1.3 kW and 5 kW) is estimated at 18 to 23
years, considering such cost factors as parts, installation and
maintenance, as well as the average energy production of a system on
an annual basis.
Photovoltaics
are 85 times as efficient as growing corn for ethanol. On a 300
feet (91 m) by 300 feet (1 hectare)
plot of land enough ethanol can be
produced to drive a car 30,000
miles (48,000 km) per year or
2,500,000 miles (4,020,000 km) by covering the same land with photo
cells. The deserts of the South Western United States could produce
sufficient electricity to fulfill all of the
electrical needs of the
United States, and could use electrolysis to produce
Hydrogen from
water to power aircraft
HydroenergyHydro
energy is simply energy that is taken from water and converted to
electricity. Hydro energy can be obtained by using many methods of
capture. The most common
method of using energy from water is a
hydroelectric dam, where water coming down through an area
causes turbines to
rotate and the energy is captured to run a generator.
Power can also be generated from the energy of
tidal forces or
wave power, which uses the energy created by waves.
Many
countries in the world use hydro energy for conversion to
electricity. Canada maintains the highest use, while the United
States
comes in second. One of the main
reasons that hydro energy is
used is that it is a renewable energy, meaning it will not be
depleted over time and it will consistently be replenished. It is
also a clean energy source, as it does not emit any toxins.
One
downside to using hydro energy is that it can sometimes change the
natural flow of the water which can make it possible to
harm plants
and
animals in the water. It can also damage areas and
wildlife , as
when creating a hydro electric dam, areas must be flooded.
Other
reasons that many want to use hydro energy is that it is cheaper than
using other methods to convert energy to electricity. It is also
reliable and can be used almost immediately when turned on to meet
the demand for electricity. Therefore, one must weigh the pros and
cons before deciding to use hydro energy to supply their demand for
electricity.
There
are many forms of water energy:
- Hydroelectric energy is a term usually reserved for large-scale hydroelectric dams. Examples are the Grand Coulee Dam in Washington State and the Akosombo Dam in Ghana .
- Micro hydro systems are hydroelectric power installations that typically produce up to 100 kW of power. They are often used in water rich areas as a Remote Area Power Supply (RAPS). There are many of these installations around the world, including several delivering around 50 kW in the Solomon Islands.
- Damless hydro systems derive kinetic energy from rivers and oceans without using a dam.
- Ocean energy describes all the technologies to harness energy from the ocean and the sea:
- Marine current power. Similar to tidal stream power, uses the kinetic energy of marine currents
- Ocean thermal energy conversion (OTEC) uses the temperature difference between the warmer surface of the ocean and the colder lower recesses. To this end, it employs a cyclic heat engine. OTEC has not been field-tested on a large scale.
- Tidal power captures energy from the tides. Two different principles for generating energy from the tides are used at the moment:
Tidal motion in the vertical direction
— Tides come in,
raise water levels in a
basin , and tides roll out.
Around low tide, the water in the basin is discharged through a
turbine, exploiting the stored potential
energy.
Tidal
motion in the horizontal direction
— Or tidal stream power.
Using tidal stream generators, like wind
turbines but then in a tidal stream. Due to the high
density of water, about
eight -hundred times the density of air, tidal
currents can have a lot of kinetic
energy. Several commercial prototypes have been build, and more
are in development.
- Wave power uses the energy in waves. Wave power machines usually take the form of floating or neutrally buoyant structures which move relative to one another or to a fixed point. Wave power has now reached commercialization.
- Osmotic power or salinity gradient power, is the energy retrieved from the difference in the salt concentration between seawater and river water. Reverse electrodialysis (PRO) is in the research and testing phase.
- Vortex power is generated by placing obstacles in rivers in order to cause the formation of vortices which can then be tapped for energy.
- Deep lake water cooling, although not technically an energy generation method, can save a lot of energy in summer. It uses submerged pipes as a heat sink for climate control systems. Lake-bottom water is a year-round local constant of about 4 °C.
Geothermal
EnergyThe
centre of the Earth is around 6000 degrees
Celsius - easily hot
enough to melt rock. Even a few kilometres down, the temperature can
be over 250 degrees Celsius.
In
general, the temperature
rises one
degree Celsius for every 36 metres
you go down.
In
volcanic areas, molten rock can be very close to the surface.
Sometimes we can use that heat.Geothermal energy has been used for
thousands of years in some countries for cooking and heating. The
name "geothermal" comes from two
Greek words: "geo"
means "Earth" and "thermal" means "heat".
Geothermal
power is cost effective, reliable, and environmentally friendly, but
has previously been geographically limited to areas near tectonic
plate boundaries. Recent technological advances have dramatically
expanded the range and
size of viable resources, especially for
direct applications such as home heating. Geothermal
wells tend to
release greenhouse gases trapped deep within the earth, but these
emissions are much lower than those of conventional fossil fuels. As
a result, this technology has the potential to help mitigate global
warming if widely deployed.
How
it works Hot
rocks
underground heat water to produce steam.
We
drill holes down to the hot
region , steam comes up, is purified and
used to drive turbines, which drive electric generators.
There
may be natural "groundwater" in the hot rocks anyway, or we
may need to drill more holes and
pump water down to them.
The
first geothermal power station was built at Landrello, in Italy, and
the second was at Wairekei in New
Zealand . Others are in
Iceland ,
Japan, the
Philippines and the United States.
In
Iceland, geothermal heat is used to heat houses as well as for
generating electricity.
If
the rocks aren't hot enough to produce steam we can sometimes still
use the energy - the Civic Centre in Southampton, England, is
partly heated this way as
part of a district heating scheme with thousands
of customers..
Advantages - Geothermal energy does not produce any pollution, and does not contribute to the greenhouse effect.
- The power stations do not take up much room , so there is not much impact on the environment.
- No fuel is needed.
- Once you've built a geothermal power station, the energy is almost free.
It may need a little energy to run a pump, but this can be taken from the energy being generated.
Disadvantages - The big problem is that there are not many places where you can build a geothermal power station.
You need hot rocks of a suitable type, at a depth where we can drill down to them.
The type of rock above is also important, it must be of a type that we can easily drill through.
- Sometimes a geothermal site may "run out of steam", perhaps for decades.
- Hazardous gases and minerals may come up from underground, and can be difficult to safely dispose of.
Biomass
EnergyBiomass
is
biological material derived from
living , or recently living
organisms. In the
context of biomass for energy this is often used to
mean plant
based material, but biomass can equally apply to
both animal and
vegetable derived material.
Biomass
is carbon based and is composed of a mixture of
organic molecules
containing hydrogen, usually including atoms of oxygen, often
nitrogen and also small quantities of other atoms, including alkali,
alkaline earth and
heavy metals. These metals are often found in
functional molecules such as the porphyrins which include chlorophyll
which contains
magnesium .
Fossil
fuels
Fossil
fuels such as coal, oil and gas are also derived from biological
material, however material that absorbed CO2
from the atmosphere many
millions of years ago.
As
fuels they offer high energy density, but
making use of that energy
involves burning the fuel, with the oxidation of the carbon to carbon
dioxide and the hydrogen to water (vapour). Unless they are captured
and stored, these combustion
products are usually
released to the
atmosphere, returning carbon sequestered millions of years ago and
thus contributing to increased atmospheric
concentrations .
The
vital difference between biomass and fossil fuels is one of time
scale.
Biomass
takes carbon out of the atmosphere while it is growing, and
returns it as it is burned. If it is
managed on a sustainable basis, biomass
is harvested as part of a constantly replenished crop. This is either
during
woodland or arboricultural
management or coppicing or as part
of a continuous
programme of replanting with the new growth taking up
CO2
from the atmosphere at the same time as it is released by combustion
of the
previous harvest.
This
maintains a closed carbon
cycle with no net increase in atmospheric
CO2
levels.
Within
this definition, biomass for energy can include a wide range of
materials.
The
realities of the economics mean that high value material for which
there is an alternative market, such as good
quality , large
timber ,
are very unlikely to become available for energy applications.
However there are huge resources of residues, co-products and
waste that
exist in the UK which could potentially become available, in
quantity, at relatively low cost, or even
negative cost where there
is currently a requirement to pay for disposal.
There
are five basic categories of material:
- Virgin wood, from forestry, arboricultural activities or from wood processing
- Energy crops: high yield crops grown specifically for energy applications
- Agricultural residues: residues from agriculture harvesting or processing
- Food waste, from food and drink manufacture, preparation and processing, and post-consumer waste
- Industrial waste and co-products from manufacturing and industrial processes.
Biomass
production for human use and consumptionThis
is a list of estimated biomass for human use and consumption. It does
not include biomass
which is not harvested or utilised. See Primary Productivity of the
Biosphere for
details Location
(million km²)
(gram dryC / m² / year)
(billion tonnes / year)
(kg dryC / m²)
(billion tonnes)
(years)
Tropical rain
forest 17.00
2,200.00
37.40
45.00
765.00
20.50
Tropical monsoon forest
7.50
1,600.00
12.00
35.00
262.50
21.88
Temperate evergreen forest
1,320.00
6.60
35.00
175.00
26.52
Temperate deciduous forest
7.00
1,200.00
8.40
30.00
210.00
25.00
Boreal forest
12.00
800.00
9.60
20.00
240.00
25.00
Mediterranean
open forest
2.80
750.00
2.10
18.00
50.40
24.00
Desert and semidesert scrub
18.00
90.00
1.62
0.70
12.60
7.78
Extreme desert, rock, sand or ice sheets
24.00
3.00
0.07
0.02
0.48
6.67
Cultivated land
14.00
650.00
9.10
1.00
14.00
1.54
Swamp and
marsh 2.00
2,000.00
4.00
15.00
30.00
7.50
Lakes and streams
2.00
250.00
0.50
0.02
0.04
0.08
Total continental149.00
774.51
115.40
12.57
1,873.42
16.23
Open ocean
332.00
125.00
41.50
0.003
1.00
0.02
Upwelling zones
0.40
500.00
0.20
0.02
0.01
0.04
Continental shelf
26.60
360.00
9.58
0.01
0.27
0.03
Algal beds and reefs
0.60
2,500.00
1.50
2.00
1.20
0.80
Estuaries and mangroves
1.40
1,500.00
2.10
1.00
1.40
0.67
Total marine361.00
152.01
54.88
0.01
3.87
0.07
Grand total510.00
333.87
170.28
3.68
1,877.29
11.02
ConclusionAs
we can see there are many types of reneable energy. In the past our
civilization did not have technologies to use them all. Thats why we
used traditional sources of energy. But now progress in science is
very huge. And since the previous century we
started using
alternative energy sources very much. There are a lot of advantages
using them . For example they are clean, they will never end because
they are renewable,
they are not
dangerous like nuclear energy.
With appropriate technologies they can be even cheaper than
traditional energy sources. For many years part of alternative energy
sources in our energy system rises, nowadays it is near 7%-8%
. It is very
tiny part, but undoubtely it will
rise even more in
future. Between them, alternative energy sources could
deliver more than twice as much electricity than the new
fleet of
nuclear reactors being debated - and the renewables would be built
more quickly. Even
then, the
full potential of these sources would not have been tapped
- much more could be harnessed in the future. But we have to start
now if we're going to end our dependence on fossil fuels and reduce
emissions. Ambitious support for renewables will bring benefits - not
just of clean, fuel-free energy, but the jobs and economic growth
that come from pioneering new industries and technology.
Sources - World Energy Assessment, 2004 update[28]
- World Energy Assessment 2001[53]
- www.wikipedia.org
- www.eia.doe.gov
- www1.eere.energy.gov
- www.renewableenergyworld.com
- www.greenenergyhelpfiles.com
- www.biomassenergycentre.org.uk
- www.therenewableenergycentre.co.uk/
- www.sciencedaily.com
- http://www.greenpeace.org.uk/climate/solutions/renewable-energy


Kõik kommentaarid