Cost Accounting . Chapter 1 Management accounting measures ,
analyzes, and reports financial and no financial information that
helps managers make
decisions to fulfill the
goals of an
organization.
Financial
accounting focuses
on reporting to
external parties
such as investors,
government agencies,
banks and suppliers. It measures and records business
transactions and provides financial statements that are
based on
GAAP.
Cost
accounting measures,
analyzes, and reports financial and no financial information relating
to cost of acquiring or using resources in an organization.
Value -chain analysis :
sequence of business functions in which customer
usefulness is added
to
products and
services . 1. Research and
development 2. Design of
products, services, or
processes 3.
Production 4.
Marketing 5.
Distribution 6. Customer
service .
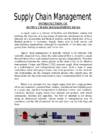
Supply chain describes
the flow of
goods , services, and information from the initial sources
of materials and services to the
delivery of products to consumers,
regardless of whether those
activities occur in the
same organization
or in
other organizations .
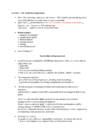
Five step decision making process :
1.
Identify the problem and uncertainties.
2.
Obtain information.
3.
Make predictions about the future.
4.
Make decisions by choosing
among alternatives.
5.
Implement the decision, evaluate
performance , and learn.
Steps 1-4
are collectively referred to as
planning .
Planning
comprises selecting organization goals, predicting
results under
various
alternative ways of achieving those goals, deciding how to
attain them. Most important planning tool is
budget ,
quantitative expression of a proposed plan of
action by management
and is an aid to coordinating what
needs to be
done to implement that
plan.
The
comparison of actual performance to budgeted performance is the
control or post decision
role of information.
Control
comprises taking
actions that implement planning decisions, deciding
how to evaluate performance, and
providing feedback and
learning to
help future decision making.
Chapter
2 - Cost terms and purposes . Direct costs of
a cost
object are
related to the
particular cost object and can be
traced to it in an economically feasible (cost-effective) way.
Cost
tracing is
used to describe the assignment of direct costs to a particular cost
object.
Indirect costs of
a cost object are related to the particular cost object but
cannot be
traced to it in an economically feasible (cost effective) way.
Cost allocation is
used to describe the assignment of indirect costs to a particular
cost object.
Cost
assignment is
a general term that encompasses
both tracing direct costs and
allocating indirect costs.
Factors
affecting direct/indirect cost classification :
Materiality
of the cost in question - the smaller the
amount of cost, the more
immaterial the cost is, the less likely that it is economically
feasible to trace the cost to a particular cost object.
Available information-
gathering technology . Design of operations.
Variable
cost changes in
total in
proportion to changes in the related level of total
activity or
volume .
Fixed cost remains
unchanged in total for a
given time
period , despite
wide changes in
the related level of total activity or volume.
Cost driver is
a variable, such as the level of activity or volume, that causally
affects costs over a given time
span .
Relevant range is
the
band of normal activity level or volume in which
there is a
specific relationship between the level of activity or volume and the
cost.
Cost
of goods sold :Beginning finished goods
inventory Cost of goods manufactured
Cost of goods available for
sale Deduct:
ending finished goods
inventory
Cost
of goods sold
Schedule
of cost of goods manufacturedDirect
materials:
Beginning inventory
Add: purchases of DM
=
Cost of DM available for use
Deduct: ending inventory
Direct
materials used
Direct
manufacturing labor Manufacturing
overhead costs
=
Manufacturing costs
incurred Add:
Beginning
work in process inventory
Total
manuf. Costs to
account for
Deduct:
ending work in process inventory
=
Cost of goods manufactured
Prime costs are
all direct manufacturing costs. Prime costs = direct
material +
direct labor.
Conversion
costs are
all manuf. Costs other
than direct material costs. Costs incurred to
convert DM into finished product. Conversion costs = DL + MOH
Overtime
premium and idle time classified as indirect labor costs.
Product
cost is
the sum of the costs assigned to a product for a specific
purpose .
Chapter
3 - Cost-Volume-Profit analysisCVP
analysis examines
the
behavior of total
revenues , total costs and
operating income as
changes occur in the
units sold, the
selling price , the variable cost
per
unit , or the fixed costs of a product.
Breakeven
point is
that quantity of output sold at which total revenues equal total
costs. Breakeven in units = Fixed costs/
contribution margin per unit.
Breakeven revenues = fixed costs/CM%.
Target operating income.
Qty of units
required to sold = (fixed costs + target op income) / CM
per unit.
Revenues
needed to
earn = Fixed costs + target op income / CM%.
Target
operating income = target net income / (1-tax
rate ). Revenues - VE -
FE = Target net income/ (1-tax rate).
Qty
of units required to be sold = FE+ (Target net income/(1- tax
rate))/CM per unit.
Sensitivity
analysis is
a what-if technique that managers use to examine how an
outcome will
change if the
original predicted data are not achieved or if an
underlying assumption changes.
Margin of safety -
the amount by which budgeted (or actual) revenues exceed breakeven
revenues. Margin of safety = Budgeted (or actual) revenues -
breakeven revenues. Margin in safety in units = Budgeted
sales in
units - breakeven sales in units. Margin of safety % = Margin of
safety in dollars/ budgeted(or actual) revenues.
Operating
leverage describes
the
effects that fixed costs have on changes in operating income as
changes occur in units sold and contribution margin. Organizations
with high proportion of fixed costs in their cost
structures have
high operating leverage. Degree of operating leverage = CM/operating
income
Sales mix
is
the quantities of various products that constitute total unit sales
of a company.
Breakeven
point in bundles = FE/ CM per bundle.
Chapter
7 - Flexible budgets, direct-cost variances, management controlVariance
is
the
difference between actual results and
expected performance.
Management
by exception is
the
practice of focusing management
attention on
areas that are not
operating as expected and devoting less time to areas operating as
expected.
Static
budget,
or master budget, is based on the level of output planned at the
start of the budget period.
Static-budget
variance is
the difference between the actual result and the corresponding
budgeted amount.
Flexible
budget calculates
budgeted revenues and budgeted costs based on the actual output in
the budget period.
Sales-volume
variance is
the difference between a flexible-budget amount ant the corresponding
static-budget amount.
Flexible-budget
variance is
the difference between an actual result and the corresponding
flexible-budget amount.
Selling
price variance =
(actual selling price-budgeted selling price)*actual units sold.
Price
variance is
the difference between actual price and budgeted price multiplied by
actual input quantity, such as direct materials
purchased or used.
(sometimes called input-price var, rate var).
Efficiency
variance is
the difference between actual input qty used and budgeted input qty
allowed for actual input, multiplied by budgeted price (also
usage var).
Price
variance =
(actual price input - budgeted price input)*actual qty of input.
Efficiency
variance =
(actual qty of input used - budgeted qty of input allowed for actual
output)*budgeted price of input.
Journal entries - page 238
Benchmarking
is the
continuous process of comparing the levels of performance in
producing products and services and
executing activities against the
best levels of performance in competing
companies or in companies
having similar process. A
standard
cost is
a carefully
determined cost used to benchmark for judging
performance. The purposes of a standard cost are to
exclude part inefficiencies and to take into account changes expected to occur in
the budget period.
Managers
use variances for control, decision implementation, performance
evaluation, organization learning and continuous improvement.
Chapter
8 - Flexible budgets, overhead cost variances, management controlStandard
costing is
a costing system that traces direct costs to output produced by
multiplying the standard prices or rates by the standard quantities
of inputs allowed for actual outputs produced and allocates overhead
costs on the
basis of the standard overhead-cost rates
times the
standard quantities of the allocation bases allowed for the actual
outputs produced. Budgeted variable overhead cost rate per output
unit = budgeted input allowed per output unit x budgeted variable
overhead cost rate per input unit.
Variable
overhead flexible-budget variance measures
the difference between actual variable overhead costs incurred and
flexible-budget variable overhead amounts.
Variable
overhead efficiency variance is
computed the same way as the efficiency variance for direct-cost
items , but the
interpretation differs. The efficiency variance for
VOH is based on the efficiency with which the cost-allocation
base is
used.
Variable
overhead spending variance is
the difference between actual variable overhead cost per unit of the
cost allocation base and budgeted VOH cost per unit of
cost-allocation base, multiplied by the actual qty of VOH cost
allocation base used for actual output.
Journal
entries for VOH cost and variances - page 267.
Fixed
overhead flexible-budget variance is
the difference between actual FOH and FOH in the flexible budget.
Flexible budget amount is the same as in static budget, because fixed
costs are unaffected by changes in the output level
within the
relevant range. There is no efficiency variance for FOH. FOH spending
variance is the same amount as the FOH flexible-budget variance.
Production
volume variance arises
only for fixed costs, denominator level variance, difference between
budgeted FOH and FOH allocated on the basis of actual output
produced.
Production
volume var =
budgeted FOH - FOH allocated for actual output units produced.
Chapter
11 - Relevant costsManagers
usually follow a decision model for choosing among
different courses
of action. A
decision
model
is a formal
method of making a
choice , and it often involves both
quantitative and
qualitative analyses. Five-step decision-making
process to make decisions (Ch1).
Relevant
costs are
expected future costs and relevant revenues are expected future
revenues that
differ among the alternative courses of action being
considered . Past costs are called
sunk
costs,
because they are unavoidable and cannot be changed no
matter what
action is taken.
Quantitative
factors are
outcomes that are measured in numerical terms,
qualitative
factors are
outcomes that are difficult to
measure accurately in numerical terms.
One-time-only Special Orders -
one type of decision that affects output levels is accepting or
rejecting special orders when there is idle production
capacity and
special orders have no long-run implications.
Make-or-Buy
decisions -
decisions whether a producer of goods or services will insource or
outsource.
Incremental cost is
the additional total cost incurred for an activity. A
differential
cost is
the difference in total cost between two alternatives.
Opportunity
cost is
the contribution to operating income that is forgone by not using a
limited
resource in its next-best alternative use. Carrying costs of
inventory - page 399.
Product-mix
decisions with capacity constraints -
decisions made by a company about which products to sell and in what
quantities.
xyContribution margin per unit
240
375
Mhs required to produce one unit
2 mhs
5 mhs
Contribution margin per MH
(240/2; 375/5)
120/mh
75/mhr
Total contribution margin for 600 Mhz (600*120; 600*75)
72000
45000
Adding or
dropping costumers or business segments/branches, relevant- revenue and relevant-cost analysis,
page 403.
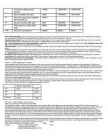
Equipment replacement decisions -
book value and depreciation of old
machine is irrelevant, loss on
disposal that is the difference between book value and disposal value
of old machine is irrelevant, relevant are
current disposal value of
old machine and cost of new machine.
Keep
Replace Difference (1-2)
Operating costs
1600000
920000
680000
Current disposal value of old machine
(
40000 )
40000
New machine
600000
(600000)
Total relevant costs
1600000
1480000
120000
Chapter
14 - cost allocation, customer-profitability analyses, sales-variance
analysisPurpose
of allocating indirect costs:
1. To
provide information for
economic decisions 2. To motivate
managers and other employees 3. To justify costs or compute
reimbursement amounts 4. To measure income and
assets .
Criteria to guide cost- allocation decisions:
1.
Cause and
effect - managers identify the variables that cause
resources to be consumed.
2.
Benefits
received - mangers identify the beneficiaries of the outputs
of the cost object. The costs of the cost object are allocated among
the beneficiaries in proportion to the benefits each receives.
3.
Fairness or equity - often cited in government contracts when cost
allocations are the basis for establishing a price satisfactory to
the government and its suppliers.
4.
Ability to
bear - allocating costs in proportion to the cost object’s
ability to bear cost allocated to it. The
presumption is that
more-profitable divisions have a
greater ability to absorb corporate
headquarters ’ costs.
Customer
profitability analysis is
the reporting and analysis of revenues earned from customers and the
costs incurred to earn those revenues. Managers use this information
to ensure that customers making large contributions to the operating
income of the company receive a high level of attention from the
company. Revenues can differ because of
differences in quantity
purchased and the price discounts given.
Customer-cost
analysis. C-c
hierarchy categorizes costs related to customers into different cost
pools on the basis of different
types of cost
drivers , or
cost-allocation bases, etc. Some costs are assigned to
individual customers, other costs to distribution
channels or to corporate wide
effects.
Sales-volume
variance can
be subdivided into the
sales-mix
variance (variance
arises because actual sales mix differs from budgeted sales mix) and
the
sales-quantity
variance (variance
arises because actual total unit sales differ from budgeted total
unit sales)
Sales-mix
variance is
the difference between budgeted contribution margin for the actual
sales mix and budgeted contribution margin for the budgeted sales
mix.
Actual units of
all product sold x
(actual sales-mix % - budgeted sales-mix %)x
Budgeted
CM per unit =
Sales-Mix variance
Wholesale
900000 units x
(0.84-0.80) x
0.49 per unit =
17640 F
retail
900000 units x
(0.16- 0.20) x
0.98 per unit =
35280 U
Total sales-mix variance
17640 U
Sales-quantity
variance is
the difference between budgeted contribution margin based on actual
units sold of all products at the budgeted mix and contribution
margin in the static budget.
(Actual units of All products sold - budgeted units of all product sold) x
Budgeted sales-mix % x
Budgeted CM per unit =
Sales-quantity variance
Wholesale
(900000 -890000) units x
0.80 x
0.49 per unit =
3920 F
Retail
(900000-890000) x
0.20 x
0.98 per unit =
1960 F
Total sales-quantity variance
5880 F
Market - share and market-size variances - page 519.Chapter
15 - allocation of support - department costs, common costs, and
revenues.Operating
department (production
dept ) directly adds value to a product or service.
Support
department (service
dept.) provides services that assist other
internal departments in
the company.
Single -rate
method makes no distinction between fixed and variable costs. It allocates costs
in each cost pool to cost objects using the same rate per unit of a
single allocation base.
Dual -rate
method partitions
the cost of each support department into two pools- a variable cost
pool and a fixed cost pool - and allocates each using different cost
allocation base. A) budgeted rate and
hours budgeted to be used by
operating divisions b) budgeted rate and actual hours used.
Allocation
based on
supply
of capacity -
the single rate and dual rate methods allocate, respectively, only
the actual fixed cost resources used or the budgeted fixed cost
resources to be used by divisions. Unused resources are highlighted
but usually not allocated to the divisions.
Allocating
costs of multiple support departments:
direct
method, step-down method, reciprocal method. Direct method allocates
each support department’s costs to operating departments only, it
does not allocate support-dept costs to other support-
depts .
Step-down
method (sequential
allocation method) allocates support-dept costs to other support
departments and to operating departments in a sequential manner that
partially recognizes the mutual service
provided among all support
depts. This method
requires support depts to be ranked.
Reciprocal
method allocates
support-dept costs to operating depts by fully recognizing the mutual
services provided among all support depts. 1) PM = 6300000+0.1IS; IS
= 1452150+0.2PM; to get the number of
complete reciprocated costs of
PM and IS. 2) allocate the
complete reciprocated cost of each support
dept to all other depts (support and operating) on the basis of the
usage %.
Common
cost is
a cost of operating a facility, activity, or like cost object that is
shared by two or more
users .
Stand - alone cost-allocation method determines
the weights for cost allocation by considering each
user of the cost
as a separate entity.
Incremental
cost-allocation method ranks
the individual users of a cost object in the
order of users most
responsible for the common cost and then uses this ranking to
allocate cost among those users.
Revenue
allocation methods:
stand
alone method, incremental method. Stand-alone revenue-allocation
method
uses product specific information on the products in the bundle as
weights for allocating the bundled revenues to the individual
products. Three types of weights: selling prices, unit costs,
physical units.
Incremental
revenue-allocation method ranks
individual products in a bundle according to criteria determined by
management - such as the product in the bundle with the most sales -
and then uses this ranking to allocate bundled revenues to individual
products.
Chapter
16 - cost allocation: joint products and byproducts.Joint
costs are
the costs of a production process that yields multiple products
simultaneously.
Split off point is
the juncture in a joint production process when two or more products
become separately identifiable.
Separable
costs are
all costs incurred
beyond split off point that are assignable to each
of the specific products identified at the split off point.
Main
product -
joint production process yields one product with a high total sales
value.
Joint
products - two
or more products with high sales value. The products of a joint
production process that have low total sales
values compared with the
total sales value of main product or of joint products are called
byproducts.
Allocating
joint costs: 1.
Using market based data: sales value at split off method, net
realizable value (NRV) method,
constant gross margin percentage NRV
method 2. Using physical measures.
Sales
value at split off method allocates
joint costs to joint products on the basis of the relative total
sales value at the split off point, costs are allocated to products
in proportion to their revenue generating
power .
Physical
measure method allocates
joint costs to joint products on the basis of a comparable physical
measure such as the relative weight, quantity, volume at the split
off point.
The NRV
method allocates
joint costs to joint products on the basis of relative NRV -
final sales value minus separable costs. The NRV method is
typically used
in preference to the sales value at split off method only when
selling prices for one or more products at split off do not
exist .
Constant
Gross margin % NRV method -
allocates joint costs to joint products in such a way that each
individual product achieves an identical gross margin %. The method
works backward in that the
overall gross margin is computed
first .
Then, for each product, this gross margin % and any separable costs
are deducted from the final sales value of production in order to
back into the joint cost allocation for that product.
Sell-or-process further decision -
decision to incur additional costs for further
processing should be
based on the incremental operating income attainable beyond the split
off point. Joint costs are irrelevant in a sell-or-process further
decision because joint costs are the same whether or not further
processing occurs.
Incremental
revenues 300000
Deduct
incremental processing costs 280000
Increase in operating income 20000
The
production method recognizes
byproducts
in the financial statements at the time production is completed. The
sales
method delays recognition of byproducts until
the time of sale. Page 585 schedules.
Production
method reports the byproduct inventory in the
balance sheet at its
selling price (4000 units-1200 units (sold))*selling price $1 per
unit = $2800. Sales method makes no journal entries for byproducts
until they are sold. Revenues of byproducts are
reported as a revenue
item in the income statement at the time of sale.
Chapter
18 - spoilage, rework, scrap.Spoilage
is units of production that do not meet the specifications required
by customers for
good units that are discarded or sold at reduced
prices.
Rework
is units of production that do no meet the specifications required by
customers but which are subsequently repaired and sold as good
finished products.
Scrap
is residual material that results from manufacturing a product. It
has low sales value compared with the total sales value of the
product.
Normal
spoilage is
spoilage
inherent in a particular production process. The costs of
normal spoilage are typically
included as a
component of the cost of
good units manufactured because good units cannot be made without
also making some units that are
spoiled . Normal spoilage rates are
computed by dividing units of normal spoilage by total good units
completed.
Abnormal
spoilage is
spoilage that is not inherent in a particular production process and
would not
arise under efficient operating
conditions . Counted
separately in Loss from Abnormal Spoilage account.
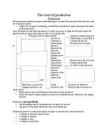
Five-Step
procedure for Process costing with spoilage:
1.
Summarize the flow of physical units.
Total
spoilage = (units in beg work in process inventory + units
started ) -
(good units completed and transferred out + units in ending WIP
inventory)
Normal
spoilage = % of good units completed. Abnormal spoilage = total
spoilage - normal spoilage.
2.
Compute output in terms of
equivalent units. Example page 644.
Step 1
(physical units)
Step 2 Equivalent units
Direct materials
Conversion Costs
Work in process ending
2000
(2000x100%; 2000x50%)
2000
1000
3.
Summarize total costs to account for - all costs debited to work in
process.
4.
Compute cost per equivalent unit.
5.
Assign total costs to units completed, to spoiled units, and to units
in ending WIP.
Weighted average method of process costing with spoilageTotal production costs
Direct materials
Conversion costs
Step 3
WIP, beginning
21000
12000
9000
Costs added in current period
165600
76500
89100
Total costs to account for
186600
88500
98100
Step 4
Cost incurred to
date 88500
9800
Divided by equivalent units of work done to date
/10000
/9000
Cost per equivalent unit
8.85
10.90
Step 5
Assignment of costs:
Good units completed and transferred out (7000 units)
Costs before adding normal spoilage
138250
(7000*8.85) +
(7000*10.90)
Normal spoilage (700 units)
13825
(700*8.85) +
(700*10.90)
(A)
Total cost of good units completed and transferred out
152075
(B)
Abnormal spoilage (300 units)
5925
(300*8.85)
(300*10.90)
C
Work in process, ending (2000 units)
28600
(2000*8.85)
(1000*10.90)
A+B+C
Total costs accounted for
186600
88500 +
98100
FIFO method and spoilage -
FIFO keeps the costs of the beginning work in process separate and
distinct from the costs of work done in the current period. All
spoilage costs are assumed to be related to units completed
during this period, using unit costs of the current period. Page 645.
Standard-costing
method -
steps 1 and 2 the same as for FIFO method, steps 3-5 cost to account
for are at standard cost,
hence , they differ from the costs to
account for under weighted-avg and FIFO methods, which are at actual
costs. Equivalent-unit cost calculation is unnecessary.
Job
costing and spoilage: normal spoilage attributable to a specific job
-
the job bears the cost of the spoilage minus the disposal value.
Normal
spoilage common to all jobs -
allocated indirectly to the job as manufacturing overhead.
Abnormal
spoilage -
net loss is charged to the Loss from Abnormal spoilage account, not
included to part of the cost of good units produced. Written of in
the accounting period.
If
rework
is normal but
occurs because of the
requirements of a specific job, the rework
costs are charged to that job. D WIP K materials K wages payable K
MOH. If rework is normal, but not attributable to a specific job (
common to all jobs), the costs of rework are charged to MOH and
spread through allocation. (D MOH K materials etc).
Abnormal
rework is
recorded by charging abnormal rework to loss account D loss from
abnormal rework K materials etc.
Recognizing
scrap at the time of its sale -
when
dollar amount is immaterial D
cash K revenue. When dollar amount
is material and is sold quickly after it is produced - scrap
attributable to a specific job. At sale: D Cash or AR K work in
process. Scrap common to all jobs D Cash K manufacturing overhead.
Recognizing
scrap at the time of its production -
if value is not immaterial and
takes time to sell, assigned an
inventory cost to scrap. Specific job: D materials K work in process.
Common to all jobs: D materials K MOH.
Chapter
21 - capital budgeting and cost analysis
Capital
budgeting analyzes each
project by considering all the lifespan cash
flows from its initial investment through its termination. Capital
budgeting is the process of making long-run planning decisions for
investments in
projects . Five stages to the capital budgeting
process: 1. Identify projects 2. Obtain information 3. Make
predictions 4 make decisions by choosing among alternatives 5.
Implement the decision, evaluate performance and learn (obtain
funding and make the investments selected in no4;
track realized cash
flows,
compare against
estimated numbers, and
revise plan if
necessary )
Discounted
cash flow methods measure all expected future cash inflows and
outflows of a project discounted back to
present period. Time value
of
money - a dollar received
today is worth more than a dollar
received at any future time. Two DCF methods are net present value
(NPV) method and internal rate-of-
return (IRR) method. Both use
required rate of return (RRR), the minimum acceptable annual rate of
return on an investment.
Net
present value (NPV) method calculates the expected monetary
gain or
loss from a project by discounting all expected future cash inflows
and outflows back to present point in time using the required rate of
return.
Internal
rate of return (IRR) method calculates the discount rate at which an
investment’s present value of all expected cash inflows equals the
present value of its expected cash outflows. IRR is the discount rate
that makes NPV = 0. When cash inflows are constant: IRR = initial
investment/cash inflow per
year .
If
the
factor falls between the factors, use
straight -line
interpolation. Page 753.
Present value factors
18%
3.127
3.127
IRR
3.019
20%
2.991
Difference
0.136
0.108
IRR
= 18% + 0.108+0.136(2%) = 19.6% per year
Project
is accepted only if IRR equals or exceeds RRR.
NPV
advantage : in dollars, so NPVs of individual projects can be summed.
IRRs of individual projects cannot be added or averaged. NPV of a
project can always be computed and expressed as a unique number,
under IRR it is possible that more than one IRR may exist for a given
project, especially when signs of cash flows switch over time. NPV
can be used when the RRR varies over the life of a project, not
possible to use IRR method. IRR method can be
prone to indication
erroneous decisions.
Payback
method measures the time it will take to recoup, in the form of
expected future cash flows, the net initial investment in a project.
Uniform cash flows - payback period = net initial investment/ uniform
increase in annual future cash lows. Payback method highlights
liquidity. Managers prefer projects with shorter payback periods if
all other things are equal. Weaknesses: fails to explicitly
incorporate the time value of money, does not
consider a project’s
cash flows after the payback period. Nonuniform cash flows - cash
flows over successive
years are accumulated until the amount of net
initial investment is recovered. Payback period = 2 years +
(40000/80000 x 1 year) = 2,5 years.
Accrual accounting rate of return (AARR) method divides the average annual
(accrual accounting) income of a project by a measure of the
investment in it. AARR= increase in expected average annual after-tax
operating income / net initial investment. (( total cash inflow over
5 years/ 5 years - annual depreciation)/net initial investment.
After-tax
flows: operating cash inflows from investment in machine 120000
PAGE
746 Deduct income tax cash outflow at 40% 48000
schedule After-tax cash flow from operations 72000
(
excluding
depreciation effect)Additional
depreciation
deduction , 70000.
Income
tax cash savings from additional
depr . At 40% 28000
Cash
flow from operation, net of income taxes
100000 Net
initial investment: a) cash outflow to
purchase the machine b) cash
outflow for
working capital c) after-tax cash inflow from current
disposal of the old machine.
Tax
consequences of disposing of the old machine:
Current
disposal value of old machine 6500
Deduct
current book value of old machine 40000
Loss
on disposal of machine (33500)
Current
disposal value of old machine 6500
Tax
savings on loss (0.40*33500) 13400
After
tax cash inflow from current disposal of old machine 19900
Terminal disposal of investment - after tax cash flow from terminal disposal
of machines. Similar to computing after-tax inflow from disposal of
old machine.
Chapter
22 - management control systems, transfer pricing and multinational
considerations.
Management
control system is a means of gathering and using information to aid
and coordinate the planning and control decisions
throughout an
organization and to guide the behavior of its managers and other
employees.


Kõik kommentaarid