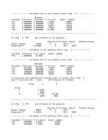
SPSS /PC+
The Statistical Package for IBM PC 6/12/ 2
set
/beep off.
GET
/FILE 'tud.sys'.
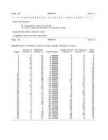
The
SPSS/PC+ system file is read from
file
tud.sys
The
file was created on 2/21/10 at 11:40:26
and
is titled SPSS/PC+ System File Written by Data
Entry II
The
SPSS/PC+ system file contains
247
cases , each consisting of
44
variables (
including system variables).
44
variables will be used in this session.
-------------------------------------------------------------------------------
Page 2 SPSS/PC+ 6/12/ 2
This
procedure was completed at 10:26:32
*
more on - iga lehekylje ja"rel tehakse
paus ,
suvaline klahvivajutus viib edasi
*
more off - pausi ei tehta, ko~ik ka"sud ja"rjest.
SET
MORE OFF.
SET
LENGTH 500.
*----------------------------------
*
iga
tudengi oma va"ljavo~tu tingimused.
*
Tingimuses olevaid tunnuseid ei tohi analyysis kasutada.
SELECT IF (T614=1 AND T713=1).
*----------------------------------
*
Yhe tunnuse analyys (harj5).
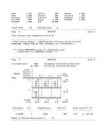
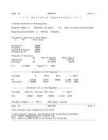
FREQUENCIES
/VARIABLES T615 /HBAR /STATISTICS ALL.
The
raw data or transformation
pass is proceeding
33
cases are written to the uncompressed active file.
*****
Memory allows a
total of 15222
Values , accumulated across all
Variables.
There also may be up to 1903
Value Labels for each Variable.
-------------------------------------------------------------------------------
Page 3 SPSS/PC+ 6/12/ 2
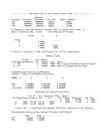
T615 Tingimused soodustaksid head
tood Valid Cum
Value
Label Value Frequency
Percent Percent Percent
1 28 84.8 84.8 84.8
2 5 15.2 15.2 100.0
------- ------- -------
TOTAL 33 100.0 100.0
1
ÜÜÜÜÜÜÜÜÜÜÜÜÜÜÜÜÜÜÜÜÜÜÜÜÜÜÜÜÜÜÜÜÜÜÜÜÜÜÜÜÜÜÜÜÜÜÜÜ
28
2
ÜÜÜÜÜÜÜÜÜ 5
I
I.........I.........I.........I.........I.........I
0 6 12 18 24 30
Mean 1.152 Std Err .063 Median 1.000
Mode 1.000 Std Dev .364 Variance .133
Kurtosis 2.287 S E Kurt .798
Skewness 2.038
S
E Skew .409 Range 1.000 Minimum 1.000
Maximum 2.000 Sum 38.000
Valid
Cases 33
Missing Cases 0
-------------------------------------------------------------------------------
Page 4 SPSS/PC+ 6/12/ 2
This
procedure was completed at 10:26:32
*----------------------------------
*
Kahe tunnuse analyys - sagedusjaotuse risttabel (harj6 ja harj7).
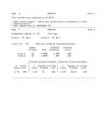
CROSSTABS
/TABLES T615 BY T616 /OPTIONS 3 4 5 /STATISTICS 1.
*****
Given WORKSPACE allows for 11163 Cells with
2
Dimensions for CROSSTAB problem *****
-------------------------------------------------------------------------------
Page 5 SPSS/PC+ 6/12/ 2
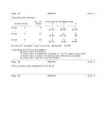
Crosstabulation: T615 Tingimused soodustaksid head tood
By
T616 Ma oleksin ettevotte aktsionar
Count ³
Row
Pct ³
T616Ä> Col Pct ³ ³ Row
Tot
Pct ³ 1 ³ 2 ³ 5 ³ Total
T615 ÄÄÄÄÄÄÄÄÅÄÄÄÄÄÄÄÄÅÄÄÄÄÄÄÄÄÅÄÄÄÄÄÄÄÄÅ
1 ³ 10 ³ 6 ³ 2 ³ 18
³ 55.6 ³ 33.3 ³ 11.1 ³ 85.7
³ 76.9 ³ 100.0 ³ 100.0 ³
³ 47.6 ³ 28.6 ³ 9.5 ³
ÅÄÄÄÄÄÄÄÄÅÄÄÄÄÄÄÄÄÅÄÄÄÄÄÄÄÄÅ
2 ³ 3 ³ ³ ³ 3
³
100.0 ³ ³ ³ 14.3
³ 23.1 ³ ³ ³
³ 14.3 ³ ³ ³
ÅÄÄÄÄÄÄÄÄÅÄÄÄÄÄÄÄÄÅÄÄÄÄÄÄÄÄÅ
Column 13 6 2 21
Total 61.9 28.6 9.5 100.0
Chi-
Square D.F. Significance Min E.F. Cells with E.F. ---------- ---- ------------ -------- ------------------
2.15385 2 .3406 .286 4 OF 6 ( 66.7%)
Number
of Missing Observations = 12
-------------------------------------------------------------------------------
Page 6 SPSS/PC+ 6/12/ 2
This
procedure was completed at 10:26:32
*
Kahe tunnuse analyys - kahe grupi varieeruvuste ja keskmiste
vo~rdlus.
*
(harj6 ja harj7).
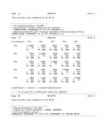
T-TEST
/GROUPS T8(1,2) /VARIABLES T75.
-------------------------------------------------------------------------------
Page 7 SPSS/PC+ 6/12/ 2
Independent
samples of T8 Teie sugu
Group
1: T8 EQ 1 Group 2: T8 EQ 2
t-test
for: T75 Minu too vastab mu kvalifikatsioonile
Number Standard Standard
of
Cases Mean Deviation
Error Group
1 18 2.0556 1.056 .249
Group
2 15 1.6000 .632 .163
³
Pooled Variance Estimate ³ Separate Variance Estimate
³ ³
F 2-
Tail ³ t Degrees of 2-Tail ³ t Degrees of 2-Tail
Value
Prob . ³ Value
Freedom Prob. ³ Value Freedom Prob.
³ ³
2.79 .059 ³ 1.46 31 .153 ³ 1.53 28.40 .137
-------------------------------------------------------------------------------
Page 8 SPSS/PC+ 6/12/ 2
This
procedure was completed at 10:26:32
*----------------------------------
*
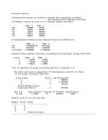
Korrelatsioonanalyys (harj9b).
*
soovitavalt 5 korda 5 tabel see on 5 tunnust.
*
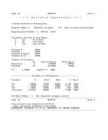
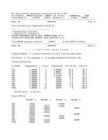
CORRELATIONS /VARIABLES T71 TO T75 /OPTIONS 3 5.
*
Sama kui puuduvate vaa""rtustega objektid ja"tta
paarikaupa va"lja.
CORRELATIONS
/VARIABLES T71 TO T75 /OPTIONS 2 3 5.
-------------------------------------------------------------------------------
Page 9 SPSS/PC+ 6/12/ 2
Correlations: T71 T72 T73 T74 T75
T71 1.0000 .5954 .5991 .3497 .
4854 ( 0) ( 33) ( 33) ( 33) ( 33)
P=
. P= .000 P= .000 P= .046 P= .004
T72 .5954 1.0000 .6408 .5567 .7229
( 33) ( 0) ( 33) ( 33) ( 33)
P=
.000 P= . P= .000 P= .001 P= .000
T73 .5991 .6408 1.0000 .4032 .4461
( 33) ( 33) ( 0) ( 33) ( 33)
P=
.000 P= .000 P= . P= .020 P= .009
T74 .3497 .5567 .4032 1.0000 .5474
( 33) ( 33) ( 33) ( 0) ( 33)
P=
.046 P= .001 P= .020 P= . P= .001
T75 .4854 .7229 .4461 .5474 1.0000
( 33) ( 33) ( 33) ( 33) ( 0)
P=
.004 P= .000 P= .009 P= .001 P= .
(Coefficient
/ (Cases) / 2-
tailed Significance)
"
. " is
printed if a coefficient
cannot be computed
-------------------------------------------------------------------------------
Page 10 SPSS/PC+ 6/12/ 2
This
procedure was completed at 10:26:32
*----------------------------------
*
Regressioonanalyys (harj9b).
*
valida yks kahest meetodist - ENTER, STEPWISE.
*
3-5 so~ltumatut tunnust.
REGRESSION /VARIABLES T71 T9 TO T11 /
DEPENDENT T71 /
METHOD ENTER.
-------------------------------------------------------------------------------
Page 11 SPSS/PC+ 6/12/ 2
*
* * * M U L T I P L E R E G R E S S I O N * * * *
Listwise
Deletion of Missing Data
Equation
Number 1 Dependent Variable.. T71 Minu too paneb mind motlema
Beginning
Block Number 1. Method: Enter
Variable(s)
Entered on
Step Number
1.. T11 Te tootate
2.. T9 Teie vanus
3.. T10 Teie
haridus Multiple
R .49591
R
Square .24593
Adjusted
R Square .16792
Standard
Error .79395
Analysis of Variance
DF Sum of Squares Mean Square
Regression 3 5.96197 1.98732
Residual 29 18.28046 .63036
F
= 3.15268 Signif F = .0398
------------------
Variables in the Equation ------------------
Variable B SE B
Beta T Sig T
T11 -.30526 .17483 -.33682 -1.746 .0914
T9 -.33646 .14191 -.39988 -2.371 .0246
T10 -.13837 .15698 -.17625 -.881 .3853
(
Constant ) 3.67551 .66999 5.486 .0000
End
Block Number 1 All
requested variables entered.
-------------------------------------------------------------------------------
Page 12 SPSS/PC+ 6/12/ 2
This
procedure was completed at 10:26:32
*
Sama, aga mudeli automaatne formeerimine.
REGRESSION
/VARIABLES T71 T9 T11 /DEPENDENT T71 /METHOD STEPWISE.
-------------------------------------------------------------------------------
Page 13 SPSS/PC+ 6/12/ 2
*
* * * M U L T I P L E R E G R E S S I O N * * * *
Listwise
Deletion of Missing Data
Equation
Number 1 Dependent Variable.. T71 Minu too paneb mind motlema
Beginning
Block Number 1. Method: Stepwise
Variable(s)
Entered on Step Number
1.. T9 Teie vanus
Multiple
R .40808
R
Square .16653
Adjusted
R Square .13964
Standard
Error .80733
Analysis
of Variance
DF Sum of Squares Mean Square
Regression 1 4.03711 4.03711
Residual 31 20.20531 .65178
F
= 6.19394 Signif F = .0184
------------------
Variables in the Equation ------------------
Variable B SE B Beta T Sig T
T9 -.34336 .13797 -.40808 -2.489 .0184
(Constant) 2.82655 .41737 6.772 .0000
-------------
Variables not in the Equation -------------
Variable Beta In Partial Min
Toler T Sig T
T11 -.24531 -.26650 .98369 -1.514 .1404
End
Block Number 1 PIN = .050
Limits reached.
-------------------------------------------------------------------------------
Page 14 SPSS/PC+ 6/12/ 2
This
procedure was completed at 10:26:32
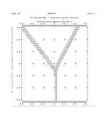
*
Kahe tunnuse vahelise
regressioonisirge graafiline kujutamine.
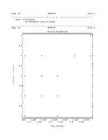
PLOT /
FORMAT REGRESSION/PLOT T9 WITH T10.
PLOT
requires 15088
BYTES of workspace for execution.
-------------------------------------------------------------------------------
Page 15 SPSS/PC+ 6/12/ 2
*
* * * * * * * * * * * * * * * P L O T * * * * * * * * * * * * *
* * *
Data Information
33
unweighted cases accepted.
-------------------------------------------------------------------------------
Page 16 SPSS/PC+ 6/12/ 2
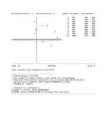
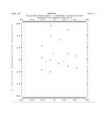
PLOT
OF T9 WITH T10
ÚÄÁÄÄÄÄÁÄÄÄÄÁÄÄÄÄÁÄÄÄÄÁÄÄÄÄÁÄÄÄÄÁÄÄÄÄÁÄÄÄÄÁÄÄÄÄÁÄÄÄÄÁÄÄÄÄÁÄÄÄÄÁÄÄÄ¿
5´ 1 Ã
³ ³
³ ³
³ ³
³ ³
4.5´ Ã
³ ³
³ ³
³ ³
³ ³
4´
2 4 2 1 Ã
³ ³
³ ³
³ ³
³ R
T 3.5´ Ã
e ³ ³
i ³ ³
e ³ ³
³ ³
v 3´ 1 6 3 Ã
a ³ ³
n ³ ³
u ³ ³
s ³ ³
2.5R Ã
³ ³
³ ³
³ ³
³ ³
2´
4 2 4 Ã
³ ³
³ ³
³ ³
³ ³
1.5´ Ã
³ ³
³ ³
³ ³
³ ³
1´
1 2 Ã
ÀÄÂÄÄÄÄÂÄÄÄÄÂÄÄÄÄÂÄÄÄÄÂÄÄÄÄÂÄÄÄÄÂÄÄÄÄÂÄÄÄÄÂÄÄÄÄÂÄÄÄÄÂÄÄÄÄÂÄÄÄÄÂÄÄÄÙ
.975 1.625 2.275 2.925 3.575 4.225 4.875
1.3 1.95 2.6 3.25 3.9 4.55
Teie
haridus
33
cases plotted. Regression statistics of T9 on T10:
Correlation .29065 R Squared .08448 S.E. of Est 1.00563 Sig. .1008
Intercept(S.E.) 2.21572( .41307)
Slope (S.E.) .27119( .16035)
-------------------------------------------------------------------------------
Page 17 SPSS/PC+ 6/12/ 2
This
procedure was completed at 10:26:32
*----------------------------------
*
Faktoranalyys (harj10).
*
Tunnuste arv va"
hemalt 8.
FACTOR /VARIABLES T61 TO T610 /FORMAT
BLANK (0.3)
/EXTRACTION
/
ROTATION VARIMAX /PLOT ROTATION (1,2).
This
FACTOR analysis requires 13448 ( 13.1K) BYTES of memory.
-------------------------------------------------------------------------------
Page 18 SPSS/PC+ 6/12/ 2
-
- - - F A C T O R A N A L Y S I S - - - -
Analysis
Number 1 Listwise deletion of cases with missing values
Extraction 1 for Analysis 1, Principal-
Components Analysis (PC)
Initial
Statistics:
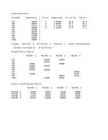
Variable Communality * Factor Eigenvalue Pct of Var Cum Pct
T61 1.
00000 * 1 3.64369 36.4 36.4
T62 1.00000 * 2 1.66802 16.7 53.1
T63 1.00000 * 3 1.27724 12.8 65.9
T64 1.00000 * 4 1.12206 11.2 77.1
T65 1.00000 * 5 .78911 7.9 85.0
T66 1.00000 * 6 .71698 7.2 92.2
T67 1.00000 * 7 .31045 3.1 95.3
T68 1.00000 * 8 .22660 2.3 97.5
T69 1.00000 * 9 .16205 1.6 99.2
T610 1.00000 * 10 .08378 .8 100.0
PC
Extracted 4 factors.
Factor
Matrix :
FACTOR 1 FACTOR 2 FACTOR 3 FACTOR 4
T61 .75023 -.42832
T62 .42235 .41577 -.51340
T63 .44031 -.60820 .41675
T64 .80148 -.40133
T65 .65608 -.62841
T66 .69250 -.41268
T67 .47742 .56496 .49227
T68 .54031 .62806
T69 .53763 .31176 .63040
T610 .58933 .32376
Final Statistics:
Variable Communality * Factor Eigenvalue Pct of Var Cum Pct
T61 .83845 * 1 3.64369 36.4 36.4
T62 .69810 * 2 1.66802 16.7 53.1
T63 .73771 * 3 1.27724 12.8 65.9
T64 .83880 * 4 1.12206 11.2 77.1
T65 .87396 *
T66 .68739 *
T67 .85438 *
T68 .71686 *
T69 .86941 *
T610 .59595 *
Varimax Rotation 1, Extraction 1, Analysis 1 - Kaiser Normalization.
Varimax
converged in 8 iterations.
Rotated
Factor Matrix:
FACTOR 1 FACTOR 2 FACTOR 3 FACTOR 4
T61 .61545 .61864
T62 .82703
T63 .70565 .38588
T64 .82982 .30255
T65 .92030
T66 .46415 .63656
T67 .87549
T68 .30408 .77367
T69 .85822 .35112
T610 .43980 .62352
Factor
Transformation Matrix:
FACTOR 1 FACTOR 2 FACTOR 3 FACTOR 4
FACTOR 1 .62645 .48357 .47128 .38938
FACTOR 2 -.77151 .39153 .28018 .41590
FACTOR 3 .06175 -.65491 -.03182 .75250
FACTOR 4 -.09227 -.42890 .83569 -.33037
Horizontal
Factor 1
Vertical Factor 2
Symbol Variable Coordinates
³ 1 T61 .276 .615
³ 2 T62 -.061 .827
2
³ 3 T63 .706 -.194
³ 4 T64 .830 .303
³ 1 6 5 T65 .920 .075
³ 6 T66 .464 .637
10 7 T67 -.083 .239
³ 4 8 T68 .304 -.049
7
³ 9 T69 .056 -.080
³ 10 T610 .077 .440
³ 5
ÄÄÄÄÄÄÄÄÄÄÄÄÄÄÄÄÄÄÄÄÄÄÄÅÄÄÄÄÄÄÄÄÄÄÄÄÄÄÄÄÄÄÄÄÄÄÄ
9 8
³ 3
³
-------------------------------------------------------------------------------
Page 19 SPSS/PC+ 6/12/ 2
This
procedure was completed at 10:26:32
*
--------------------------------------
*
Klasteranalyys (harj10)
*
Kui valimis on palju objekte, siis tuleb suur dendrogramm.
*
Võib enne teha ajutise väljavõtte nii, et järgi jääb 10-20
objekti.
*
Va"ljavo~tte tingimust saab vaadata FREQUENCY ka"
suga .
*
PROCESS IF (T10=2).
*
Tunnuste arv va"hemalt 2.
CLUSTER T1 TO T611 /PLOT DENDROGRAM.
CLUSTER
requires 6496 BYTES of workspace for execution.
-------------------------------------------------------------------------------
Page 20 SPSS/PC+ 6/12/ 2
*
* * * * H I E R A R C H I C A L C L U S T E R A N A L Y S I S * *
* * *
Data
Information
33
unweighted cases accepted.
0
cases rejected because of missing value.
Squared
Euclidean measure used.
1
Agglomeration method specified.
-------------------------------------------------------------------------------
Page 21 SPSS/PC+ 6/12/ 2
Agglomeration
Schedule using Average
Linkage (
Between Groups)
Clusters Combined Stage Cluster 1st
Appears Next
Stage Cluster 1 Cluster 2 Coefficient Cluster 1 Cluster 2 Stage
1 5 21 1.000000 0 0 4
2 31 33 2.000000 0 0 5
3 11 20 4.000000 0 0 6
4 5 19 4.500000 1 0 6
5 30 31 5.000000 0 2 13
6 5 11 5.666667 4 3 8
7 16 18 7.000000 0 0 10
8 5 14 7.600000 6 0 11
9 4 10 8.000000 0 0 18
10 12 16 8.500000 0 7 13
11 5 17 8.666667 8 0 14
12 3 28 10.000000 0 0 15
13 12 30 10.666667 10 5 14
14 5 12 11.476191 11 13 17
15 2 3 15.000000 0 12 19
16 27 32 16.000000 0 0 20
17 5 15 17.153847 14 0 18
18 4 5 19.214285 9 17 21
19 1 2 20.333334 0 15 24
20 26 27 22.000000 0 16 25
21 4 9 22.687500 18 0 23
22 7 24 23.000000 0 0 26
23 4 8 25.117647 21 0 26
24 1 29 25.750000 19 0 25
25 1 26 29.933332 24 20 27
26 4 7 30.722221 23 22 27
27 1 4 32.224998 25 26 28
28 1 6 37.607143 27 0 30
29 13 25 43.000000 0 0 30
30 1 13 49.741379 28 29 31
31 1 23 55.225807 30 0 32
32 1 22 64.187500 31 0 0
-------------------------------------------------------------------------------
Page 22 SPSS/PC+ 6/12/ 2
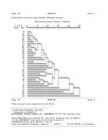
Dendrogram
using Average Linkage (Between Groups)
Rescaled
Distance Cluster Combine
C
A S E 0 5 10 15 20 25
Label Seq ÅÄÄÄÄÄÄÄÄÄÅÄÄÄÄÄÄÄÄÄÅÄÄÄÄÄÄÄÄÄÅÄÄÄÄÄÄÄÄÄÅÄÄÄÄÄÄÄÄÄÅ
5 ÄÂÄ¿
21 ÄÙ ³
19 ÄÄÄÁÄ¿
11 ÄÄÄ´ ÃÄ¿
20 ÄÄÄÙ ³ ÃÄ¿
14 ÄÄÄÄÄÙ ³ ³
17 ÄÄÄÄÄÄÄÙ ÃÄÄÄ¿
31 ÄÂÄ¿ ³ ³
33 ÄÙ ÃÄÄÄ¿ ³ ³
30 ÄÄÄÙ ÃÄÙ ÃÄ¿
16 ÄÄÄÄÄ¿ ³ ³ ³
18 ÄÄÄÄÄÁÄÙ ³ ÃÄ¿
12 ÄÄÄÄÄÙ ³ ³ ³
15 ÄÄÄÄÄÄÄÄÄÄÄÄÄÙ ³ ÃÄ¿
4 ÄÄÄÄÄÂÄÄÄÄÄÄÄÄÄÙ ³ ³
10 ÄÄÄÄÄÙ ³ ÃÄÄÄ¿
9 ÄÄÄÄÄÄÄÄÄÄÄÄÄÄÄÄÄÙ ³ ÃÄ¿
8 ÄÄÄÄÄÄÄÄÄÄÄÄÄÄÄÄÄÄÄÙ ³ ³
7 ÄÄÄÄÄÄÄÄÄÄÄÄÄÄÄÄÄÂÄÄÄÄÄÙ ³
24 ÄÄÄÄÄÄÄÄÄÄÄÄÄÄÄÄÄÙ ÃÄÄÄ¿
27 ÄÄÄÄÄÄÄÄÄÄÄÂÄÄÄÄÄ¿ ³ ³
32 ÄÄÄÄÄÄÄÄÄÄÄÙ ÃÄÄÄÄÄ¿ ³ ³
26 ÄÄÄÄÄÄÄÄÄÄÄÄÄÄÄÄÄÙ ³ ³ ³
3 ÄÄÄÄÄÄÄÂÄÄÄ¿ ÃÄÙ ÃÄÄÄÄÄÄÄÄÄ¿
28 ÄÄÄÄÄÄÄÙ ÃÄÄÄ¿ ³ ³ ³
2 ÄÄÄÄÄÄÄÄÄÄÄÙ ÃÄÄÄ¿ ³ ³ ³
1 ÄÄÄÄÄÄÄÄÄÄÄÄÄÄÄÙ ÃÄÄÄÙ ³ ÃÄÄÄ¿
29 ÄÄÄÄÄÄÄÄÄÄÄÄÄÄÄÄÄÄÄÙ ³ ³ ³
6 ÄÄÄÄÄÄÄÄÄÄÄÄÄÄÄÄÄÄÄÄÄÄÄÄÄÄÄÄÄÙ ³ ÃÄÄÄÄÄ¿
13 ÄÄÄÄÄÄÄÄÄÄÄÄÄÄÄÄÄÄÄÄÄÄÄÄÄÄÄÄÄÄÄÄÄÂÄÄÄÄÄÙ ³ ³
25 ÄÄÄÄÄÄÄÄÄÄÄÄÄÄÄÄÄÄÄÄÄÄÄÄÄÄÄÄÄÄÄÄÄÙ ³ ³
23 ÄÄÄÄÄÄÄÄÄÄÄÄÄÄÄÄÄÄÄÄÄÄÄÄÄÄÄÄÄÄÄÄÄÄÄÄÄÄÄÄÄÄÄÙ ³
22 ÄÄÄÄÄÄÄÄÄÄÄÄÄÄÄÄÄÄÄÄÄÄÄÄÄÄÄÄÄÄÄÄÄÄÄÄÄÄÄÄÄÄÄÄÄÄÄÄÄÙ
-------------------------------------------------------------------------------
Page 23 SPSS/PC+ 6/12/ 2
This
procedure was completed at 10:26:32
*----------------------------------
*
Diskriminantanalyys (harj11).
*
Tunnuseid va"hemalt 5.
DSCRIMINANT
GROUPS FIRMA(1,3) /VARIABLES T72 TO T76 /method wilks
Since ANALYSIS= was omitted for the
first analysis all variables
on
the VARIABLES= list will be entered at level 1.
/STATISTICS
5 10 13 14 15 16 1 7 11 12.
This
Discriminant Analysis requires 12476 ( 12.2K) BYTES of
workspace.
-------------------------------------------------------------------------------
Page 24 SPSS/PC+ 6/12/ 2
-
- - - - - - - D I S C R I M I N A N T A N A L Y S I S - - - - -
- - -
On
groups defined by FIRMA
33
(unweighted) cases were processed.
0
of
these were excluded from the analysis.
33
(unweighted) cases will be used in the analysis.
Number
of Cases by Group
Number
of Cases
FIRMA Unweighted Weighted Label
1 9 9.0
2 12 12.0
3 12 12.0
Total 33 33.0
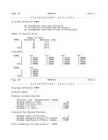
Group
Means FIRMA T72 T73 T74 T75
1 2.22222 2.55556 2.22222 1.88889
2 1.
50000 1.75000 1.75000 1.66667
3 2.33333 2.25000 1.83333 2.00000
Total 2.00000 2.15152 1.90909 1.84848
FIRMA T76
1 2.33333
2 1.50000
3 3.50000
Total 2.45455
-------------------------------------------------------------------------------
Page 25 SPSS/PC+ 6/12/ 2
-
- - - - - - - D I S C R I M I N A N T A N A L Y S I S - - - - -
- - -
On
groups defined by FIRMA
Analysis
number 1
Stepwise
variable
selection Selection
rule : Minimize Wilks'
Lambda Maximum
number of steps.................. 10
Minimum
Tolerance Level.................. .00100
Minimum
F to enter....................... 1.0000
Maximum
F to remove...................... 1.0000
Canonical
Discriminant
Functions Maximum
number of functions.............. 2
Minimum
cumulative percent of variance... 100.00
Maximum
significance of Wilks' Lambda.... 1.0000
Prior
probability for each group is .33333
----------------
Variables not in the analysis after step 0 ----------------
Minimum
Variable Tolerance Tolerance F to enter Wilks' Lambda
T72 1.0000000 1.0000000 1.9254 .88624
T73 1.0000000 1.0000000 1.
6137 .90287
T74 1.0000000 1.0000000 .63876 .95916
T75 1.0000000 1.0000000 .40316 .97383
T76 1.0000000 1.0000000 8.2438 .64533
*
* * * * * * * * * * * * * * * * * * * * * * * * * * * * * * * * * * *
* * * *
At
step 1, T76 was
included in the analysis.
Degrees
of Freedom Signif. Between Groups
Wilks'
Lambda .64533 1 2 30.0
Equivalent
F 8.24380 2 30.0 .0014
----------------
Variables in the analysis after step 1 ----------------
Variable Tolerance F to remove Wilks' Lambda
T76 1.0000000 8.2438
----------------
Variables not in the analysis after step 1 ----------------
Minimum
Variable Tolerance Tolerance F to enter Wilks' Lambda
T72 .9671642 .9671642 .70943 .61523
T73 .9394968 .9394968 1.0937 .60007
T74 .9398295 .9398295 .91216 .60714
T75 .9975296 .9975296 .38351 .62870
F
statistics and significances between
pairs of groups after step 1
Each
F statistic has 1 and 30.0 degrees of freedom.
Group 1 2
Group
2 2.
4351 .1291
3 4.7727 16.364
.0369 .0003
*
* * * * * * * * * * * * * * * * * * * * * * * * * * * * * * * * * * *
* * * *
At
step 2, T73 was included in the analysis.
Degrees
of Freedom Signif. Between Groups
Wilks'
Lambda .60007 2 2 30.0
Equivalent
F 4.21833 4 58.0 .0046
----------------
Variables in the analysis after step 2 ----------------
Variable Tolerance F to remove Wilks' Lambda
T73 .9394968 1.0937 .64533
T76 .9394968 7.3168 .90287
----------------
Variables not in the analysis after step 2 ----------------
Minimum
Variable Tolerance Tolerance F to enter Wilks' Lambda
T72 .6234076 .6055740 .48142 .58012
T74 .8345832 .8342878 .50733 .57909
T75 .7854164 .7397236 .53801 .57786
F
statistics and significances between pairs of groups after step 2
Each
F statistic has 2 and 29.0 degrees of freedom.
Group 1 2
Group
2 2.1360
.1363
3 3.0487 7.9253
.0628 .0018
F
level or tolerance or VIN insufficient for
further computation.
Summary
Table
Action Vars Wilks'
Step
Entered Removed In Lambda Sig. Label
1 T76 1 .64533 .0014 Meie orgis edutatakse haid
tootajaid
2 T73 2 .60007 .0046 Saan ise
planeerida oma tood
Classification Function Coefficients (
Fisher 's
Linear Discriminant Functions)
FIRMA = 1 2 3
T73 2.010843 1.397240 1.471168
T76 1.164367 .7263430 2.074298
(constant) -5.026450 -2.865955 -6.383697
Canonical
Discriminant Functions
Pct
of Cum Canonical After Wilks'
Fcn
Eigenvalue Variance Pct Corr Fcn Lambda Chisquare DF Sig
: 0 .6001 15.066 4 .0046
1* .5497 87.94 87.94 .5956 : 1 .9299 2.143 1 .
1432 2* .0754 12.06 100.00 .2647 :
*
marks the 2 canonical discriminant functions remaining in the
analysis.
Standardized
Canonical Discriminant Function Coefficients
FUNC 1 FUNC 2
T73 .01564 1.03158
T76 .99604 -.26890
Structure
Matrix:
Pooled-within-groups
correlations between discriminating variables
and
canonical discriminant functions
(Variables
ordered by size of correlation within function)
FUNC 1 FUNC 2
T76 .99989* -.01516
T73 .26064 .96544*
T72 .19007 .58349*
T75 -.04271 .46126*
T74 .25019 .32066*
Unstandardized
Canonical Discriminant Function Coefficients
FUNC 1 FUNC 2
T73 .1497683E-01 .9877378
T76 .8224510 -.2220389
(constant) -2.050966 -1.580128
Canonical
Discriminant Functions evaluated at Group Means (Group Centroids)
Group FUNC 1 FUNC 2
1 -.09364 .42600
2 -.79108 -.18465
3 .86131 -.13485
Test
of equality of group covariance matrices using Box's M
The
ranks and natural logarithms of determinants printed are those
of
the group covariance matrices.
Group
Label
Rank Log
Determinant 1 2 .890973
2 2 -1.428495
3 2 .307120
Pooled
Within-Groups
Covariance
Matrix 2 .407438
Box's
M Approximate F Degrees of freedom Significance
17.430 2.6169 6, 13459.4 .0155
Symbols
used in territorial map
Symbol Group Label
------ ----- --------------------
1 1
2 2
3 3
* Group Centroids
-------------------------------------------------------------------------------
Page 26 SPSS/PC+ 6/12/ 2
Territorial
Map * indicates a group centroid
Canonical
Discriminant Function 1
-3.0 -2.0 -1.0 .0 1.0 2.0 3.0
ÅÄÄÄÄÄÄÄÄÄÅÄÄÄÄÄÄÄÄÄÅÄÄÄÄÄÄÄÄÄÅÄÄÄÄÄÄÄÄÄÅÄÄÄÄÄÄÄÄÄÅÄÄÄÄÄÄÄÄÄÅ
C 3.0 Å211 1133 Å
a ³22111 1133 ³
n ³ 22211 1133 ³
o ³ 2211 1133 ³
n ³ 22111 1133 ³
i ³ 22211 1133 ³
c 2.0 Å 22111 Å Å Å 1133 Å Å
a ³ 22211 1133 ³
l ³ 22111 1133 ³
³ 22211 1133 ³
D ³ 22111 1133 ³
i ³ 22211 1133 ³
s 1.0 Å Å 22111 Å 1133 Å Å
c ³ 22211 1133 ³
r ³ 22111 1133 ³
i ³ 22211 * 1133 ³
m ³ 2211 1133 ³
i ³ 22111 1133 ³
n .0 Å Å Å 22211 Å 1133 Å Å Å
a ³ * 22111 133 * ³
n ³ 2221113 ³
t ³ 22133 ³
³ 233 ³
F ³ 223 ³
u -1.0 Å Å Å Å23 Å Å Å
n ³ 23 ³
c ³ 23 ³
t ³ 23 ³
i ³ 23 ³
o ³ 23 ³
n -2.0 Å Å Å Å23 Å Å Å
³ 23 ³
2 ³ 23 ³
³ 23 ³
³ 23 ³
³ 23 ³
-3.0
Å 23 Å
ÅÄÄÄÄÄÄÄÄÄÅÄÄÄÄÄÄÄÄÄÅÄÄÄÄÄÄÄÄÄÅÄÄÄÄÄÄÄÄÄÅÄÄÄÄÄÄÄÄÄÅÄÄÄÄÄÄÄÄÄÅ
-3.0 -2.0 -1.0 .0 1.0 2.0 3.0
-------------------------------------------------------------------------------
Page 27 SPSS/PC+ 6/12/ 2
Case Mis Actual
Highest Probability 2nd Highest Discrim
Number Val Sel Group Group P(D/G) P(G/D) Group P(G/D) Scores
1 1 1 .3141 .6694 2 .2078 -.3462
1.9267
2 1 ** 3 .7501 .6105 1 .3144 1.2838
.4949
3 1 ** 2 .9091 .4075 1 .3848 -.3761
-.0487
4 1 ** 2 .7501 .6883 1 .2271 -1.2135
-.8144
5 1 ** 2 .8632 .5741 1 .3499 -1.1986
.
1733 6 1 ** 2 .8632 .5741 1 .3499 -1.1986
.1733
7 1 ** 2 .7501 .6883 1 .2271 -1.2135
-.8144
8 1 ** 3 .4240 .8069 1 .1673 2.1062
.2729
9 1 1 .0460 .5781 3 .
3814 1.3137
2.4704
10 2 2 .9091 .4075 1 .3848 -.3761
-.0487
11 2 2 .7501 .6883 1 .2271 -1.2135
-.8144
12 2 2 .8632 .5741 1 .3499 -1.1986
.1733
13 2 2 .9091 .4075 1 .3848 -.3761
-.0487
14 2 2 .7501 .6883 1 .2271 -1.2135
-.8144
15 2 2 .8632 .5741 1 .3499 -1.1986
.1733
16 2 2 .6422 .5039 1 .2576 -.3911
-1.0365
17 2 2 .8632 .5741 1 .3499 -1.1986
.1733
18 2 2 .8632 .5741 1 .3499 -1.1986
.1733
19 2 ** 1 .3753 .6039 3 .2751 .4763
1.7047
20 2 2 .6422 .5039 1 .2576 -.3911
-1.0365
21 2 2 .7501 .6883 1 .2271 -1.2135
-.8144
22 3 ** 1 .0440 .7843 2 .1318 -.3312
2.9145
23 3 ** 1 .4214 .4963 2 .4409 -1.1836
1.
1610 24 3 ** 2 .6422 .5039 1 .2576 -.3911
-1.0365
25 3 3 .9091 .4434 1 .3307 .4463
-.2708
26 3 3 .8632 .6980 1 .2096 1.2688
-.4928
27 3 3 .8632 .6980 1 .2096 1.2688
-.4928
28 3 3 .8632 .6980 1 .2096 1.2688
-.4928
29 3 3 .8632 .6980 1 .2096 1.2688
-.4928
30 3 3 .3967 .8656 1 .1046 2.0912
-.7148
31 3 3 .9091 .4434 1 .3307 .4463
-.2708
32 3 3 .3967 .8656 1 .1046 2.0912
-.7148
33 3 3 .3967 .8656 1 .1046 2.0912
-.7148
Symbols
used in Plots
Symbol Group Label
------ ----- --------------------
1 1
2 2
3 3
* Group Centroids
-------------------------------------------------------------------------------
Page 28 SPSS/PC+ 6/12/ 2
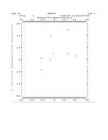
All-groups
Scatterplot - * indicates a group centroid
Canonical
Discriminant Function 1
Out -2.0 -1.0 .0 1.0 2.0 Out
XÄÄÄÄÄÄÄÄÄÅÄÄÄÄÄÄÄÄÄÅÄÄÄÄÄÄÄÄÄÅÄÄÄÄÄÄÄÄÄÅÄÄÄÄÄÄÄÄÄÅÄÄÄÄÄÄÄÄÄX
Out
X X
C ³ 3 ³
a ³ ³
n ³ 1 ³
o ³ ³
n ³ ³
i 2.0 Å 1 Å
c ³ ³
a ³ 2 ³
l ³ ³
³ ³
D ³ 3 ³
i 1.0 Å Å
s ³ ³
c ³ ³
r ³ * 1 ³
i ³ 1 ³
m ³ 2 ³
i .0 Å 2 Å
n ³ * * ³
a ³ 3 ³
n ³ 3 ³
t ³ 3 ³
³ 2 ³
F -1.0 Å 3 Å
u ³ ³
n ³ ³
c ³ ³
t ³ ³
i ³ ³
o -2.0 Å Å
n ³ ³
³ ³
2 ³ ³
³ ³
³ ³
Out
X X
XÄÄÄÄÄÄÄÄÄÅÄÄÄÄÄÄÄÄÄÅÄÄÄÄÄÄÄÄÄÅÄÄÄÄÄÄÄÄÄÅÄÄÄÄÄÄÄÄÄÅÄÄÄÄÄÄÄÄÄX
Out -2.0 -1.0 .0 1.0 2.0 Out
-------------------------------------------------------------------------------
Page 29 SPSS/PC+ 6/12/ 2
Group 1 * indicates a group centroid
Canonical
Discriminant Function 1
Out -2.0 -1.0 .0 1.0 2.0 Out
XÄÄÄÄÄÄÄÄÄÅÄÄÄÄÄÄÄÄÄÅÄÄÄÄÄÄÄÄÄÅÄÄÄÄÄÄÄÄÄÅÄÄÄÄÄÄÄÄÄÅÄÄÄÄÄÄÄÄÄX
Out
X X
C ³ ³
a ³ ³
n ³ 1 ³
o ³ ³
n ³ ³
i 2.0 Å 1 Å
c ³ ³
a ³ ³
l ³ ³
³ ³
D ³ ³
i 1.0 Å Å
s ³ ³
c ³ ³
r ³ * 1 ³
i ³ 1 ³
m ³ 1 ³
i .0 Å 1 Å
n ³ ³
a ³ ³
n ³ ³
t ³ ³
³ 1 ³
F -1.0 Å Å
u ³ ³
n ³ ³
c ³ ³
t ³ ³
i ³ ³
o -2.0 Å Å
n ³ ³
³ ³
2 ³ ³
³ ³
³ ³
Out
X X
XÄÄÄÄÄÄÄÄÄÅÄÄÄÄÄÄÄÄÄÅÄÄÄÄÄÄÄÄÄÅÄÄÄÄÄÄÄÄÄÅÄÄÄÄÄÄÄÄÄÅÄÄÄÄÄÄÄÄÄX
Out -2.0 -1.0 .0 1.0 2.0 Out
-------------------------------------------------------------------------------
Page 30 SPSS/PC+ 6/12/ 2
Group 2 * indicates a group centroid
Canonical
Discriminant Function 1
Out -2.0 -1.0 .0 1.0 2.0 Out
XÄÄÄÄÄÄÄÄÄÅÄÄÄÄÄÄÄÄÄÅÄÄÄÄÄÄÄÄÄÅÄÄÄÄÄÄÄÄÄÅÄÄÄÄÄÄÄÄÄÅÄÄÄÄÄÄÄÄÄX
Out
X X
C ³ ³
a ³ ³
n ³ ³
o ³ ³
n ³ ³
i 2.0 Å Å
c ³ ³
a ³ 2 ³
l ³ ³
³ ³
D ³ ³
i 1.0 Å Å
s ³ ³
c ³ ³
r ³ ³
i ³ ³
m ³ 2 ³
i .0 Å 2 Å
n ³ * ³
a ³ ³
n ³ ³
t ³ ³
³ 2 ³
F -1.0 Å 2 Å
u ³ ³
n ³ ³
c ³ ³
t ³ ³
i ³ ³
o -2.0 Å Å
n ³ ³
³ ³
2 ³ ³
³ ³
³ ³
Out
X X
XÄÄÄÄÄÄÄÄÄÅÄÄÄÄÄÄÄÄÄÅÄÄÄÄÄÄÄÄÄÅÄÄÄÄÄÄÄÄÄÅÄÄÄÄÄÄÄÄÄÅÄÄÄÄÄÄÄÄÄX
Out -2.0 -1.0 .0 1.0 2.0 Out
-------------------------------------------------------------------------------
Page 31 SPSS/PC+ 6/12/ 2
Group 3 * indicates a group centroid
Canonical
Discriminant Function 1
Out -2.0 -1.0 .0 1.0 2.0 Out
XÄÄÄÄÄÄÄÄÄÅÄÄÄÄÄÄÄÄÄÅÄÄÄÄÄÄÄÄÄÅÄÄÄÄÄÄÄÄÄÅÄÄÄÄÄÄÄÄÄÅÄÄÄÄÄÄÄÄÄX
Out
X X
C ³ 3 ³
a ³ ³
n ³ ³
o ³ ³
n ³ ³
i 2.0 Å Å
c ³ ³
a ³ ³
l ³ ³
³ ³
D ³ 3 ³
i 1.0 Å Å
s ³ ³
c ³ ³
r ³ ³
i ³ ³
m ³ ³
i .0 Å Å
n ³ * ³
a ³ 3 ³
n ³ 3 ³
t ³ 3 ³
³ ³
F -1.0 Å 3 Å
u ³ ³
n ³ ³
c ³ ³
t ³ ³
i ³ ³
o -2.0 Å Å
n ³ ³
³ ³
2 ³ ³
³ ³
³ ³
Out
X X
XÄÄÄÄÄÄÄÄÄÅÄÄÄÄÄÄÄÄÄÅÄÄÄÄÄÄÄÄÄÅÄÄÄÄÄÄÄÄÄÅÄÄÄÄÄÄÄÄÄÅÄÄÄÄÄÄÄÄÄX
Out -2.0 -1.0 .0 1.0 2.0 Out
-------------------------------------------------------------------------------
Page 32 SPSS/PC+ 6/12/ 2
Classification
Results -
No.
of Predicted Group
Membership Actual
Group Cases 1 2 3
-------------------- ------ -------- -------- --------
Group 1 9 2 5 2
22.2% 55.6% 22.2%
Group 2 12 1 11 0
8.3% 91.7% .0%
Group 3 12 2 1 9
16.7% 8.3% 75.0%
Percent
of "grouped" cases correctly classified: 66.67%
Classification
Processing Summary
33
Cases were processed.
0
Cases were excluded for missing or out-of-range group codes.
0
Cases had at
least one missing discriminating variable.
33
Cases were used for printed output.
-------------------------------------------------------------------------------
Page 33 SPSS/PC+ 6/12/ 2
This
procedure was completed at 10:26:32
-------------------------------------------------------------------------------
Page 34 SPSS/PC+ 6/12/ 2


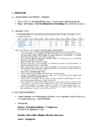


Kõik kommentaarid