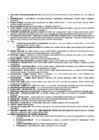
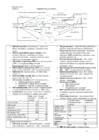
on Power Electronics AC Voltage Regulators Tallinn 2017 Given parameters: Output voltage, Ud = 20 V Input frequency, fin = 50 Hz Load resistance, Rload = 70 kOhm Calculations: U ¿ =2∗U out =2∗20=40V U max U rms = =17.09 V √2 Period = pulse width + delay => 10 ms = 5 ms + 5 ms Table 1. Control curve data. Delay time, Pulse with, Alpha, firing Switch SCR ms ms angle Uout, V Iout, mA Uout, V Iout, mA 0 10 0 28.14 0.52 21.28 0.25 2 8 36 27.8 0.4 25.66 0.37 4 6 72 23.75 0.34 23
2. In combination with haemoglobin within the RBC (greater than 98%) · Haemoglobin within each of the 4-6 billion RBC allows blood to transport ~ 70 times more O2 Haemoglobin saturation 1 molecules haemoglobin = 4 molecules of O2 O2 + haemoglobin = oxyhaemoglobin Haemoglobin oxygen = deoxyhaemoglobin Binding of O2 to Hb depends on PO2 in blood and the bonding strength (affinity) between Hb and O2. O2-hb disassociation curve Oxygen-haemoglobin Dissociation curve High drop in PO2 associated with only slight changes in O2 saturation. As PO2 of blood increases saturation increases. As PO2 of blood decreases affinity between O2 and Hb decreases and O2 disassociates from Hb. Unloading of oxygen to
Law of diminishing returns causes marginal cost to decrease at a decreasing rate and eventually rise · When MC firms only produce more if price increases with output Supply only when price is equal to or greater than minimum AVC; meaning that the firm is profitable or that its losses are less than its fixed cost Changes in Supply Ceteris paribus, when wages increase MC also increases, shifting the supply curve up and left (indicating a decrease in supply as the cost of resources goes up). · Similarly, when AVC decreases (i.e. when technological progress increases the productivity of labor), MC is reduced and the supply curve is shifted down and right, representing an increase in supply. Quantity: produce where MR (P)= MC; profit maximized (TR exceeds TC by a max amount) or loss is minimized. · If price exceeds ATC, TR will exceed TC.
> points(H~D,data=subset(DH332,PL=="KU"),pch=20,col="magenta") > legend("bottomright",c("Kask","Haab","Kuusk"),fill=c("cyan","green","magenta")) #Teen legendi VASTUS: Tee puude omavahelisest kaugusest joonis Hynyneni funktsiooniga. #Tee puude omavahelisest kaugusest joonis Hynyneni funktsiooniga #Kirjutan ümber valemi #L=10000/(exp(c1+c2)*log(D))^(1/2) #Mänd c1=12.669;c2=-1.844 #Valem, diameeter, kõrgus, paksus,värv, tiitlid ja pealkiri curve(10000/ (exp(c1+c2*log10(x)))^(1/2),from=5,to=60,ylim=c(20,120),lwd=1,type="p",col="orang e",xlab="Diameeter (cm)",ylab="Puudevaheline kaugus (cm)",main="Puude omavaheline kaugus") #Kuusk c1=11.414;c2=-1.301 curve(10000/ (exp(c1+c2*log10(x)))^(1/2),from=5,to=60,lwd=1,col="magenta",type="p",add=T) #Kask c1=13.891;c2=-2.331 curve(10000/ (exp(c1+c2*log10(x)))^(1/2),from=5,to=60,lwd=1,col="cyan",type="p",add=T) abline(h=seq(20,120,20),lty=3,col="gray") #Lisan horisontaalse abijooned
Alternatiivkulu, AK Opportunity costs Альтернативные затраты Kasvavate AK seadus Law of increasing opportunity costs Закон растущих альтернативных затрат Võimaliku tootmise piir Production Possibilities Frontier, Граница(кривая) производственных Curve, PPC, PPF возможностей, КПВ Kasvu faktorid Causes of Growth Факторы роста VTP sees Inside PPC Внутри КПВ Väljaspool VTP-d Outside PPC Вне КПВ Kapitalimahukad tooted Capital intensive Goods Капиталоемкие блага
Sampling length L Sampling length L Probability density Parameter from bearing ratio curve and profile height amplitude curve Rku Pku Kurtosis of profile Material ratio curve of the profile Profile height amplitude curve Wku (Abbott Firestone curve)
counterbalance the fall in C, I, G, or X so that the unemployment does not result. The tools the government would use are 1) Increasing G, or 2) lowering taxes (on households) and thus increasing C, or 3) some combination of the two. Expansionary Fiscal Policy The goal of expansionary fiscal policy is to reduce unemployment. Therefore the tools would be an increase in government spending and/or a decrease in taxes. This would shift the AD curve to the right increasing real GDP and decreasing unemployment, but it may also cause some inflation. Contractionary Fiscal Policy The goal of contractionary fiscal policy is to reduce inflation. Therefore the tools would be an decrease in government spending and/or an increase in taxes. This would shift the AD curve to the left decreasing inflation, but it may also cause some unemployment. Supply-Side Economics
Dominant Firm Model In some markets there is a single firm that controls a dominant share of the market and a group of smaller firms. The dominant firm sets prices which are simply taken by the smaller firms in determining their profit maximizing levels of production. This type of market is practically a monopoly and an attached perfectly competitive market in which price is set by the dominant firm rather than the market. · The demand curve for the dominant firm is determined by subtracting the supply curves of all the small firms from the industry demand curve. After estimating its net demand curve (market demand less the supply curve of the small firms) the dominant firm maximizes profits by following the normal p-max rule of producing where marginal revenue equals marginal costs. The small firms maximize profits by acting as PC firms - equating price to marginal costs.
...automaatsed stabilisaatorid 54. Awareness ........................................................teadlikkus 55. Average ............................................................keskväärtus 56. Average cost .....................................................keskmine kulu 57. Average product ...............................................keskmine produkt 58. Average total cost ............................................. keskmine kogumaksumus 59. Backward-spending supply curve ....................tagasipöörduv pakkumiskõver 60. Balance of payments .........................................tasumise tasakaal 61. Balance sheet ...................................................bilanss 62. Bankruptcy [bänkruptcy] ..................................pankrot 63. Bargain [baagen] ..............................................kaubandus; tehing; tingima 64. Batch ................................................................partii 65. Benefit ............
Student: Choose boilers for the district heating network (load duration curve d Calculate annual payments of loan and interests Calculate heat price for loan period, after loan period and for lifetim (Take into account capital cost and fuel Fuels wood chips and/or light fuel oil Boiler lifetime 15 years Loan period 6 years Discount rate 10% 4.5
- expectations about future prices Demand function · Is the functional relationship between the price of the good and the quantity of that good purchased in a given time period (UT), income, other prices and preferences being held constant. · A change in income, prices of other goods or preferences will alter (`shift') the demand function. A Demand Curve Price of Number of Widgets Widgets People Want to Buy $1.00 100 $2.00 90 $3.00 70 $4.00 40 Demand function The nature of the "demand function" depends on the nature of the good considered and the relationship being modeled. In most cases the demand relationship is based on an inverse or negative relationship between the price and quantity of a good purchased.
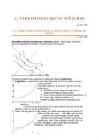
PD.KU<-subset(PD.1,pl=="KU") par(mar=c(4.7,4.7,1,1)) plot(h~d_k, PD.KU, xlim=c(0,35),ylim=c(0,20),xlab="Diameeter, cm", ylab="Kõrgus, m") abline(v=seq(0,40,10),lty=3,col="grey75") abline(h=seq(0,25,5),lty=3,col="grey75") # abijooned #lineariseerides Mnsld.1 <- lm(I(d_k/(h-1.3)^(1/3))~d_k, PD.KU) summary(Mnsld.1) PD.KU$h.nsld<- 1.3+(PD.KU$d_k/ (Mnsld.1$coefficients[1]+Mnsld.1$coefficients[2]*PD.KU$d_k))^3 with(PD.KU, sqrt(sum((h-h.nsld)^2)/(length(h)-2))) curve(1.3+(x/(Mnsld.1$coefficients[1]+Mnsld.1$coefficients[2]*x))^3, from=0, to=35, col="red",add=T,lwd=2,lty=2) rect(19,1,30,6,border=2,lty=2,col=0) ac1 <- round(Mnsld.1$coefficients,3) valem1 <- substitute(h==1.3+(frac(d, b0+b1*d))^3, list(b0=ac1[1],b1=ac1[2])) text(20,4,valem1,pos=4) s1 = round(with(PD.KU, sqrt(sum((h-h.nsld)^2)/(length(h)-2))),2) subr1 = substitute(s[e]==s1,list(s1=s1)) text(20,2,subr1,pos=4) # mittelineaarne Mnsld.2<-nls(h~1.3+(d_k/(a+b*d_k))^3, PD
· A firm will shut down if price falls below minimum average variable costs. Natural Monopoly · A natural monopoly is a firm which experiences increasing returns to scale over the relevant range of output. · A natural monopoly occurs where the average cost of production "declines throughout the relevant range of product demand." The relevant range of product demand is where the average cost curve is below the demand curve. When this situation occurs it is always cheaper for one large firm to supply the market than multiple smaller firms. In fact, absent government intervention such markets will naturally evolve into a monopoly. An early market entrant who takes advantage of the cost structure and can expand rapidly can exclude smaller firms from entering and can drive or buy out other firms. A natural monopoly suffers from the same inefficiencies as any other monopoly. A profit seeking
Õpperühm: EACB Sooritatud: Esitatud: Tallinn 2018 Töö eesmärk Praktiliste mõõtmiste tulemuste saamine ning mõõdetud tulemuste võrdlus teoreetiliste tulemustega. Mõõtetulemuste usaldusväärsuse ja tekkivate mõõtemääramatuste võimalike põhjuste hindamine. Katseseadme skeem Joonis 1. Katseseade ERAVAP aine aururõhu määramiseks Kasutatav standard ja mõõtemetoodika Kasutasime standardit ASTM D6378 Curve, kuna selle meetodi puhul ei ole vaja proovi eelnevalt prepareerida. Standard töötab kolmekordse paisumise meetodiga ning mõõdab iga paisumise puhul rõhku, mida kasutab aine või segu aururõhu määramiseks. Katseandmed Ained: etüülbenseen 17,7558 g isobutanool 19,5579 g Kokku 37,3137 g Meetod: ASTM D6378 Curve Tabel 1.1 Segu aururõhk kindlatel temperatuuridel
Nõudlusseadus tarbijad ostavad kõrgema hinna korral kaupa vähem, kui nad ostavad madalama hinna korral, kui muud tingimused jäävad samaks. Kauba hind ja nõutav kogus muutuvad vastupidises suunas. NÕUDLUSSEADUS Matemaatiline väljendus nõudlusfunktsioon (demand function) funktsioon, mis kirjeldab seost nõutava koguse q (või qD ) ja toote ühikuhinna p vahel. Nõudlusfunktsiooni graafik nõudluskõver (ehk nõudlus- joon) (demand curve) selle iga punkt näitab kaubakogust, mida tarbijad soovivad ja tegelikult suudavad antud hinnataseme juures osta. Seega q D = f ( p) Ajalooliselt kujutavad majandusteadlased hinda vertikaalteljel ja kogust horisontaalteljel. -1 Matemaatiliselt p = f (q D ) (pöördfunktsioon), kuid nimetatakse ikka nõudlusfunktsiooniks. 3 4.02
three dimensions of emotion regulation was measured. Participants were stressed using the TSST test, and the salivary cortisol and plasma IL-6 was measured as endocrinological markers of the stress response. Multiple regression and correlation analysis were conducted investigating the main hypothesis. The results show that hedonistic emotion regulation (HER) and the distress- augmentative emotion regulation (DAR) were the predictors and AUCg (area under the curve in respect to ground) and AUCi (area under the curve in respect to increase) were the dependent variables. Participants, who scored high in HER showed lower cortisol responses, whereas, individuals who scored high in DAR showed a trend towards higher cortisol responses. These results indicate that HER is related to a lower cortisol response to psychosocial stress. In conclusion these results suggest that HER and DAR have an impact on the cortisol response.
võimelised nende eest ka maksma olemasoleva hinna juures soovitud hinda. 10) Pakkumine (supply)- all mõistetakse sellist kaubakogust, mida pakkuja (tootja, vahendaja vm) soovib ja on ka võimeline turule tarnima antud ajahetkel olemasoleva hinna juures. 11) Kogukasulikkus rahulolu, mida tarbijad saavad oma tarbimisvalikutest 12) Nõudlustabel (demand schedule)- peegeldab nõudluse koguse ja hinna vahelist seost ehk nõudluse struktuuri 13) Nõudluskõver (demand curve)- andes tabelis toodud andmed koordinaatteljestikku, saame nõudmise struktuuri kirjeldada ka graafiliselt. 14) Asendusefekt (substitution effect) on üks osa hinna muutuse efektist nõutavale kogusele, mille põhjuseks on suhteliste hindade muutus. (kaup mille hind tõuseb asendatakse teise kaubaga) 15) Sissetulekuefekt (income effect) - on hüvise nõutava koguse muutus, mille põhjuseks on hindade muutusest tingitud reaalsissetuleku muutus. (alanenud hinnaga ost
In the moment captured in this image the wave forms a circle whose center is in the center of the design, allowing the viewer to see Mt Fuji in the background. Edmond de Goncourt described the wave in this way: The drawing of the wave is a deification of the sea made by a painter who lived with the religious terror of the overwhelming ocean completely surrounding his country; He is impressed by the sudden fury of the ocean's leap toward the sky, by the deep blue of the inner side of the curve, by the splash of its claw-like crest as it sprays forth droplets.[23] Andreas Ramos, a writer, notes: [...]a seascape with Fuji. The waves form a frame through which we see the mountain. The gigantic wave is a yin yang of empty space beneath the mountain. The inevitable breaking that we await creates a tension in the picture. In the background, a small wave forming a miniature Fuji is reflected by the distant mountain, itself shrunk in perspective. The little wave is larger than the mountain
kaasavoolu tegur wake fraction coefficient kavitatsioon cavitation kavitatsioonarv cavitation number keeris vortex kere mõju tegur hull efficiency kettasuhe disc area coefficient laba kinnitusäärik blade flange ``kerge´´ sõukruvi ``light´´ propeller kineetiline energia kinetic energy kombinaatortunnusjoon combinator curve kombinatoorne juhtimine combinator control koonilisus conicity, cone (taper) angle koonus cone, taper koostatav composite, built up kroominikkelteras chromium-nickel steel kruvijoon helical line, spiral kruvijoone samm spiral pitch kruvipind helicoidal surface, helicoid käigudiagramm running diagramm käigusamm advance
5 . TA R B I M I S VA L I K U T E M Õ J U R I D Lk 101 - 123 5.1 SISSETULEKU MUUTUSED JA SISSETULEKU-TARBIMISE KÕVER Lk 101 - 103 Sissetuleku-tarbimise kõver(income-consumtion curve) näitab tarbija sissetuleku muutuste mõju tarbimisvalikule, kusjuures hinnad on konstantsed. Sissetuleku muutuste mõju mingi hüvise tarbimisele kajastab Engeli kõver. Engeli kõver näitab hüvise optimaalseid koguseid sõltuvalt sissetuleku suurusest (ceteris paribus). Sissetuleku mõju hüvise nõutavale kogusele võib olla mitmesugune:
28. Bioloogilise mitmekesisuse mõiste, taksonoomiline, funktsionaalne ja geneetiline mitmekesisus; 29. Liikide ligikaudne arv maakeral tähtsamates organismirühmades praeguseks kirjeldatud liikide arv ja arvatav tegelik liikide arv; 30. Liikide arvu varieerumine eri organismirühmades geograafilise laiuse, kõrguse ning sügavuse gradiendil; 31. Lokaalsed geograafilised diversiteedigradiendid poolsaare efekt, lahe efekt, massiefekt, Küürselg-kõver (hump- backed curve); 32. Liikide arvu ja pindala seos; 33. Liigilise mitmekesisuse seos kliimaparameetritega (PET, sademete hulk, temperatuur) ja keskkonna heterogeensusega; 34. Liigirikkuse sesoonne ja lühiajaline varieerumine, van der Maareli karusselli mudel; 35. Tähtsamate organismirühmade liikide (ja kõrgemate taksonite) arvu muutused evolutsioonilises ajas. Liikide väljasuremise dünaamika, massekstinktsioonid; 36
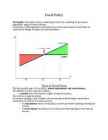
näitamaks mitmeid teisi majanduslikke põhimõtteid. Marshall’i skeem võimaldas visualiseeri- da keerulised majanduslikud põhialused lihtsalt ja täpselt, kui varem oli neid ideid ja teooriaid võimalik seletada vaid sõnade abil. (https://en.wikipedia.org/wiki/Alfred_Marshall#Works, 03.11.2016) Price Supply curve Consumer Market price surplus Equilibrium Producer surplus
продукт puhastoodang NI National income Национальный доход Rahvatulu NNI Net national income Чистый национальный Rahvamajanduse puhastulu доход P price Цена Hind PPC,F Production possibility Граница Võimaliku tootmise piir, curve, fronier производственных kõver возможностей PPI Production price index Индекс цен производства Tootmise hinnaindeks PPP Purchase power parity Паритет покупательской Ostujõu pariteet способности π Inflation Инфляция Inflatsioon
111216 YAGB12 i g i r S Kesk S 6 2 1 1 1 2,2 i 6 2 1 1 1 2,2 m 6 2 1 1 1 2,2 s 6 2 1 1 1 2,2 o 6 2 1 1 1 2,2 n 6 2 1 1 1 2,2 Kokku 36 12 6 6 6 Line Arrows Rectangle Chord Oval Triangle Curve Freeform 7-point star 16 b Detaili ristlõike pin b h_1 h1 b_2 h3 b_3 b3 h_3 A P h_2 h2 b2 Detaili ristlõike pindala ja ümbermõõt 80 cm 150 cm 40 cm 40 cm 60 cm 8600 cm2
............24 Figure 12: Comparison of steady state and unsteady state heat transfer coefficient at agitations of 618 rpm and 1703 rpm..............................................26 Figure 13: Theoretical heat transfer coefficient according to Richardson and Coulson................................................................................................................. 28 Figure 14: Theoretical heat transfer coefficient according to Geankoplis.............29 Figure 15: Calibration curve for the rotameter.....................................................31 Figure 16: Calibration curve for the outlet (T1) thermocouple..............................32 Figure 17: Calibration curve for the inlet (T2) thermocouple................................33 Figure 18: Calibration curve for electronic thermometer......................................33 7 8
Eelarvejoon – Eelarvejoon (budget line) näitab kõiki hüviste kogumeid, mis on tarbijale kättesaadavad antud hindade taseme ja sissetuleku korral. Eksogeenne muutuja – Eksogeenne muutuja (exogenous variable) on selgitav ehk mudeliväline muutuja Elastsus – Elastsus (elasticity) on tarbijate ja tootjate reageerimistundlikkust iseloomustav näitaja. Endogeenne muutuja – Endogeenne muutuja (endogenous variable) on selgitav ehk mudelisisene muutuja. Engeli kõver – Engeli kõver (Engel curve) näitab hüvise optimaalseid nõutavaid koguseid sissetuleku eri tasemete korral (ceteris paribus). Tuletatakse sissetuleku- tarbimise kõverast. Horisontaalteljel on kauba X kogused, vertikaalteljel sissetulekud. Kõvera tõusu järgi saab vaadata nõudluse sissetuleku elastsust, kuna igal hüvisel on erinev nõudluse sissetuleku elastsuse koefitsient. Sissetuleku kasvades kasvab ka kauba X kogus, aga väheneval määral (positiivne, normaalkaup – esmatarbekaup), sissetuleku
transistor can operate, but the secondary breakdown destroys the transistor completely.As a result, a narrow safe operating area is the remarkable disadvantage of the transistor. If Pin = Pout, the efficiency is approx. equal to: 25% 50% 75% 100% How many electrons a silicon atom has? 8 14 24 32 Ticket No4 1,2)A:Junction Field-Effect Transistor (JFET) output characteristic.B:Input curve of a JFET.C:Transconductance curve of Metal-Oxide Semiconductor Field-Effect Transistor(Depletion mode-MOSFET).D:Input curve of enhancement-mode MOSFET. 3)JFET:MOSFET:Enh-modeMOSFET: 4)JFET:Lower lead is called source, and the upper lead is the drain.To produce a JFET,two areas of a p-type semiconductor into the n-type semiconductor have been diffused.Each of these p regions is called a gate.Most JFETs have the two gates joined internally to achieve a
Available: https://www.google.ee/search? q=Audi+A6+2.8,+1995+MY+C4&es_sm=93&source=lnms&tbm=isch&sa=X&ved=0CAcQ _AUoAWoVChMIwsnxg9TRyAIVgo0sCh3eNgLJ&biw=1366&bih=643#tbm=isch&q=Audi +A6+2.8%2C+1995+MY+C4+motor&imgrc=dJMd-lvOOB8LuM%3A. [Kasutatud 20. oktoober, 2015]. [2] „automobile-catalog,“ [Võrgumaterjal]. Available: http://www.automobile- catalog.com/curve/1995/239135/audi_a6_2_8.html. [Kasutatud 20 oktoober, 2015]. [3] „Ladu24,“ [Võrgumaterjal]. Available: https://www.ladu24.ee/img/t/b/0132/1326610.jpg. [Kasutatud 20. oktoober, 1995]. [4] „automobile catalog,“ [Võrgumaterjal]. Available: http://www.automobile- catalog.com/auta_details1.php. [Kasutatud 19. oktoober, 2015]. [5] „autotech,“ [Võrgumaterjal]. Available: http://www.autotech.com/product/final-drive/10-309- 4242.html
Ta elas Pariisis korteris ja 1939.aastast sai temast Pariisi kodanik. Tema maalid sellel perioodil, mida ta ise eelistas pigem kutsuda konkreetseteks kui abstraktseks, olid justkui Münhenis elatud aja ja Bauhauses õpetatud aja süntees. See visuaalne keel, mille poole ta on püüelnud alates 1910dast aastast, on muutunud märkide kogumiks, mis paistavad justkui piltkiri või hieroglüüfid peaaegu desifreeritavate sõnumitena. Tüüpilised selle aja maalid on ,, Violet Dominant", ,,Dominant Curve", ,,Fifteen", ,,Moderation" ja ,,Tempered Elan" Kandinsky suri 1944 aastal. Tema mõju 20 sajandi kunstile oli tähendusrikas.
6. What is a phase and a phase shift? Faas ehk võnkefaas on füüsikas harmoonilist võnkumist kirjeldava funktsiooni argument, mida loetakse kokkuleppelisest alghetkest ehk nullpunktist The Phase Shift is how far the function is shifted horizontally from the usual position. 7. Wat is the angle of divergence? The angle formed by two rays of a luminous beam in a given plane, the intensity within the angle being at least equal to an assigned percentage of the maximum of the curve of intensity distribution in that plane. Most often the plane is either vertical (vertical divergence) or horizontal (horizontal divergence). 8. Bring out the main characteristics of a phase shift scanner. Skänneri töötamise kiirus ulatub miljonitiesse p/s. Skänneri töötamisraadius on aga suhteliselt väike <79m 9. Bring out the main characteristics of a time flight scanner. Skänneri töötamise kiirus on aeglasem, ulatub tuhandetesse p/s – point per sek.
Eelpüstuvuse arvutus Kauba paigutus prog.-s NAPA LOAD TANKS Tankide update, heeling tankide seis vastavalt Esialgsete andmete LOAD STORES ilmastikule sisestus LOAD CARGO Reisijate ja meesk. Arv Kauba kaal Püstuvuse kriteeriumid Area under GZ curve up to 30 deg. 0,055 mrad Area under GZ curve up to 40 deg. 0,090 mrad EELPÜSTUVUS Kontrollida E Area under GZ curve btw. 30-40 deg. 0,030 mrad sisestatud I andmete GM 0,15m Max
. Jooned Line/Arc loob sirglõigu või kaare kahe otspunkti järgi. Et minna sirge joonestamiselt üle kaarele ilma vahendit vahetamata tuleb vajutada A. Peale kaare lõpp-punkti näitamist jätkatakse uuesti sirgega. Joon lõpetatakse vajutusega hiire parempoolsele klahvile. Point loob punkti etteantud kohta. Curve loob sisestatud punktide järgi avatud või kinnise kõvera. FreeSketch loob vabakäejoone ning korrigeerib kujundid korrapärasteks joonteks ja kaarteks või ringideks. 10 3d modelleerimine Kaared
The ice packs in the North Pole are melting sooner in the spring, and cutting their time to hunt seals. The major cause of death for young polar bears is starvation. Musk ox It looks like a huge dust mop on hooves, their long hair reaching almost to the ground. The musk ox gets its name from the odour produced by glands beneath its eyes. The male has thick horns that almost meet on top of its head in what is called a "boss". The horns curve down besides its face and out at the ends. The female has smaller horns, without a boss. Instead the top of her head is covered with whitish hair. In the summer the musk ox herd has about 10 members. They will use the almost constant daylight to stuff themselves on plants. They need to put on enough fat to get them through the long winter. In winter the herd can have about 15 to 20 members.
14. What are the oscillation period and the frequency of the standard supply grid? 15. What are the important features of the steady-state mode? 16. What variables the mechanical characteristics describe? 17. What variables the electromechanical characteristics describe? 18. How does the drive effectiveness depend on the overload capacity? 19. How does the drive accuracy depend on the speed range? 20. How does the drive accuracy depend on the speed curve rigidity? 21. Compare the static characteristics of the rigid drive and the soft drive. 22. What is the important feature of the hoist counter-torque? 23. What is the important feature of the friction torque? 24. What machines are subjected to the multi-quadrant operation? 25. When the generator mode of the motor operation is required? 26. What quadrants of the mechanical characteristics are the most significant for the reversing operation? 27
Kujundite joonestamine (INSERT/Shapes või Format/Insert Shapes Jooned (Lines) Line - joon (sirgjoone lõik) Arrow - nool Double arrow -topeltnool NB! Mõõtjooned Tehke taoline joonis. Väljakandejoonte tegemisel kasutage kopeerimist. Lõppvariant grupeerige. Curve - kõverjoon Proovige teha ülaltoodud kujundite sarnased ning midagi enda valikul. mat/Insert Shapes ) Freeform - vabakuju, Scribble - kritseldus Proovige teha mõned analoogsed pildikesed omal valikul Kujundid Basic Shapes - baaskujundid NB! Kaare (Arc) abil saab muutmise pidemeid, pööramisi ja peegeldusi kasutades moodustada Proovige teha mõned analoogsed pildikesed ja midagi oma valikul NB! Edaspidise jaoks (VBA) pange tähele, et Excel määrab
best antidote for trouble. A smile cannot be bought, begged, borrowed or stolen, for it is something that is of no value to anyone until it is given away. Some people are too tired to give you a smile, so give them one of yours as no one needs a smile as much as the one who has no more to give! So many languages in the world, and a smile speaks them all. "A laugh is a smile that bursts." "A smile is the curve that sets all things straight" The world always looks brighter from behind a smile. "All the statistics in the world can't measure the warmth of a smile." "A smile is just a frown upside-down." I smile and everyone loves me. I cry and find out who my true friends are. A smile is a light in the window of the soul indicating that the heart is home. A smile is as nice to give as it is to receive.
Lihtsustamis meetodis muudetakse joon- või polügoonobjektid sujuvamateks , kus eemaldatakse ebavajalikud osad üldist kuju muutmata. Joonobjektide lihtsustamisel kasutatakse algoritme nagu Ramer Douglas Peucker’i ja Lang’i algoritm. Generaliseemisel on GIS-i programmides olemas eraldi tööriistad, millega tagatakse vajalik eesmärk. Kasutatud kirjandus About the Lang Algorithm. (2012). SUNY Institute of Technology. Kättesaadav: http://web.cs.sunyit.edu/~poissad/projects/Curve/about_algorithms/lang.php (30.11.15) Karthaus, M. (2012). Javascript implementation of the Ramer Douglas Peucker Algorithm. Kättesaadav: http://karthaus.nl/rdp/ (30.11.15) McMaster, R.,B. (s.a.). Cartographic generalization in a digitaal enviroment: when and how to generalize. lk. 59.Kättesaadav: http://www.mapcontext.com/autocarto/proceedings/auto-carto-9/pdf/cartographic- generalization-in-a-digital-environment-when-and-how-to-generalize.pdf (30
Quantity and location of inventory including raw materials, work-in- process and finished goods. SUPPLY CHAIN MANAGEMENT CURRENT KEY TOPIC: TRADEOFF CURVES One of the fundamental tradeoffs in supply chain management is that between inventory levels and customer service. For any given supply chain, increasing the level of service (product/spare part availability) typically means higher levels of inventory. Most companies have discovered their "best place" on the curve, depending on what their customers require and what their competition offers. However, supply chain strategies can shift the entire curve, lowering your inventory levels without adversely affecting your customers (or the reverse, improving customer service levels with no increase in inventory). How might this work? Through effective supply chain management you may be able to reduce lead times. This would shift the curve to the right, speeding
Statistika osa avaneb graafikust © 1996, PASCO scientific © 1998, TPU Rakendusfüüsika öppetool P16 - 3 PASCO scientific 4 P16: Impulsi jäävuse uurimine I Science Workshop paremal. Vajutage sellel nuppu Statistics Menu ( ) ja valige statistka menüüst Curve Fit, Linear Fit. 2. Esimese sensori graafikul tömba hiirega ristkülik ümber piirkonna, (vankrikese nr.1 graafik x(t)), mis näitab liikumist enne kokkupörget. Tee seda sama vankrikese nr.2 graafikul. 3. Vastavalt teooriale söltub konstantse kiirusega liikuva keha koordinaat (asend) ajast järgmise seaduse alusel: x x 0 vt , kus x on koordinaat, xO -- keha koordinaat ajahetkel t=O, v -- keha kiirus ning t -- aeg.
markets Line extension using a successful brand name to market other products • Push strategy promotions to gain or hold shelf space in retail outlets • Pull strategy advertising to “pull” products through the distribution channels Skim pricing offers the opportunity to “skim the cream” from the top of the demand curve with a high price while the product is novel and competitors are few • Penetration pricing attempts to hasten market development and offers the pioneer the opportunity to use the experience curve to gain market share with low price and then dominate the industry FUNKTSIONAALSED STRATEEGIAD Financial Strategy examines the financial implications of corporate and businesslevel strategic options and
4. Cost/income ($, ) cost structure, revenue flows Korporatsiooni väärtusahel: Strategic operations issues: Intermittment systems item is normally processed seqentally, but the work and sequence of the process vary Continuous systems work is laid out in lines on which products can be continuously assambled or processed Operating leverage impact of a specific change in sales volume on net operation income Experience curve unit production costs decline by some fixed persentage each time the total accumulated volume of production units doubles Strategic research and development issues: R&D intensity pending nr of R&D as persentage of sales revenue Technology competence the development and use of innovative technology Technology transfer the process of taking new technology from the laboratory to the marketplace Human resource issues: teams
Vastukaaluks kardinaalse teooriale arendas V.Pareto (1848 1923) välja , ordinaalse kasulikkuse teooria. , .. . Selle teooria kohaselt ei ole tarbijate piirkasulikkust mõõta võimalik. 11.7. (indifference curve) Tarbija ei mõõda mitte erinevate hüviste kasulikkust, vaid järjestavad , hüviste kogumeid kasulikkuse alusel, see tähendab, et neil on . eelistusjärjestus. 11.7. Ükskõiksuskõverad (indifference curve) väljendavad nende hüviste geomeetrilist kohta, mille suhtes tarbijad on ükskõiksed.
Very few of the finished buildings are pleasing to the eye the complex is deathly grey and cramped, and it's all too easy to get lost in a dreary world of concrete constructs. The ugly Barbican redeems itself when it comes to culture. The Museum of London has its buildings in the grounds, and you can catch concerts by the London Symphony Orchestra. A lively set of jazz, classical and contemporary pieces are played in the 2,000-seater concert hall. Contemporary art displays are held in The Curve, and the gallery on Level 3, and art-house movies are screened in the art centre's three cinemas. They even have some stage- plays and shows in the Barbican Theatre. Tucked away amongst the block solid walls is St. Giles Cripplegate. It is one of the very few churches to survive both the Great Fire in 1666 and the Luftwaffe's bombs. It is the jewel in the Barbican Centre's concrete crown: Oliver Cromwell was married here in 1620, and the grave of poet John Milton is hidden in the crypt.
Can we still guess its time of action? Maybe it is undated to not show when her child was born. Yes, we can guess, since Lulu is the girl which Nector likes at the time she meets Marie, in this chapter we can see that Nector marries Marie, so it should be almost immediately after previous chapter. 16. Introduce Lulu Nanapush. What are the most striking traits of her character? How does the absence of her mother influence the girl? She never grew from the curve of her mother's arms. She wants to anchor herself against her. Lulu wants to fill her tracks, but luck runs out the holes. Her wishes are worn soles. She stumbles of these shoes of desire. Stubborn, Lulu definitely knows what she wants and seems like a pretty deliberate person. She runs away from the government school, she is searching for love. 17. Explain the essence of the relationship between Lulu and Nanapush. Old uncle Nanapush writes the letters that bring Lulu home
piirdetammide vahele rajatud tehisveekogu. ·Veehoidla rajatakse vee kogumiseks või äravoolu ajaliseks ümberjaotamiseks (nt suurveeüleujutuste vähendamiseks allavoolu paiknevatel aladel). Veehoidlaid ehitatakse vee- energia saamiseks, veevarustuse, niisutuse, kalamajanduse vm, sageli mitmeks otstarbeks. Neid kasutatakse ka virgestuseks ja sportimiseks. ·Voolu tõkestamine põhjustab paisutuse, mis levib paisjoonena (backwater curve) ülesvoolu. ·Veetase võib veehoidlas kõikuda suurtes piirides, sõltuvalt juurdevoolust ja vee tarvitamisest. Paisutustasemed: ·KPT kõrgeim paisutustase (highest flood level), s.o veehoidla kõrgeim veetase, mis on tehniliselt lubatav vaid lühikest aega erakorralistes (kevadsuurvesi, suur vihmaveetulv) oludes. Sel ajal on täis nii jõude-, kasus- kui ka tulvamaht; ·NPT normaalpaisutustase (full reservoir level), s.o projektikohane veetase, mida võib hoida
Miks peaks valitsus tahtma kehtestada tasakaaluhinnast kõrgema hinna? Et doteerida tootjat 29 Nõudmine & pakkumine ei ole staatilised: NÕUDMINE PAKKUMINE Võib muutuda Reageerib aeglase- väga kiiresti malt, kuna on seotud ressursside ümberpai- tamise vajadusega 30 Effect of a shift in the demand curve P S g Pe1 D1 O Qe1 Q31 Nõudluskõvera nihe P S g Pe1 D1 O Qe1 Q32 Nõudluskõvera nihe P S g Pe1 D2 D1 O Qe1 Q33
phase. If the breakdown slip increases, the start-up time will rise or drop. At start-up, which variables grow first? current The capacitor-run motors are used in the following applications: cheap The star-delta commutation at start-up provides high run-up current/ low run-up current/ low run-up torque??? The drawbacks of the dc injection braking are as follows high drive mass The double-phase motors are used in the following applications cheap What quadrants does the speed-torque curve of the dc injection braking occupy? Braking is processed in the second quadrant. There is no braking in the first quadrant. The high braking torque is the braking benefit hence the high current is its drawback because of heating danger. Test VI If the rotor resistance rises, which slip will increase in the wound rotor motor? breakdown, operating If the rotor resistance reduces, which speed will increase in the wound rotor motor? operating
31. Loomuliku töötuse määr, % natural rate of unemp- 29. loyment siirde-ja struktuurse töötuse osakaal tööjõus 32. Inflatsiooni ja töötuse seos. Phillipsi kõver, Phillips 30. curve- töötuse ja inflatsiooni vahel pöördvõrdeline seos 33. Makromajanduslik tasakaal iseloomustatakse (, kogunõudluse ja kogupakkumise tasakaaluga majanduses 34. Kogunõudlus, aggregate demand, ADkõikide hüviste ).
Ceteris paribus eeldus! („teiste muutujate samaks jäädes“ või „hoides teisi muutujaid konstantsena“) 2) Mida väidab nõudlusseadus? Nõudluskõvera graafiline esitus. Nõudlusseadus: hüvise hinna tõustes selle nõutav kogus väheneb ning hüvise hinna langedes selle nõutav kogus suureneb. Seega, hüvise hind ja nõutav kogus liiguvad (üldjuhul) vastupidises suunas. Nõudlustabelis esitatud andmete põhjal on meil võimalik koostada nõudluskõver (demand curve, tähistus D). Nõudluskõver näitab tarbijate poolt nõutavaid koguseid erinevatel hinnatasemetel. Selleks kanname koordinaatteljestiku x-teljele hüvise kogused ning y-teljele hüvise hinnad. A 4 Nõudluskõvera puhul on tegemist langeva ehk negatiivse tõusuga sirgega. Miks? Nüüdseks juba teame, et hüvise hinna langedes (liikudes punktist A punkti B) nõutav kogus suureneb.
ära matemaatika tulemuste kaudu. Kordaja statistiline olulisus: ANOVA tabeli viimane sig. Järgmises tabelis on regressioonivõrrandi statistilise olulisuse näitaja. Ehk teisisõnu, kui kasutame antud võrrandit ennustamiseks, kui suur on eksimise tõenäosus. Coefficients'ide tabelist: vabaliikme statistiline olulisus ( vaatad constanti sig'i) Lineaarne seos: Saab kontrollida: Analyze -> Regression -> Curve estimation. Püsivad lineaarsel joonel siis on lineaarne seos. Regressiooni võrrand (arvud leiad Coefficients'ide tabelist): Näide 1: PVREAD(see mille tulemust ennustad)=40,66(Constant B ümardatult)+ 0,89(PVMATH B)*PVMATH (see pole arv, vaid muutuja nimetus) Näide 2: vocab = -0,011+0,358*reading+0,428*sentcomp+0,2*mathmtcs Regressioonanalüüsi eeldused on järgmised: