1 2 3 4
Paisktabelist otsimise keskmine ajaline keerukus on O(1) Average time complexity of binary search is Kahendotsimise keskmine ajaline keerukus on O(log n) Average time complexity of heapsort is Järjestamise kuhjameetodi keskmine ajaline keerukus on O(n log n) Worst case time complexity of quicksort is Järjestamise kiirmeetodi halvima juhu ajaline keerukus on Vali üks: O (n2) Leaves of a tree are Puu lehed on nodes without children / alluvateta tipud Dijkstra algorithm on graphs is for finding Dijkstra algoritmiga arvutatakse graafis shortest paths from a given vertex to all reachable vertices antud tipust algavaid lühimaid teid kõigisse saavutatavatesse tippudesse Floyd-Warshall algorithm on graphs is for finding Floyd-Warshalli algoritmiga arvutatakse graafis lengths of shortest paths between all pairs of vertices lühimate teede pikkusi kõigi tipupaaride vahel Kruskal algorithm on graphs is for finding Kruskali algoritmiga arvutatakse graafis
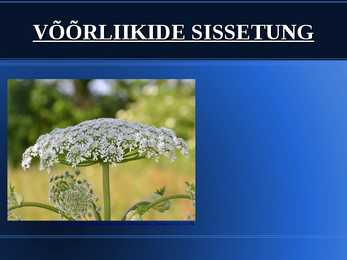
files.wordpress.com/2013/09/map-invasive_species1.jpg Arvandmed Eestis on ligi 1000 võõrliigi Euroopas 10 000 40% väljasuremistest viimase 400 a. jooksul tuleneb võõrliikidest Võõrliigid Eestis http://www.nobanis.org/Charts/TmpCharts/ChartPic_000020.jpeg?1c757847-33a8-40da-b9c7-715380c03c60 Võõrliikide arvukus Euroopa riikides http://www.europe-aliens.org/images/Graphs/countryCount.png Kasutatud materjalid: http://www.envir.ee/89801 http://uudised.err.ee/index.php?0544260 http://novaator.ee/ET/loodus/voorliikide_sissetung_voib_muuta_evolutsiooni/ http://www.maaleht.ee/news/maamajandus/loomakasvatus/keskkonnauhendused-naitavad-uuele-naaritsafarmile-punast-tuld.d?id=64606012 http://www.elfond.ee/et/teemad/teised-teemad/muud-looduskaitselised-tegevused/voorliigid http://www.europe-aliens.org/europeSummary.do
kesk. / standardhälve. Kui küsitakse, et milline test on olnud vastajaile kõige lihtsam, siis see, mille histogrammi kellukakõver näitab, et enamus lahendajaid on üsna suure skoori saanud, ehk kellukatipp on võimalikult paremal. Uued tunnused matemaatiliste funktsioonide abil: Näiteks matemaatika testi tulemusi logaritmilisele skaalale teisendades, tuleb valda Transform - Compute variables - Uue muutuja nimeks log_mat ja vastav funktsioon LN(matemaatika) Tulpdiagrammi saamiseks: Graphs -> Bar. Ühe tunnuse jaoks vali: Simple-Summaries of groups of cases, Define. Tunnus, mille sagedusjaotust soovid illustreerida paiguta väljale Category Axis Kastis Bar represent saab valida kas absoluutsed sagedused (N of cases) või protsentuaalsed osakaalud. Kui soovite, et puuduvate väärtuste jaoks eraldi tulpa ei kuvataks:Options ja vajuta kastil Display groups defined by missing values. Pealkirja saamiseks vajuta nuppu Titles.
Occupational diseases Report Introduction: This report is about occupational diseases. The report is based on two graphs. The first one describes the number of diseases from the year 1998 to the year 2000. The second one describes the occupations, which have shown to be the most alarming. The report will also give some pointers for the people, who have some kind of occupational diseases. Number of diseases: On the first graph is shown the number of occupational diseases. From the first half of the year 1998 to the middle of the year 1999 the number of occupational diseases grew from 169 to 180
Hematophobia 6% Other 17% 9% What kind of phobia do you have? Explanation: Agoraphobia- Fear of open spaces or of being in crowded, public places. Altophobia- Fear of heights. Insectophobia - Fear of insects. Pteromerhanophobia- Fear of flying. Trypanophobia- Fear of injections. Hematophobia- Fear of blood. Graphs 17% Yes No 83% Do you have a phobia? 38% Male Female 62% Gender 17% All life Few years
Also, the author wanted to arouse the interest of people to the world of art. For the implementation of the purposes and solving problems materials presented in the theoretical part were collected and analyzed. In the practical part the interviews of high school students were analyzed. The aim of the survey was to find out their attitude towards the art. At the end of the research the received results were depicted in the form of graphs and charts. The study found that the majority of students believe that art plays an important rolein their life. It broadens horizons, teaches to understand the beauty. Also, many students are addicted to some form of art, which helps them to develop and improve themselves. Thus, the purpose of research work has been achieved. 20
omit) viia teise veergu. Genereerida uus aruanne. Aruanne näitab, et mudelis on veel statistiliselt mitteolulisi muutujaid. Eemaldada muutuja x1_TASU. Koostada uus regressioon. Mudeli kõik muutujad ei ole ikka veel statistiliselt olulised. Eemaldada muutuja x5_TOETUS. Teostada uus regressioon 3 sõltumatu muutujaga. Regressioonimudelis on kõik usaldusväärsed muutujad. Regressioonimudeli analüüs – graafikute ja tabelite koostamine Graafikud – menüü Graphs Graafikuid on võimalik koostada: a) Residual Plot (regressioonijääkide ja muud näitajad) Näide: regressioonijääkide sõltuvus vaatluse järjekorranumbrist b) Fitted, actual plot (hinnatud mudel, tegelikud andmed) Näide: tegeliku Y ja arvutusliku Ŷ vaheline seos c) regressioonijääkide normaaljaotuse kontrollimine Tabelid - menüü Analysis a) display actual, fitted data, residual (algandmed, arvutuslikud Y, ja regressioonijäägid (üks osa tabelist)
by Joseph Fourier in 1824, discovered in 1860 by John Tyndall, was first investigated quantitatively by Svante Arrhenius in 1896, and was developed in the 1930s through 1960s by Guy Stewart Callendar. Solar activity Since 1978, output from the Sun has been precisely measured by satellites. These measurements indicate that the Sun's output has not increased since 1978, so the warming during the past 30 years cannot be attributed to an increase in solar energy reaching the Earth . The graphs show otherwise. Effects of global warming on oceans Global warming can affect sea levels, coastlines, ocean acidification, ocean currents, seawater, sea surface temperatures, tides, the sea floor, weather, and trigger several changes in ocean bio-geochemistry; all of these affect the functioning of a society. Impacts on society The rise in sea level along coastal regions carries implications for a wide range of habitats and inhabitants
lower fertility rates He noted that there was a correlation between wheat prices and marriage rates i.e. wheat price increases marriage rates decrease (C18th) Positive checks (decrease in population size due to): famine, war, diseases i.e. anything which increases mortality and decreases life expectancy. Carrying capacities can relate to ecosystems and humans. Rapid economic growth can impede economic development by exacerbating social and economic problems. Studythe graphs on page 379 and summarise the points made relating to links between population growth and levels of economic development. Checks fall into three categories; 1. Misery-(Shorten LE) 2. Vice-Warned against the dangers of practicing family planning which may lead to promiscuity 3. Moral restraint-Advised this e.g. delayed marriage and limit sexual partners. This viewpoint also states that available technology to cultivate further would lead to soil erosion and
Kodune keel Vanuseline jaotus Haridustase Elukoht Leibkonna suurus Kodus elavaid lapsi Tegevus Sissetulek ANDMEANALÜÜS: statistiline andmestik ja kirjeldav statistika. 2010/11 K.Osula -9- 6. Andmete graafiline esitamine Kasuta - tulpdiagrammi, kui tahad võrrelda erinevate kategooriate sagedusi omavahel. - sektordiagrammi, kui tahad esile tuua osa tervikust - joondiagrammi, kui tahad esitada nähtuse muutumist ajas - histogrammi, kui tunnusel on palju erinevaid väärtusi 6.1. HISTOGRAMM (Graphs/Histogram...) tunnus peab olema numbriline tunnusel peab olema piisavalt palju erinevaid väärtusi (EI SOBI: vanus: 19,20,21) Joonisel 1. on tehtud tulpdiagramm. Paremini sobiks histogramm, mis koondaks andmed vahemikesse ja tulemus oleks ülevaatlikum. Joonis 3. Joonisel 2. on tehtud histogramm. Paremini sobiks tulpdiagramm, kuna tunnusel on ainult kolm erinevat vastusevarianti (ja neid kolme vastust ei ole vaja gruppidesse jagada). Joonis 4.
http://rainforests.mongabay.com/deforestation/2000/Tanzania.htm http://www.tanzania.go.tz/naturalresources.html http://www.tanzania.go.tz/industries.html http://www.tanzaniainvest.com/industry-trade http://www.albion.ee/tansaania.html http://www.kontiki.ee/client/default.asp? wa_id=214&wa_object_id=1&wa_id_key=18d1f675ed475ad1d5baea7baeda28a7 ,,Uus maailma atlas" 2009 Pildid http://upload.wikimedia.org/wikipedia/commons/5/5b/Tanzania_in_its_region.svg http://www.indexmundi.com/graphs/population-pyramids/tanzania-population-pyramid- 2012.gif http://www.mapsofworld.com/tanzania/cities/ https://www.courses.psu.edu/test/test100_hkr/AFIM/Jpegs/NR_E.jpg http://upload.wikimedia.org/wikipedia/commons/b/b0/Tanzania_agriculture_map-fr.svg http://exploringafrica.matrix.msu.edu/teachers/curriculum/m18/images/image012.png
Statistiliselt võttes saame rääkida kolmest võimalikust põhjuslikkuse suunast. Eeltoodud näite põhjal võivad nad olla järgnevad: 1 Muutuja X põhjustab muutuja Y varieerumist. 2 Muutuja Y põhjustab muutuja X varieerumist. 3 Kolmas muutuja Z põhjustab nii muutuja X kui ka muutuja Y varieerumist. Enne statistikute uurimist vaatame aga hajuvusdiagrammi (scatter plot). Mille leiate Graphs menüü alt. Graphs Legacy Dialogs Scatter/Dot Simple Scatter. Kui teete joonisele topeltkliki, saate lisada ka lineaarset seost kujutavad joone joonisele. Joone lisamisel peaks olema ilmsem, millise seosega on tegemist. 9 Kuidas aga see graafiline info statistikutes väljendub? Korrelatsioonide leidmiseks kasutage käsklusterida Analyze Correlate Bivariate
LRAC is "U-Shaped" · The LRAC initially decreases due to "economies of scale" Economies of scale are due to division of labour. · Eventually, "diseconomies of scale" begin usually lack of adequate information to manage the production process Calculations of LRAC With a little mathematics, the long run cost functions can be calculated. It is easier to use equations rather than tables and graphs. If consumer behavior, production and cost are understood, you can then think about how to achieve your objectives. Economic (opportunity) cost Explicit costs Implicit costs Normal profit Economic profit Short run Long run Total product (TP) Marginal product (MP) Average product (AP) Law of diminishing returns Fixed costs Variable costs Total cost Average fixed cost (AFC) Average variable cost (AVC) Average total cost (ATC) Marginal cost (MC) Economies of scale Diseconomies of scale
EUROOPA PARLAMENDI JA NÕUKOGU MÄÄRUS (EL) nr 1380/2013 , 11. detsember 2013 02.03.2015 Komisjoni delegeeritud määrus (EL) nr 1396/2014, 20. oktoober 2014 02.03.2015 Lubatud kogupüügid ja kvoodid. Euroopa komisjon, 26.11.2014 [http://ec.europa.eu/fisheries/cfp/fishing_rules/tacs/index_et.htm] 02.03.2015 Villasante, S; Garcia-Negro, M; Gonzalez-Laxe, F; Rodriguez, G, R. 2011 Fish & Fisheries. Mar2011, Vol. 12 Issue 1, p34-50. 17p. 8 Graphs. 03.03.2015 Eesti kalanduse strateegia 2014-2020. Eesti Vabariik Põllumajandusministeerium 2013 02.03.2015. ELi ühine kalanduspoliitika. Euroopa komisjon, 11.12.2013 [http://ec.europa.eu/fisheries/cfp/index_et.htm] 02.03.2015 Kalanduse tegevusgrupid Eestis. Kalanduse teabekesus, [http://www.kalateave.ee/et/kalanduspoliitika/kalanduse-tegevusgrupid] 03.03.2015 Saat, J. (2013). Kalanduskonverents „Uue kalanduspoliitika lävel“. Tallinn, 27.
condition. Nevertheless, after looking at the different variables, I noticed that Finland was the most stable country, it didn´t have as volatile movements as Estonia did for example. Clearly Estonia was the most surprising country as it rates could have been in negative sides in one year and the other it would be already on the positive side and growing (current account deficit to surplus in 2009). It was obvious from the graphs that Estonia was the country that was influenced most when the crisis hit in 2008, but it has rebounded well after. I would rank the countries based on their results throughout the last decade as 1. And the best would be Finland, 2. Hungary as it has been showing average results and 3. Would be Estonia due to the damage that crisis brought to the country. However the economic forecast for years 20112013 says about Estonia: The Estonian
explain t he symbols used on a map. But thi s a tlas is m o re than ju st a wealth of You ca n find o ut m o re abou t legends information . It is fun to look a t to o. You will an d th e m a p sym bo ls used in this atlas find th at th ese ma ps an d ph o to graphs can evo ke on page 6. im ages of far away pla ces. T hey in vite you to pause an d to dream . With a m ap you can journey th e world without ever getting wet, cold, tir ed or Special Features o f this Atlas hungry. You ca n im agine grea t adven tu res an d
Kalor. The main purpose of the research was to find out in what way has the aforementioned company changed the heat production and consumption more effective in its district since its inception. In addition to that, the author of the research had a personal interest in finding out more about the work procedure of heat production, and enterprises of Tamsalu. First of all, in order to conduct the research, the author has described the work structure of AS Tamsalu Kalor, and by graphs and verbal explanations described the number of employees, the amount of heat production and sale in different time periods of the companies history. Then, the author has given a overview of the different tools (boilers, district heating pipeline, chimney) that are used in the heat production, and their impact on Tamsalu's heat price. Due to the fact that a significant part of the heat price is in direct relation with the fuel price in the market, the author has also described the usage
Two diffusions are used, one to create the p-type body region and another to created n-type source region.Breakdown voltage up to 600V and current capability up to 50A. How many electrons a germanium atom has? 8 14 24 32 Holes are the minority carriers in which type of semiconductor? n-type p-type each never Ticket No5 1)Insulated Gate Bipolar Transistor (IGBT) 2,3)OutputcharacteristicsInput characteristics Typical graphs of collector current versus frequency. 4)IC(max)=30-600A;UCE=120-1200V 5)Structure is quite similar to enhanced-mode MOSFET.The principal difference is the presence of p layer that forms the collector of the IGBT.This layer arranges the pn junction which injects minority carriers. 6) 7)Advantages:a)the highest power capabilities up to 1700 kVA,2000V,800A;b)thanks to the lower resistance than that of the MOSFET,the heating losses of the IGBT are low
muutuja mõjust teisele. Statistiliselt võttes saame rääkida kolmest võimalikust põhjuslikkuse suunast. Eeltoodud näite põhjal võivad nad olla järgnevad: 1 Muutuja X põhjustab muutuja Y varieerumist. 2 Muutuja Y põhjustab muutuja X varieerumist. 3 Kolmas muutuja Z põhjustab nii muutuja X kui ka muutuja Y varieerumist. 1) KORRELATSIOON Enne statistikute uurimist vaadata ka hajuvusdiagrammi: Graphs Legacy Dialogs Scatter/Dot Simple Scatter Lisa joonisele ka lineaarset seost kujutav joon! Graafilise info väljendumine statistikutes: (korrelatsioon) Analyze Correlate Bivariate Options alt valida, mida teha puuduva andmestikuga. Vaikimisi peaks seal olema käsklus Exclude cases pairwise, mis tähendab, et kui terve indiviidi/andmerea sees on ühel muutujal väärtus puudu, siis ainult seda andmepunkti ei kasutata edaspidises
(üldarv/hulk, standardhälve ning min., max., keskmine ja summaarne väärtus) Set Selectable Layers... kaardiaknas seleteeritavate kihtide defineerimine Clear Selected Features valitud objektide selekteeringu tühistamine Interactive Selection Method interaktiiv ne objektide valimine Options... selekteeringuga seotud parameetrite määratlemine Tools menüü käskude lühikirjeldus Editor Toolbar Editor tööriistariba aktiveerimine ja ekraanile toomine Graphs graaf ikute/diagrammide loomine Reports aruandev ormide loomine Geocoding geokodeerimine Add XY Data... XY koordinaatidega määratud andmestiku lisamine kaardidokumenti (tekitatakse uus kiht) Add Route Events... marsruutinf o lisamine kaardidokumenti (tekitatakse uus kiht) ArcCatalog ArcCatalog aplikatsiooni aktiveerimine Macros makrode käiv itamine / Microsoft Visual Basic akna aktiv eerimine
(Figure 11), the overall heat transfer coefficient differs from 477 W·m-2·K-1 to 839 W·m-2·K-1 According to (Geankoplis, 1993) the overall heat transfer coefficients (Figure 14) varies from 627 W·m-2·K-1 to 1180 W·m-2·K-1. The theoretical values from Table 1 suggests that the number of overall heat transfer coefficient while cooling the water inside the bath should be between 250 W·m-2·K-1 and 800 W·m-2·K-1. A common trend can be seen in all the graphs, the heat transfer coefficient grows with higher agitation rates and with higher Reynolds number. The experimental results do not show the effect of the agitation as clearly as expected, but the effect of the Reynolds number is certain. When comparing the numerical values of experimental and theoretical overall heat transfer coefficient results, it is seen, the difference is rather large, the theoretical results overpredicts the value of overall heat transfer coefficient by 31% to 41%
11 Games Programming with Java and Java 3D The choice of symbols in Figure 2 is not arbitrary. The symbols in Figure 3 are office desk chair chair brown shape black shape blue Figure 2. Scene Graph for an Office. commonly used to draw Java 3D scene graphs; they are explained below. In true object oriented style, all the nodes in a scene graph inherit from a SceneGraphObject class, but are Scene Graph Nodes Node Relationships subclassed in different ways. Virtual Parent - Universe Child Shape nodes are used for the
that can berun against a new build. 5. Reporting •XP leaves tracking to the project managers, encouraging them to minimize the overhead of collecting data and use large visible wall charts. •In contrast, Tracking By Feature in FDD describes a low-overhead, highly accurate means of measuring progress and provides the data to construct a large variety of practical, useful, progress charts and graphs. 19. Scrum is a project management method. The approach was first described by Takeuchi and Nonaka in "The New New Product Development Game" (Harvard Business Review, Jan-Feb 1986). They noted that projects using small, cross-functional teams historically produce the best results, and referred to this as the "rugby approach". In 1991, DeGrace and Stahl, in "Wicked Problems, Righteous Solutions" referred to this approach as Scrum, a rugby term mentioned in the article by Takeuchi and Nonaka
NAISKLIENDI TARBIMISHARJUMUSTE MUUTUSED RÕIVA- JA ILUTOODETE KATEGOORIAS Lõputöö Juhendaja: Eva Vahtramäe MA Mõdriku 2012 SUMMARY Final paper is composed on Changes of consuming habits in category of clothes and beauty products among female customers. Paper is presented on 54 pages and it includes one extra. The paper has been appearenced with three charts and 16 graphs. Beauty has became the keyword of our society and, therefore, everybody tries to change their appearance close to perfection. Over the years the societal pressure on women has enourmosly increased. Research is necessary because the last ten years people have more and wider options. People increasingly give special attention to their appearence to become more competitive. Research is also needed for beauty treatment area, service- and sales corporations, who have many competitors in
(a so-called "jabbering adapter"), then in a 10Base2 Ethernet will become totally dysfunctional. But a 10BaseT network will continue to function, because the hub will detect the problem and internally disconnect the malfunctioning adapter. Also, most hubs can gather information and report the information to a host that connects directly to the hub. This monitoring host provides a graphical interface that displays statistics and graphs. Many Ethernet adapters today are 10/100 Mbps adapters. 100BaseT, which typically uses category-5 twisted pair (a highquality twisted pair with a lot of twists). Unlike the 10Base2 and 10BaseT, 100BaseT does not use Manchester encoding, but instead a more efficient encoding called 4B5B: every group of five clock periods is used to send 4 bits in order to provide enough transitions to allow clock synchronization. Gigabit Ethernet
,,Has the researcher reviewed the data generally to obtain a sense of the information?" · Kas koodisüsteem on arendatud teemade kategoriseerimiseks? ,,Has coding been used with the data? Have the codes been developed to form a description or identify themes?" · Kategooriate kategoriseerimine. ,,Are the themes interrelated to show higher level of analysis and abstratction?" · Andmete esitlusviisid (tabel jne.) ,,Are the ways that the data will be represented-such as in tabes, graphs, and figures-mentioned?" · Analüüsi interpreteerimise viisid. ,,Have the bases for interpreting the analysis (personal experiences, the literature, questions, action agenda) been specified?" · Uuringu tulemus. "Has the researcher mentioned the outcome of the study? (develop a theory? Provide a complex picture of themes?)" · Andmete valideerimine. ,,Have multiple strategies been cited for validating the findings?" Kvalitatiivsed andmekogumise
Statistics show that exports to non-CIS countries have considerably increased recently. 52 Post-Crisis Like many other countries, Belarus was engulfed in the financial and economic crisis in 2008. The crisis in Belarus developed according to global trends, with a few distinctions. It is generally assumed that the crisis in 2008 did not hit Belarus as hard as it did its neighboring countries, although, as graphs above illustrate trade (both export and import) decreased substantially in 2009 and 2010 and recovered only in 2011. That is largely due to Belarus's structural economic indicators, the low amount of foreign borrowing, the country's aspiration to maintain the prevailing level of production and employment at all costs, an active social policy, the issue of loan bonds to prop up the economy, Russia's financial support and a few other factors.
test: Does lemon or vinegar really decrease the GL of a meal? Which lowers glucose response more, if either: protein or vegetables and fiber? Does eating fat and protein with a high-carb meal lower GL more than eating either before the meal? Does drinking water with a meal increase or decrease its GL? How I Used It and What I Learned September 23 was one of the first test days with the implant. I tried everything, as I wanted to see highs and lows. The following graphs show my data for that 24-hour period, and the downward arrows in the rst graph indicate where I inputted glucometer readings. Taking the blood glucometer readings is the only pain-in-the-ass part. The SEVEN is designed to show trends and alert you when the upward or downward changes are too dramatic. To ensure that the displayed number is close to accurate, you need to calibrate with a glucometer at least twice a day. Don't want to become diabetic
67w 5.34w 6 400 ma 2.4w 4w 6.4w 7 466 ma 3.267w 4.2w 7.47w 8 533 ma 4.27w 4.27w 8.54w 9 600 ma 5.4w 4.2w 9.6w 10 667 ma 6.667w 4w 10.67w 11 733 ma 8.067w 3.67w 11.74w 12 800 ma 9.6w 3.2w 12.8w Figure B.2 graphs the dissipation of the opamp and the heater as a function of input (heater) voltage. The worst-case power dissipation for the opamp occurs when it is dropping half the supply voltage (8v). Even though the heater in this application never dissipates more than 9.6w, the power supply must be capable of delivering at least 12.8w. A PWM-based control method is illustrated in Figure B.3. This circuit uses the same
01: I -2 -1 t Story +1 +2 +3 +4 +5 +6 +7 +8 +9 +10 +11 Day Figure 4.2 Daily Fluctuation in Number of Accident Fatalities before, on, and after Suicide Story Date As is apparent from these graphs, the greatest danger exists three to four days following the news story's publication. After a brief drop-off, there comes another peak approximately one week later. By the eleventh day, there is no hint of an effect. This pattern across various types of data indicates something noteworthy about secret suicides. Those who try to disguise their imitative self-destruction as accidents wait a few days before committing the act-
through life. T h e stages of that progression, the natural stages of life and growth, make up the Hero's Journey. T h e Hero archetype is a rich field for exploration by writers and spiritual seekers. Carol S. Pearson's book Awakening the Heroes W i t h i n further breaks down the idea of the Hero into useful archetypes (Innocent, Orphan, Martyr, Wanderer, Warrior, Caregiver, Seeker, Lover, Destroyer, Creator, Ruler, Magician, Sage, and Fool) and graphs the emotional progress of each. It's a good guide to a deeper psychological understanding of the Hero in its many facets. T h e special avenues traveled by some female heroes are described in The Heroine's Journey: Woman's Quest for Wholeness by Maureen Murdock. 37 MENTOR: WISE OLD MAN OR WOMAN "May the Force he with you!"
diated samples. successive cooking trials of bacon and build up what was essentially a photographic stan- dard. This procedure was adopted by Sheard Pâté et al. (2001). Assessors were given 20 photographs of bacon that had been fried. Siret and Issanchou (2000) investigated the Assessors were asked to rank the photo- influence of traditional processing and non- graphs in increasing order of exudates. The traditional processes on the eating quality of results followed the procedures given in the pâté. The essential differences in production British Standard BS5929. This ranking between traditional and nontraditional pro- revealed differences in bacon types in rela- cesses are that in the former, the raw materi- tion to the amount of exudates produced. The als used are more diverse; nitrate is used