intervallide järel intervallide järel , mis kattuvad valiku mis kattuvad valiku intervallidega Süstemaatiline valim (Systematic sample) Valimi moodustamine on peaaegu sama, mis lihtsa juhusliku valimi korral, kuid populatsioonist toimub valimine mingi süsteemi alusel, nt perioodiline valimine, iga kahekümnes isik valitakse. Selline valik aga nõuab, et nimed oleksid nimekirjas juhuslikus järjekorras. Sõltumatu tunnus [Independent Variable] - uuritav või mõõdetav karakteristik, mis eeldatavasti mõjutab sündmust. Sündmus ei mõjuta sõltumatut tunnust, kuid sõltumatu tunnus võib olla sündmuse põhjustajaks või soodustada selle variatsiooni. Sõltuv muutuja (Dependent Variable)- muutuja või tegur, mille väärtus sõltub või oletatavalt sõltub teiste uuritavate [põhjuslike] muutujate mõjust. Üldistamine (Generalizing)- elementidest ühtse terviku moodustamine.
- wages represent the cost of labour - interest represents the cost of kapital - rent represents the cost of land - "normal profit [ P ]" represents the cost of entrepreneurial activity Normal profit includes risk Economic Costs Production and Costs COST CURVES: - Fixed Costs (TFC) = costs that do not vary with output (present even when output, q, = 0) - Variable Costs (TVC) = costs that vary with the rate of output - Total costs (TC) = TFC + TVC - Average Variable Cost (AVC) = total variable cost/ number of units produced - Average Fixed Cost (AFC) = fixed costs/ output (units produced) - Average Total Cost (ATC) = total cost (variable and fixed) / number of units produced - Marginal Cost (MC) = the change in total cost required to produce an additional unit of output.
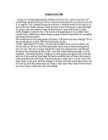
Estonian climate in winter-time. In Estonia, winter climate is very variable. Some year, it could be very cold outside, but some year it could be so warm you may wear your autumn clothes in winter. Some year it could snow so much, that you can't even get out of the house, because there's too much snow in front of your door and some year it may not snow for at least half of the winter-time. But no worries, mostly the temperature may go below -30 and because of the cold, students are absent from schools.
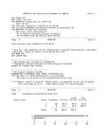
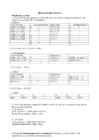
* Tingimuses olevaid tunnuseid ei tohi analyysis kasutada. SELECT IF (T614=1 AND T713=1). *---------------------------------- * Yhe tunnuse analyys (harj5). FREQUENCIES /VARIABLES T615 /HBAR /STATISTICS ALL. The raw data or transformation pass is proceeding 33 cases are written to the uncompressed active file. ***** Memory allows a total of 15222 Values, accumulated across all Variables. There also may be up to 1903 Value Labels for each Variable. ------------------------------------------------------------------------------- Page 3 SPSS/PC+ 6/12/ 2 T615 Tingimused soodustaksid head tood Valid Cum Value Label Value Frequency Percent Percent Percent 1 28 84.8 84.8 84.8 2 5 15
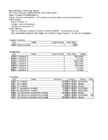
0 170 140 440 Sihifunktsioon z= 21450 (Answer report) Antud tulemustest on näha, et optimaalne on toota villaseid sokke, salle Tooteid on antud lõngaga võimalik valmistada vastavalt villaseid sokke(x2) 170 tükki 440 tükki. Ettevõtte kasum on sellise tootmise puhul 21450 Seejuures kulutatakse ära jääb üle 97 kg. (Sensivity report) Antud tabeli rida(variable cells: final value) näitab, kui palju on optimaaln villaseid sokke 170, salle 140 ja kampsuneid 440. Seejuures kulub (constraints: final valu lõnga 400 kg ja D lõnga 120 kg. Aruandest on näha, et kui käpikute hind tõuseks 8,3€ kui villaste sokkide hind tõuseks kuni 11,4€, salli hind langeks kuni 12,5€ ja kampsun kogused samaks. (Sensivity report) Antud tabeli rida(variable cells: final value) näitab, kui palju on optimaaln villaseid sokke 170, salle 140 ja kampsuneid 440
Regression 1 7,797748 7,797748 3108,303 1,3E021 Residual 18 0,045156 0,002509 Total 19 7,842905 Coefficients Standard Error t Stat Pvalue Lower 95%Upper 95% Lower 95,0% Upper 95,0% Intercept 0,02403 0,023267 1,03285 0,315351 0,07291 0,024851 0,07291 0,024851 X Variable 10,02166 0,000388 55,7522 1,3E021 0,02247 0,02084 0,02247 0,02084 SUMMARY OUTPUT Regression Statistics Multiple R 0,997434 R Square 0,994874 Adjusted R Square 0,994589 Standard Error 0,040604 Observations 20 ANOVA df SS MS F Significance F Regression 1 5,760008 5,760008 3493,664 4,5E022 Residual 18 0,029677 0,001649 Total 19 5,789684 Coefficients
NOT, REM, &, AND, XOR, 59. Mis juhtub processiga, millel puuduvad sensitivity listis signaalid ning wait processi sees? Jääbki ootama. 60. Mis kasu on nihketehetest arvutamise juures? Nihe MSB poole võrdub korrutamisega ja nihe LSB poole võrdub jagamisega. 61. Loo antud koodi kohta tõeväärtustabel: ENTITY paar_k IS GENERIC (n : INTEGER := 7); PORT (input: IN BIT_VECTOR (n DOWNTO 0); output: OUT BIT); END paar_k; ARCHITECTURE Behavioral OF paar_k IS BEGIN PROCESS (input) VARIABLE temp: BIT; BEGIN temp := '0'; FOR i IN input'RANGE LOOP temp := temp XOR input(i); -- temp := temp NOR input(i); END LOOP; output <= temp; END PROCESS; END Behavioral; Input = “10100100”; Input(i) f 0 1 0 1 1 0 0 1 0 1 1 0 0 1 1 0 62. Loo antud koodi kohta tõeväärtustabel: ENTITY paar_gene IS GENERIC (n : INTEGER := 2); PORT ( input: IN BIT_VECTOR (n-1 DOWNTO 0);
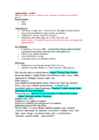
paberil andmed juhendid tlu.ee/~kairio - tarkvara variable view- tunnus tulpasid ei saa ümber järjestada decimalt-komakohad type- numbreid sisestame label - diagrammide jne pealkiri, kui jääb tühjaks siis võtab nime lahtri (value labels- num,brid või kirjeldused) variable vaates saab copyda tervet rida need vastused kus saab vastata mitut vastusevarjanti siis lähevad need kõik erinevateks küsimusteks jah-ei, 1-0 type-string - laius oluline tühjad lahtrid on puuduvad vastused - system missing , 9 99 ERISTADA PUUDUVAID VASTUSEID Andmed on kogutud veebipõhiselt ning need tuleb SPSS-i üle tuua. 1. reas nimed, altes 2. reast andmed 2. exeli fail vaja kinni panna 3. pspp-vabavara, milles saab avada spssi ka
Tootmine ja kulud TP (total product, koguprodukt) on teatud perioodi jooksul valmistatud toodang (Q). TP=Q TC(total cost, kogukulud) on kõikide antud hüviste valmimiseks vajalike tootmistegurite ostmiseks tehtud kulutuste summa. Kogukulu on firma püsi- ja muutuvkulude summa antud tootmistasemel. TC=FC+VC VC(variable cost, muutuvkulud) on kulud, mille suurus muutub, kui firma tootmismaht muutub. FC(fixed cost, püsikulud) on kulud, mille suurus lühiperioodil ei muutu, sest ka püsiressursside suuurus ei muutu, kui firma muudab oma tootmismahtu. TR(total revenue, kogutulu) on tulu, mida firma saab oma toodangu müügist. Võrdub müügikoguse ja ühiku hinna korrutisega. TR=p*TP AP (average product, keskmine produkt) - on koguprodukti hulk muutuvressursi ühiku kohta
ümmardades 15 025 krooni Kas keegi ostaks! - Ilmselt ostaks kui konkurendid ei pakuks madala hinnaga. Kust kärpida kulusid? 1. Otsida odavam lennukompanii? 2. Otsida odavam lennujaam? 3. Kasutada oma firmale kuuluvaid majutusettevõtteid sihtkohas? 4. Maksta reisisaatjale, reisifirma esindajale vähem palka? 5. Tegevuskulud viia 4%-le. 6. Kasum 6%-le. Teine variant Kasutades tabeltöötlusprogrammi abi., kus määratakse reisi kindlad (fixed cost) ja muutuvad kulud (variable cost) Kindlad kulud fixed cost Kindel kulu on selline, mis ei sõltu grupi suurusest, vaid mis tuleb tasuda igal juhul. Palgakulud Transpordikulud (näiteks bussireisi puhul) Muutuvkulud variable cost Muutuvkulu sõltub reisijate arvust. Iga muudatus reisijate arvus põhjustab muudatuse reisi hinnas. Kuna tulenevalt reisijate arvu ei ole võimalik ette määrata, võetakse arvukuse aluseks mõistlik reisijate hulk ja selle aluseks leitakse hind ühe reisija kohta.
APS Average propensity to Средняя склонность к Keskmine säästmise save сбережению kalduvus AR Average revenue Средний доход Keskmine tulu AS Aggregate supply Совокупное предложение Kogupakkumine ATC Average total cost Средние общие затраты Keskmine kogukulu AVC Average variable cost Средние переменные Keskmine muutuvkulu затраты C Consumption expenses Затраты потребления Tarbimiskulutused c Marginal propensity to Средняя склонность к Tarbinise piirkalduvus consume потреблению CPI(THI) Consumer Price Index Индекс потребительских Tarbijahinnaindeks
What is the law of diminishing returns? Why this proposition is called a "law"? It states that, at some point- when we add more variable input to a fixed input- our marginal product will start to decrease as the newly added variable input is being added to an already increasingly scares input. This can be explained by citing an example, if we add more workers to a job, such as assembling a car. At some point, adding more workers would cause problems, as they would be getting in each other's way, or workers wold often find themselves waiting for access to specific part or tool required for the job. This proposition is called a law because it is standardized and applicable on all the production processes
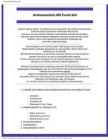
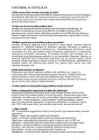
Electrical engineers typically hold a degree in electrical engineering or electronic engineering. Getting into engineering school takes good grades in math and science. Students also need courses in English, social studies, and computers. Engineers should be creative, curious, logical, and detail-oriented. They should also be able to work as part of a team. What do electrical engineers do? Electrical engineers work in a very wide range of industries and the skills required are likewise variable. These range from basic circuit theory to the management skills required of a project manager. The tools and equipment that an individual engineer may need are similarly variable, ranging from a simple voltmeter to a top end analyzer to sophisticated design and manufacturing software. Electrical engineering in Estonia Contactus AS is well known Estonian leading electrical design company in Estonia. In addition to Estonia, they have designed electrical parts to buildings in
Oma 4.9213636 23.7 Kesk. 64 21.578462 30.5 'equal' või 'unequal' unequal t-Test: Two-Sample Assuming Unequal Varia 29.25 P-väärtus 6.52E-051 24.25 Jah või ei jah Variable 1 Variable 2 25.6 Mean 21.57846 4.921364 17 Variance 16.30719 7.352315 17.5 Observatio 65 110 19.55 Kesk. tava 19.809091 Hypothesiz 0 20.75 Kesk.elek. 19
2. Teha juurde uus veerg x3 jaoks (x2 kõrvale) ja kopeerida labor 3 sheet2-lt uus vektor, mis ei lange kokku eelnevatega. Arvutada uued y väärtused (x3 ka sisse arvutada). (Tase 1, r1,2; r1,3 = 0) 3. Teostada regressioonanalüüs (Excel). 4. Märgistada ära piirkond: x1, x2, x3 ja y ja teha Kopeeri. 5. Avada STATGRAPHICS DEMO. Andmete sisestamiseks märkida ära: Analyze Existing Data In the Windows Clipboard Variable Names: from first row . Algandmete tabel ilmub ekraanile. 6. Menüüst SPECIAL - Advanced regression - Ridge Regression ja anda ette andmed: Dependent Variable: y Independent Variable: x1, x2, x3 ja teostada arvutused (vastata OK). 7. Ridge Regression'i nupurea nupuga 'Tabular Options' käivitada menüü ja valida Regression Coefficients: tekivad tabel ja graafik.
Turnover in money = sales level, average sales price per unit x total number of units sold. VAT (Value Added Tax) 9%. Landed cost: a special case The total of: purchase price, shipment costs, insurance, customs clearance costs. Break even point gives the relationship between costs, turnover and profit/margin. Costs: - fixed costs: these are costs that do not vary with the change in sales. - variable costs - contribution: the amount of money per product sold that contributes to covering the fixed costs (sales price -/- variable costs per product). Example: product X Estimated sales 5,000 units per annum Variable costs 2,000 per unit Fixed costs 2,000,000 per annum Sales price 3,000 per unit What is the break even point in items? 2000000/(3000-2000)-2000 units. Lecture 4: Marketing
Cost assignment is a general term that encompasses both tracing direct costs and allocating indirect costs. Factors affecting direct/indirect cost classification: Materiality of the cost in question - the smaller the amount of cost, the more immaterial the cost is, the less likely that it is economically feasible to trace the cost to a particular cost object. Available information-gathering technology. Design of operations. Variable cost changes in total in proportion to changes in the related level of total activity or volume. Fixed cost remains unchanged in total for a given time period, despite wide changes in the related level of total activity or volume. Cost driver is a variable, such as the level of activity or volume, that causally affects costs over a given time span.
All Constraints and optimality conditions are satisfied. Solver Engine Engine: Simplex LP Solution Time: 0,094 Seconds. Iterations: 1 Subproblems: 0 Solver Options Max Time Unlimited, Iterations Unlimited, Precision 0,000001, Use Automatic Scaling Max Subproblems Unlimited, Max Integer Sols Unlimited, Integer Tolerance 1%, Assume NonNegati Objective Cell (Max) Cell Name Original Value Final Value $B$14 Sihtfunktsioon Z 0 3818.75 Variable Cells Cell Name Original Value Final Value Integer $B$10 Muutujad x1 0.00 0.00 Contin $C$10 Muutujad x2 0.00 58.75 Contin $D$10 Muutujad x3 0.00 0.00 Contin $E$10 Muutujad x4 0.00 0.00 Contin Constraints Cell Name Cell Value Formula Status Slack $K$10 Vatt 117
kompositsiooniviga Fallacy of composition Композиционные ошибки Positiivne tõus Positive slope Положительный наклон Verikaalne ja horisontaalne Infinite and zero slopes Вертикально и горизонтально Vertikaalne kõver Vertical intercept вертикально Sõltuv muutuja Dependent variable Зависимая переменная Otsene seos Direct relationship Прямая связь abtsisstelg Horizontal axis Ось – горизонтальная, абцисса Sõltumatu muutuja Independent variable Независимая переменная Pöördvõrdeline sõltuvus Inverse relationship Обратная зависимость
jn) - valid mille puhul tahad uurida - Options - valid milliseid väärtusi leida tahad ja ok, vastused ilmuvad OutPuti aknasse. Charts all on võimalik kasutada histogrammi joonistamise võimalust. Joonisel olev küsimärk käib osutatud linnukese kohta. Display frequency tables annab käskluse moodustada iga pikkuse kohta sagedustabel. Küsimärk on juurde tehtud, et uurida, kas sellise tabeli koostamine on vajalik. Uue muutuja arvutamine: Transform - Compute variable - kirjutad uue lahtri nimetuse (tühikuid ei kasuta) - liidad mida vaja liita (võrdusmärki pole vaja) Kehamassiindeks=Kaal kg'des jagadtud pikkus cm'tes ruudus (Pikkus x Pikkus) Andmete eraldamine: Data - select cases - If condition is satisfied ette linnuke - klikid If...-le - valid nt ainult meeste tulemuste saamiseks vasakult Sugu, siis = ja 1 (sest 1=mees ja tahan ainult meeste tulemusi) ja continue.
Ülelaadimisrõhu kasvades rõhuandur suleb täituris oleva klapi, mistõttu süsteemis rõhk kasvab ja ületab möödavooluklapi täituri vedru vastumõju ning möödavooluklapp avaneb. Alljärgnevalt esitatakse turbokompressori kolm ehitusprintsiipi, mis on kasutusel autotehnikas, need on a) heitgaaside möödavooluklapiga varustatud turbolaadur (sks/ingl Wastegate/Lader); b) muutuva turbiinigeomeetriaga VTG turbolaadur (sks Variable Turbinengeometrie); c) muutuva siiberturbiiniga VST turbolaadur (sks Variable Schieberturbiine). Heitgaaside möödavooluklapiga varustatud turbolaadur Suurtel mootori pöörlemissagedustel ja koormustel lastakse osa heitgaase bypassklapi kaudu enne turbiini otse väljalasketorustikusse. Selle tõttu väheneb turbokompressori pöörlemissagedus ja ülekoormus. Madalatel pöörlemissagedustel ja koormustel hoitakse heitgaaside mööduvooluklapp suletuna.
Anthem · England does not have an official designated national anthem, as the United Kingdom as a whole has " God Save the Queen". However, the following are often considered unofficial English national anthems: · "I Vow to Thee, My Country" · "Land of Hope and Glory" · "Nimrod" · "Jerusalem" · "Heart of Oak" Climate · England has a temperate climate, with plentiful rainfall all year round, although the seasons are quite variable in temperature. However, temperatures rarely fall below -5 °C (23 °F) or rise above 30 °C (86 °F). Ethnic groups (2006) · 89% White 6% South Asian 3% Black 2% Mixed race 1% Chinese 1% Other Map of England The end
Solver Engine Engine: Simplex LP Solution Time: 0,078 Seconds. Iterations: 8 Subproblems: 0 Solver Options Max Time Unlimited, Iterations Unlimited, Precision 0,000001, Use Automatic Scaling Max Subproblems Unlimited, Max Integer Sols Unlimited, Integer Tolerance 1%, Assume NonNegative Objective Cell (Max) Cell Name Original Value Final Value $J$28 Kasum arvutuslik 0 30050 Variable Cells Cell Name Original Value Final Value Integer $C$29 X väärtused A 0 200 Contin $D$29 X väärtused B 0 0 Contin $E$29 X väärtused C 0 1200 Contin $F$29 X väärtused D 0 750 Contin
Slovene Capital is Vienna Location Located in heart of Europe Czech Republic and Germany (North) Italy and Slovenia (South) Slovakia and Hungary (East) Switzerland (West) Transport Round trip Airplane (600 EUR) Bus ( 400 EUR ) Car ( 200 EUR ) Accommodation in Vienna Hotel Beim Theresianum 3*** (100EUR) Hotel Mercure Imlauer Nestroy 4****(200EUR) Vienna Grand Hotel 5***** (One day 305 EUR) Weather Variable Snow in the Alps Sunny in Vienna o January 5 o July 30 Activities Skiing Snowboarding Coneing Trip in Alps IceSkating Places Cities (Salzburg) Museums Abbeys Waterfalls Parks Mountains Alps Beautiful rivers Necessary equipment Winter clothes Summer clothes Skies Snowboard Bicycle Party clothes Sights Vienna Salzburg Alps Food Soup Fish Potatoes Meat Opinion Funny Interesting Sporty Glamorous
Juhtimisarvestus ja monitooring … … on läbi kommunikatsiooni toimuv sotsiaalselt konstrueeritud, situatsiooniline, (dünaamiline) protsess eesmärgiga tekitada organisatsiooni liikmete poolt sarnaselt mõistetud organisatsioonilist tegelikkust ja koordineerida ning mõjutada nende tegevusi nii, et need viiksid kokkulepitud eesmärkide saavutamisele. Kulude, tegevusmahu ja kasumi vaheliste seoste analüüs. • muutuvkulud (variable cost) on kulud, mis olulisuse vahemiku piires kasvavad või kahanevad proportsionaalselt koos toodangu mahu muutumisega. • püsikulud (fixed cost) on kulud, mis jäävad olulisuse vahemikus toodangu mahu muutumisel konstantseks, nad eksisteerivad ka siis, kui toodang (või tegevuste hulk) kõnealusel perioodil on null. KOGU MUUTUVKULU ÜHIKU MUUTUVKULU KOGU PÜSIKULU ÜHIKU PÜSIKULU Tinglikult püsivad kulud kui Tinglikult püsivad kulud üldistatuna
In most cases the demand relationship is based on an inverse or negative relationship between the price and quantity of a good purchased. The nature of the "demand function" depends on the nature of the good considered and the relationship being modeled. In most cases the demand relationship is based on an inverse or negative relationship between the price and quantity of a good purchased. · The demand function is a model that "explains" the change in the dependent variable (quantity of the good X purchased by the buyer) "caused" by a change in each of the independent variables. · Since all the independent variable may change at the same time it is useful to isolate the effects of a change in each of the independent variables. · To represent the demand relationship graphically, the effects of a change in PX on the QX are shown Change in demand
27 typically used doses. Ordinary consumption has low health risks, even when carried on for 28 years there may be a modest protective effect against some diseases, including Parkinson's 29 disease, heart disease, and certain types of cancer. Some people experience sleep disruption if 30 they consume caffeine, especially during the evening hours, but others show little disturbance 31 and the effect of caffeine on sleep is highly variable. 32 Caffeine is quickly and completely removed from the brain. Its effects are short-lived and it 33 tends not to negatively affect concentration or higher brain functions. However, continued 34 exposure to caffeine leads to developing a tolerance to it. Tolerance causes the body to become 35 sensitized to adenosine, so withdrawal causes blood pressure to drop, which can result in a 36 headache and other symptoms. Too much caffeine can result in caffeine intoxication, which is
Shake roof · Very old history · Made by pine, spruce and aspen. · Size: 80mm broad, 3mm thick from the top and 15 mm thick from the bottom, the lenght is different. · Different styles ( sharp, rounded and slanting ends ) · Lasts 30 years. · The slope of the roof must be at least 25° Chip roof · Its comes from in Estonia 18. century · Mades by spruce and aspen · Sizes: 500mm tall, 5-7 mm thick and width is variable · 3 layers of chips · Average life is 10 years · The slope should be 20 degrees · The chips install perpenticualar to the eaves. Board roof · Its popular in outbuilding roofs (barn or shed) · Mades by pine and spruce. · Two different installation styles: Perpenticular to the eaves Parallel to the eaves Sizes are different, we can use for all sizes. We should be maintanance the roof once a every 5 years.
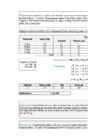
Kahe üldkogumi keskväärtuste võrdlemine teadaolevate dispersioonide korral Kahe üldkogumi keskväärtuse võrdlemine teadaolevate dispersioonide korral on võimalik MS Exceli protseduuriga z-Test: Two Sample for means (Tools -> Data Analysis). Protseduuril tuleb ette anda mõlema valimi andmete blokid (Variable 1 Range ja Variable 2 Range); oletatav keskväärtuste erinevus (vaikimisi null) - Hypothesized Mean Difference; anda ette mõlema valimi teadaolevad dispersioonid (Variable 1 Variance (known) ja Variable 2 Variance (known)); kui andmete blokid sisaldasid esimeses reas/veerus nime, tuleb teha
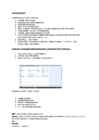
1. PRAKTIKUM 1) JÄRJESTAMINE NOOREMAST VANIMANI Parmeklõps Sort Ascending/Descending -> Kasvavas/Kahanevas järjestuses Data Sort cases Sort Ascending/Sort Descending (tuleb valida muutujad ka) 2) VARIABLE VIEW 3) KIRJELDAVAD ANDMED Leiame vanusele antud hinnangute keskmise, moodi, mediaani, maksimaalse ning minimaalse hinnangu. + HISTOGRAMM Käsklusrida: Analyze - Descriptive statistics Frequencies. Muutujatekasti liigutage muutuja. Statistics -Mean, Mode, Median, Minimum, Maximum. Charts - Histograms 2. PRAKTIKUM 1) UUE MUUTUJA ARVUTAMINE Tihtipeale tuleb andmete töötlemise jooksul tekitada uusi muutujaid eelmiste
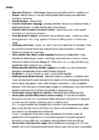
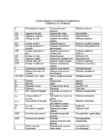
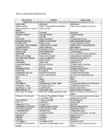
........................................efektiivne palk 160. Elastic demand ...............................................elastne nõudlus 161. Elastic supply .................................................elastne pakkumine 162. Employee .......................................................töötaja 163. Employer .......................................................tööandja 164. Employment rate ...........................................tööhõive määr 165. Endogenous variable .....................................endogeenne muutuja 166. Endorsement ..................................................toetus, heakskiit 167. Energy resources ............................................energiaressursid 168. Engel curve ....................................................Engeli kõver 169. Entitlement ....................................................õiguspärasus 170. Entrepreneurship ............................................ettevõtlus 171
Weather in England Britain is an island country and the surrounding sea gives England a varied climate. The main influence on climate is close proximity to the Atlantic Ocean, that's why the climate of England is classified as oceanic climate , with warm summers, cool winters and much rain throughout the year. As Britain have such a variable climate changing from day to day, it is difficult to know what weather will be on next day. In general there are warm summers and cool winters. Summers are cooler than those on the continent, but the winters are colder. Eastern parts are drier, cooler and less windy. Northern areas are generally cooler, wetter and have a smaller temperature range than southern areas. The highest temperature in England was 38.5 degrees at 10th August 2003. Winters are cool, wet and windy
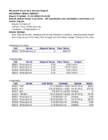
tarkvaraprogrammi Gretl Lisa 6. Korrelatsioonikordajate statistilised olulisused (p-väärtused) Brutopalk Linlased Korgharitud Mehed D1 D2 D3 - 0.1039 0.0008 0.3090 0.0000 0.0406 0.0635 Brutopalk Allikas: autorite koostatud kasutades Statistikaameti andmeid ja tarkvaraprogrammi Gretl Lisa 7. Esialgne hinnatud mudel esialgne mudel:OLS, using observations 1-60 Dependent variable: Brutopalk Coefficient Std. Error t-ratio p-value const 596,186 117,582 5,0704 <0,00001 *** Korgharitud 692,69 116,103 5,9662 <0,00001 *** Linlased 10,306 40,4515 0,2548 0,79988 Mehed -128,634 214,023 -0,6010 0,55038 DAasta_1 -223,719 16,4078 -13,6349 <0,00001 ***
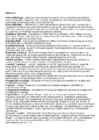
Residual 14 4,793920222 0,342423 Total 15 21,474375 Upper Coefficients Standard Error t Stat P-value Lower 95% 95% Intercept 3,902516762 0,531490252 7,342593 3,66132E-06 2,762583548 5,04245 X Variable 1 0,409323758 0,05864681 6,979472 6,45445E-06 0,283538861 0,5351087 27) Kuna P value on väiksem kui 0,05 siis regressioonvõrrand on usaldatav. 28) Saadud võrrandi jääkstandardhälve on 0,59m. Kõrguse standardhälve on1,20m. Jääkstandardhälve e. prognoosiviga iseloomustab funktsioontunnuse erinevust regressioonijoonest. 29) Determinatsioonikordaja on 0,77676. R2- determinatsioonikordaja iseloomustab, kui suur osa iseloomustab seose tugevust.
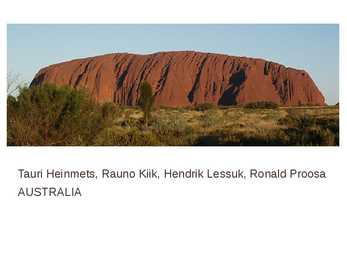
Social welfare Life expectancy in Australia in 2006 was 78.7 years for males and 83.5 years for females Australia has one of the highest proportions of overweight citizens Australia has the highest rates of skin cancer in the world, while cigarette smoking is the largest preventable cause of death and disease Age pension is available to men aged 65 Women currently become eligible for the Age pension at 63 years and 6 months the peculiarities Because of the continent's great age, extremely variable weather patterns, and long-term geographic isolation, much of Australia's biota is unique and diverse. Kangaroo, koala, wombat, emu, kookaburra, eucalyptus, dingo Australia is the driest inhabited continent on earth
small classes 3. Small and regular classes help higer- and lower- achieving students similary Method Empirically Validity of Project STAR Compromise 1. Switching of students among class types in grade 1,2, and 3. 2.Student attrition between kindergarden and grade. 3. Overlap in actual sizes among different typs of classes. Analysis 1.Involved differences in achievement variability and hence the outcome variable was the variability in achievement in each classroom. 2. Involved differences in achievement between studente in small and regular classes at the upper and lower tails of the achievement distribution Results Small Classes and Achievement Variability Achievement variability in small classes was larger than in regular classes. Mathematics Reading Conclusion All type of students benefited from being in
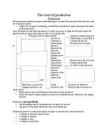
Muutujad võivad omada erinevaid väärtusi, st. nad pole kõikidel inimestel sama väärtusega (nagu kaal) või pole samal inimesel kogu aeg sama väärtusega (nagu vanus). Muutuja vastandiks on konstandid, mis on kõikide inimeste või ühiskondade jaoks kogu aeg sama väärtusega (nagu Maa gravitatsioon) ja mida pole seega sotsioloogilise uurimuse käigus mõtet mõõta. Muutujate tüübid: 1) sõltumatu muutuja (independent variable) muutuja mis uurija hüpoteesi järgi mõjutab mingit teist uuritavat muutujat, aga pole ise ühegi uuritava muutuja poolt mõjutatud; 2) sõltuv muutuja (dependent variable) muutuja mis on uurija hüpoteesi järgi mingi teise uuritava muutuja poolt mõjutatud, aga ise ühtegi teist uuritavat muutujat ei mõjuta. SÕLTUMATU MUUTUJA SÕLTUV MUUTUJA
joone kumerus ja nõgusus. 1.Ekstreemumid ja monotoonsuse piirkonnad (kasvav, kahanev). 2 3 <-funktsioon f ( x) := 2 - 3 x - x d 2 <-tuletis f ( x) -3 x - 6 x dx 2 -6 x - 3 x <-tuletis väljakirjutatult (selekteeri x, Symbolics->Variable->Solve) 0 - 2 <-ekstreemumid d t( x) := f ( x) dx <-märgi ära et t(x) on tuletis f(x) t ( -2) 0 f ( -2) -2 <-kontrollime ja arvutame funktsiooni
aswell things, people tend to get lost too. Some are found and alive, but some are not, and it´s a tragedy. I can´t imagine losing a beloved one, it would be awful, but so many of us have to face this terrible situation, where you don´t know if the person is safe and alright. As always, there are situations where the person doesn´t want to be found, or where she/he disappears without a trace. The reasons of disappearing are very variable, from criminal cases, trafficking in human beings, getting recruited as prostitutes to very hidden and deeply personal matters. The average amout of missing people in Estonia is 199 persons per year, although 70% of the missing persons in 2001-2005 were found alive, luckily. In 2007, night before 24th of June, a 19 year old girl Maris Järve was lost in Pärnu, she was last seen at 2.30 am at the beach promenade, and no one has heard anything about her ever since
Microsoft Excel 14.0 Sensitivity Report Worksheet: [Vihik1]Leht1 Report Created: 11.11.2013 19:02:31 Variable Cells Final Reduced Cell Name Value Gradient $C$33 Muutujad x1 11,111111111 0 $D$33 Muutujad x2 27,777777778 0 $E$33 Muutujad x3 16,666666667 0 $F$33 Muutujad x4 22,222222222 0 Constraints Final Lagrange Cell Name Value Multiplier $I$33 Õunad 305,55555556 0
varieeruvad ühest situatsioonist teise),on valdkondikus probleemid tekivad. Näiteks, kui sõltumatu muutuja on subjekti muutuja, on alati oht,et see onseotud mõnel süstemaatilisel moel mõne muu subjekti muutujaga. Kui see on tõsi, võib iga eksperimentaalne tulemus võlgneda tänu teisele subjekti muutujale, mis on tahtmatult esitatud, enam, kui uurija seda ise nö.sisse tõi. Seda probleemi kutsutaksegi``subject variable-subject variable confound``, mida defineeritakse ka kui potensiaalseid eksitulemusi, mis on omistatud tänu subjekti muutujate ühinemisele või segiajamisele. Antud juhul kasutati läbiviidava testi raames segiajamise välistamiseks alkojoobe mõõtmist alkomeetriga. Muudel juhtudel võiks mis iganes teste ja nende läbiviimist teostada reliaabluse huvides ka keskkonnas, kus ehk testides osalemine on tavapärane tegevus ega eelda mingeid kontekste, mille käigus võiks täheldada vastajate
-- ja U2 - U4 tulemused (hetkel ainult U2) LED-ide 6,4,2,0 peale U1: f_system port map (sw(2), sw(1), sw(0), led(7), led(5), led(3), led(1)); U2: f_system port map ( sw(2), sw(1), sw(0), led(6), led(4), led(2), led(0)); --U3: f_system port map ( sw(2), sw(1), sw(0), led(6), led(4), led(2), led(0)); --U4: f_system port map ( sw(2), sw(1), sw(0), led(6), led(4), led(2), led(0)); Tallinn 2017 Tõeväärtustabel process (x1, x2, x3) variable in_word: std_logic_vector (2 downto 0); --defineerime sisendi ja suuruse variable out_word: std_logic_vector (3 downto 0);--defineerime väljundi ja suuruse begin in_word := x3 & x2 & x1; --defineerime sisendite järjekorra case in_word is when "000" => out_word := "0000"; --antud failis defineerisime oma when "001" => out_word := "0010"; --tõeväärtustabeli, mille järgi saame
palju targemaks saada. Referaatis loodan teada saada mis see VTEC tegelikult ikka on? 2 VTEC VTEC on nii elektrooniline ja mehhaaniline süsteem honda mootoritel, mis lubab mootoritele tõhusalt omada mitud nukkvõlli. VTEC tehnoloogia on välja arendatud Honda poolt ning lõpuks paistab olevat leitud asendus mootori töömahu suurendamisele. Honda esimeseks VTEC-iga (Variable Valve Timing and Lift Electronic Control) varustatud autoks oli 1988 aastal 1,6-liitrine 4-silindriline Civic CRX. VTEC-i tööpõhimõte on lihtne - selle asemel, et valida madalapöördelise ja ökonoomse mootori (mis kõrgetel pööretel ei suuda midagi) või kõrgetel pööretel võimsa rallimootori (mis kulutab madalatel pööretel palju kütust ning omab all lahjat pöördemomenti) vahel, otsustas Honda ehitada kaks mootorit ühe sisse, mille
t mudel on statistisliselt oluline. Tabel 5. Mudeli olulisus. ANOVAa Model Sum of Squares df Mean Square F Sig. Regression 6225810,552 3 2075270,184 88,141 ,000b 1 Residual 1271430,828 54 23545,015 Total 7497241,379 57 a. Dependent Variable: kulu_riided_jalanoud b. Predictors: (Constant), töötus, kaalutud_hinnad_HICP, SKP_pc Tabel 6. Sõltumatute muutujate olulisus ning tolerance ja VIF näitajad. Coefficientsa Mudel Standardiseerimata Standardise t Olulisus Kollineaarsuse statis koefitsendid eritud
-64 in 16-bit binary is 1111 1111 1100 0000 00000000 01111001 + 11111111 10111001 --------------------------- 11111111 11000000 b) -70 – 88 = -158 11111111 10111010 - 00000000 01011000 ------------------------- 11111111 01100010 5. Calculate the following without converting the number base. Show calculations. 3A916 + 24D16 = 5F616 3A9 + 24D --------- 5F6 9 + D = 16 A+4+1=F 3+2=5 6. Variable X contains the number of bytes to be read from an external device. Using a binary shift, write one line of pseudocode to calculate the number of bits to be read and store the result in Y. 1 byte = 8 bits Shift left = X ∗ 2𝑛 , where n stands for how big the shift is. 23 = 8, so we have to shift left by 3. Y = X shl 3 // shifts left by 3 bits, filling the empty bits on the right with zeros 7. You have two Boolean variables A and B. Write down a logic expression using only the
equivalents and convert the result to hexadecimal. a) 011010112 b) 101101012 === 3. a) 006B b) FFB5 === Logic and arithmetic 4. Using two’s complement arithmetic, calculate the following (choose a suitable number of bits for the representation): a) 121 – 185 b) -70 – 88 == 4. Convert back to verify answer == 5. Calculate the following without converting the number base. Show calculations. a) 3A916 + 24D16 == 5. 5F616 == 6. Variable X contains the number of bytes to be read from an external device. Using a binary shift, write one line of pseudocode to calculate the number of bits to be read and store the result in Y. == 6. Y = X shl 3 // shifts left by 3 bits, filling the emply bits on the right with zeros (3 bits) == 7. You have two Boolean variables A and B. Write down a logic expression using only the operators AND, OR and NOT that will evaluate to true if A and B are equal and to false otherwise. == 7
Import on välismaal toodetud kaupade sisseostmine kodumaiseks kasutamiseks. Puhaseksport puhasekspordiks nimetatakse impordi ja ekspordi vahet, on SKP osa. Inflatsioon (Tarbija Hinna Indeks)on hindade tõus, millega kaasneb raha ostujõu langus. Tööviljakus ehk tööjõu tootlikkus on toodangu hulk ajaühikus ühe töötaja kohta. Püsikulud fixed costs kulu, mis jääb muutumatuks, sõltumata toodangu mahust. Muutuvkulud variable costs toodangumahust sõltuv kogutulu osa. Mastaabisääst economies of scale, keskmise tootmiskulu alanemine suurtootmise tagajärel.
üheaegselt rahuldab mõlema firma jaoks järgmist tingimust: antud firma tootmiskogus o parim valik teise firma tootmiskoguse puhul ja see kogus maksimeerib firma kasumi teise firma poolt valitud tootmiskoguse korral. Eelarvejoon – Eelarvejoon (budget line) näitab kõiki hüviste kogumeid, mis on tarbijale kättesaadavad antud hindade taseme ja sissetuleku korral. Eksogeenne muutuja – Eksogeenne muutuja (exogenous variable) on selgitav ehk mudeliväline muutuja Elastsus – Elastsus (elasticity) on tarbijate ja tootjate reageerimistundlikkust iseloomustav näitaja. Endogeenne muutuja – Endogeenne muutuja (endogenous variable) on selgitav ehk mudelisisene muutuja. Engeli kõver – Engeli kõver (Engel curve) näitab hüvise optimaalseid nõutavaid koguseid sissetuleku eri tasemete korral (ceteris paribus). Tuletatakse sissetuleku- tarbimise kõverast
avaneb sisestusaken, milles saab määrata funktsiooni y väärtuste ploki (Input Y- Range), argumendi x väärtuste ploki (Input X Range), usaldusnivoo (Confidence Level) ja selle koha, kuhu tulemused väljastatakse (Output options). Regressioonanalüüsi protseduuri rakendamise tulemusena tekib kolm tabelit, millest viimases on antud vabaliige (Intercept) koos oma standardmääramatusega (Standard Error) ja sirge tõus (X Variable) koos oma standardmääramatusega. Graafik tuleb teha eraldi – eelneva protseduuriga graafikut ei joonestata.
tulemustele?/ Kooli hoolekogu hinnang eelmise aasta juhtimisele?) , hulk (n: minu klassi avatakse), vanus (keskmine vanus), kui kaugel asub kool millestki- km-tes, Nimitunnus- millegi nimi, huviringude nimed, kooli nimi jne, kas koolis töötab nõustaja- ei tööta, töötab, mõlemad jne, Kiire ülevaade, palju on vastanud väärtusi: Analyse→Missing Values Analysis paremklõps tunnusele: display Variable Names/Display variable Labels→tõstan vajamineva (N. Brutopalk) paremale väljale→ok! Mean- keskmine Sugu- mõistlik viia kategoriaalsele väljale- alumine siis (vahet väga palju pole) Vanus: mingi osa ei vastanud- asendan missing →x (katusel kriips) Asendatakse puuduvad vastused keskmisega: Transform→ replase missing values- (series mean-võetakse kõik andmed) Vahemike loomine: transform→recode into different variables/visual binning? ....: analyse→descriptive statistic→frequncies