http://hdr.undp.org/en/data/map/ 1) Kuulub religiooni Okeaania 2) Võrdle oma riigi ja regiooni inimarenguindeksi arengut. Näiteks Uus Meremaa HDI rank on 7 ja HDI value on 0,902 mis on väiksem kui Austraalias 3) Võrdle oma riigi ja Eesti riigi arengutaseme näitajaid. Eestis on HDI rank 38 ja HDI value 0,818 rank on kyll suurem aga value on väiksem 4) Võrdle oma riigi ja Eesti riigi väikelaste suremust (Under-five mortality) ja SKT 1 inimese kohta [GDP per capita (PPP US$)]. Kasuta ülamenüüst Database või Indicators valikut. Under-five mortality (per 1,000 live births) 1960 1970 1980 1990 2000 2005 2006 2007 2008 2009 2010 Australia .. .. .. 9 6 6 .. 6 6 .. .. Estonia .. .. .. 18 11 7 .. 6 6 .. ..
Education in Russia Table of contents Compulsory school years School stages Grading system PISA results GDP investment Literacy rate in the country Interesting facts about rules and regulations Compulsory school years Eleven-year secondary education in Russia is compulsory A student of 15 to 18 years of age may drop out of school with approval of his/her parent and local authorities Students with multiple violations may be kicked out of school at starting age of 15 School stages kindergarten (age 3 to 7) elementary (years 1-4) middle (years 5-9)
Gross Domestic Product (GDP) The gross domestic product (GDP) or gross domestic income (GDI) is a measure of a country's overall economic output. It is the market value of all final goods and services made within the borders of a country in a year. It is often positively correlated with the standard of living, alternative measures to GDP for that purpose. · Gross domestic product comes under the heading of national accounts, which is a subject in macroeconomics. Gross National Product Gross national product (GNP), in economics, a quantitative measure of a nation's total economic activity, generally assessed yearly or quarterly. The GNP equals the gross domestic product plus income earned by domestic residents through
Majanduslik Eesti (Estonia) Argentiina Keenia (Kenya) näitaja (Argentia) Liberaalsuse aste 6 koht 69 koht 86 Koht (Economic freedom) Indeks:3,2 Indeks:2,05 Indeks:1,9 SKP suurus (GDP $22.5 billion (2011) $435.2 billion (2011) $36.1 billion (2011) official exchange rate) SKP per capita $20,200 (2011) $17,400 (2011) $1,700 (2011) (GDP per capita) SKP ostuvõime $26.93 billion (2011) $709.7 billion (2011) $71.5 billion (2011) alusel (GDP purchasing power parity) Gini indeks 31,4 (2009) 45,8 (2009) 42,5 (2008) Eksport inimese $6,988 per capita $1,362.63 per capita $ 113
countries, and participate on a basis of equality as partners in the Kingdom. In practice, however, most of the Kingdom affairs are administered by the Netherlands (which comprises roughly 98% of the Kingdom's land area. Geography The Kingdom of the Netherlands covers 42,519 square kilometres. The Kingdom of the Netherlands has land borders with Belgium, Germany, and France. About one quarter of the Netherlands lies below sea level. Economy and natural rsources GDP (2011): $705.7 billion. GDP growth (2011 est.): 1.6%. GDP per capita (2011): $ 42,300. Natural resources: Natural gas, petroleum, fertile soil. Agriculture (2% of GDP) Industry (24% of GDP) services (74% of GDP) Politics The Kingdom of Netherlands is a Parliamentary democracy under a constitutional monarch.The monarch is the head of state, at present queen Beatrix. In practice the executive power is formed by the council of Ministers.
Saksamaa Germany Slovakkia Slovak Republic Sloveenia Slovenia Soome Finland Suurbritannia United Kingdom Sveits Switzerland Taani Denmark Tšehhi Czech Republic Tšiili Chile Türgi Turkey Ungari Hungary USA United States Uus-Meremaa New Zealand Data Source World Development Indicators Last Updated Date 10/15/2020 https://data.worldbank.org/indicator/NY.GDP.PCAP.CD Country Name Country Code Indicator Name Indicator Code Aruba ABW GDP per capita (currNY.GDP.PCAP.CD Afghanistan AFG GDP per capita (currNY.GDP.PCAP.CD Angola AGO GDP per capita (currNY.GDP.PCAP.CD Albania ALB GDP per capita (currNY.GDP.PCAP.CD Andorra AND GDP per capita (currNY.GDP.PCAP.CD
Author Group Girli Vasiljev RB1X Title of report Number of pages Economic Country Review: Finland, Estonia 20 and Hungary Teacher Kalevi Torunen The goal of this paper is to compare the economic performance of Finland, Estonia and Hungary. First, a general overview on the countries will be given. After, economic indicators (real GDP growth rate, inflation, unemployment, household consumption, investment, current account, government budget and deficit) of the three countries will be compared to draw a conclusion. Keywords GDP, inflation, unemployment, household consumption, investment, current account, government budget, deficit, surplus Table of contents 1 Introduction .......................................................................................1 2 Country Specs ........................
languages (11 official) - Ethnic groups 79.4% black 9.2% white 8.8% coloured 2.6% asian - two of them are European origin : Afrikaans and South- African English Constitutional democracy (parliamentary republic) The president is Jacob Zuma - National Assembly and National Council of Provinces ( must ensure that provincial interests are taken into account in the national sphere of government ) Economy GDP 22 730,725 US $ per capita, 20,858 billion US $ total The Nelson Mandela Bridge in Johannesburg. Gauteng produces 33% of South Africa's GDP and 10% of the African continent's GDP GDP 10,136 US $ per capita, 277,4 billion US $ total Living standards Living standards are different from region to region Natural resources Main resources are ores More about Resources 1 Exports 2 3 1 Imports 2 3
% of of population population speak speak at at least least one one foreign foreign language language www.investbg.government.bg MACROECONOMIC INDICATORS GDP Growth (%) 3 1.6 1.3 1.5 0.1 0.2 2010 2011 2012 2013 2014 2015 MACROECONOMICS DATA Inflation Rate (%) 3.0 3.4 GDP: 44.16 billion EUR 2.4 GDP per capita: 5 700 EUR 0.4 Budget Deficit: -3.1% of GDP
The United States and its economy are known to be one of the thriving and strongest in the world. It represents 16.6% of the world’s total GDP. The estimated worth of USA's GDP is estimated to be around 17.5 trillion dollars and dollar being the third currency in the world and the official currency of the US. They also manage a 5% growth every quarter. So how do they manage it? There are three main sectors that contribute to the USA's GDP. First is services that is 80% of the total GDP. The output of services in 2014 was 13,8 billion dollars witch was the nr
(permanent meadows, pastures) Niisutatav maa 0 0 30,00 0,1 (agricultural area irrigated ) ARVUTAGE: 0,0001 0,0009 Põllumajanduslikku Põllumajanduse spetsialiseerumine. Põllumajanduse osatähtsus riigi majanduses. Näitajad Holland Valgevene 1. Kui suur on riigi 731.5 billion PPP dollars 143.9 billion PPP dollars sisemajanduse kogutoodang (GDP Gross domestic product)? 2. Võrdle SKT-d elaniku kohta 46,200 6,600 (GDP per capita) 3. Kui suure osa annab 770,224 põllumajandus SKP-st (GDP - composition by sector)? 4. Kui palju inimesi töötab agriculture: 2% agriculture: 9.4% põllumajanduses (Labor force - industry: 18% industry: 45.9% by occupation)? services: 80% services: 44.7% 6
püsikultuuride all 36,40 0,9 (permanent crops) heina- ja karjamaad 816,00 19,6 (permanent meadows, pastures) Niisutatav maa (agricultural 0 0 area irrigated ) Põllumajanduslikku maad 0,0001 0 Põllumajanduse spetsialiseerumine • Enim kasvatatud kaupade graafik. Osatähtsus riigi majanduses Näitajad Kui suur on riigi sisemajanduse 731.5 billion PPP dollars kogutoodang (GDP Gross domestic product)? SKT-d elaniku kohta (GDP per capita) 46,200 Osa põllumajandus SKP-st (GDP - 770,224 composition by sector)? . Kui palju inimesi töötab agriculture: 2% põllumajanduses (Labor force - by industry: 18% occupation)? services: 80% Üleujutuste piirkonnad • Hollandi maapind on väga madalal seetõttu on ka suur üleujutuste oht • Üldjuhul mets ei kasva üleujutuste piirkondades.
· 'What causes the economy to grow over time?', · 'What causes short-run fluctuations in the economy?` · 'What influences the values various economic indicators and how do those indicators affect economic performance? Macroeconomics can be best understood in contrast to microeconomics. An understanding of microeconomics is crucial to understand macroeconomics. · To understand why a change in interest rates leads to changes in real GDP, · Need to understand how lower interest rates influence decisions, · The decision of how much to save, at the firm or household level; · To understand how an individual, on average, will change their behavior we will then understand the large scale relationships in an economy. Macroeconomics can also be useful. · The economicwell-being of all consumers, rich or poor, is affected by movements in
riigi rengutaseme näitajad ning transpordi ja Argentiina turismimajanduse ülevaade. 1. Iseloomusta riigi arengutaset ja võrdle seda Eesti näitajatega ( võib välja tuua ka maailma või Euroopa keskmised). Millised on arengutrendid, kuidas need näitajad on muutunud? a kasutades sisemajanduse kogutoodangut (SKP/in ehk GDP per capita) b Inimarengu indeksit ( IAI ehk HDI) c veel kahte sinu enda poolt valitud näitajat Argentiinas on väiksem GDP. Argentiinas on väiksem HDI 2. Iseloomusta teedevõrku ( raudteed, maanteed) antud riigis Sisevedudes on olulised raudteed ja autoveondus, kuna teisi transpordivahendeid ei ole võimalik kasutada. Autotranspordi jaoks on teedevõrk tihe Atlandi ookeani ääres. Suuremaid maanteid ei ole eriti palju
and of NATO since 29 March 2004 Estonia has also signed the Kyoto protocol. Economy Estonian economy was one of the fastest growing in the world until 2006 with growth rates even exceeding 10% annually. Despite some concerns both in and outside of the country, the Estonian economy and its currency remained highly resilient and solvent. Until recent years the Estonian economy continued to grow with admirable rates. Estonian GDP grew by 6.4% in the year 2000 and with double speeds after accession to the EU in 2004. The GDP grew by 7.9% in 2007 alone. Increases in labor costs, rise of taxation on tobacco, alcohol, electricity, fuel, and gas, and also external pressures (growing prices of oil and food on the global market) are expected to raise inflation just above the 10% mark in the first months of 2009. In the first quarter 2008 GDP grew only 0,1%. The government made a
done online and 25% of people now vote online as well. The transport system is rather developed as well. Tallinn, for example, offers free public transport for those who live in the city and for students from outside of Tallinn. You can also take a bus to most of the places in Estonia and a train to some places like Tapa and Tartu. As for the economic factors, here are some facts according to Statistic Estonia. In the 3rd quarter of 2014, the GDP at current prices was 4.9 billion euros. Compared to the 3rd quarter of 2013, the GDP increased 2.2%. In 2013 the GDP per capita in current prices was 14 217.6 euros. In the 3rd quarter of the last year, the increase in average monthly gross wages was 5% compared to the year before that. The average monthly gross salaries were 977 euros and the average hourly gross salaries were 5.89 euros. The labour market remained quite stable. The unemployment rate was 7
miks metsad just nii paiknevad (kasuta ka atlase loodusgeograafilisi kaarte). Milline/-sed on valdav/-avad metsatüüp/-bid? Leidsin küll kaardi, aga ei suutnud leia vasakul kirjeldatavat linki nimega Forest Types. Proovisin nende asemel Countries- Forests and the forestry section ja forestry policies, kuid ka seal ei olnud Suurbritannia kohta informatsiooni. 3. Lingilt http://www.fao.org/forestry/country/57478/en/ leia hõive ja GDP näitajad – vasakul link Economy and products ja siis employment and GDP. Kuidas on hõive ja GDP näitajad perioodil (näidatud aastad; pane need kirja ka) muutunud (näed tabelitest)? Põhjenda muutusi. Selle kohta puudus informatsioon. 4.Milliseid metsatööstuse tooteid eksporditakse ja imporditakse? Nimeta olulisemad (2-3). http://www.fao.org/forestry/country/57026/en/ Neid mõlemid imporditakse ja ka eksporditakse, tähtsamad: * Küttepuu (Imp:8800 Cum, Exp: 142500 Cum)
Mobile, Entrepreneurs, Start-UP, Renting, 2010 gamefication 2020 Pop 6.9 billion Pop 7.7 billion GDP 63 T GDP 90 T G7 E7 Rahvastik Võttis 200 000 aastat, et saavutada 3.5 miljardit inimest ja 50 aastat et seda DUUBELDADA. 2 30.09.2015
loodusvarade kasutamise ja keskkonna saastamise maksustamisele. Eesti arengu jätkusuutlikkus on langustrendis vastavalt Maailmapanga hinnangule. EL Loodusvarade Jätkusuutliku Majandamise Strateegia raames koostatud uuringu kohaselt on Eesti majanduse tõhusus madalaim EL liikmesriikide hulgas arvestades materjalimahukust (Direct Material Input) ühe ühiku SKP tootmisel ühe elaniku kohta. Jätkusuutlik ja konkurentsivõimeline? Materials Productivity, GDP/DMI in 1999 EUR/t 1400 1152 1200 1000 868 896 957 800 Materials Productivity, 586 600 GDP/DMI in 1999 EUR/t 400 226 200 57 72 109 0 ge Li tv ia - a -1 5 a De en Es C k Sw d Fi a ar
aren’t so different, from my point of view atleast. Pretty rainy or wet most of the time, moderate winters and pretty average summers. Taking a look at the state systems, we can see that both countries are parliamentary government types, just the difference is that the United Kingdom is a monachry with a queen and Estonia has a president. From an economical standpoint, United Kingdom surpasses Estonia is most sectors, we can take the GDP as an example, when UK stands at 2.629 trillion then Estonia only stands at a low of 38.94 billion. That’s a huge difference, but we should concider another factor. When Estonia stands at the bottom ten of public debt, having one of the lowest ones in Europe then United Kingdom is at the top thirty, with its public debt being 89.30 percent of the GDP. Natural resources can benefit a country greatly, if the country was lucky to enough to have anything valuable as in oil
offers to millions Europeans the chance to study, train, work or volunteer abroad. Young people may work as volunteers either within or outside EU, in a wide range of areas such as social care, the environment, culture, youth, sports and development cooperation. The booklet contains illustration about how well off are Europeans. The countries of the EU are very different and the standard of living is different. Economic power of a country helps to measure gross domestic product (GDP) and parity of purchasing power. This is the only way to make countries comparable. The graphic shows that the GDP per head is the highest in Luxembourg and the lowest in Bulgaria. The GDP per head in Estonia is quite low, lower than th EU average. The EU aims to reduce the disparaties and that is why poorer regions of the EU receive money to impove their infrastructure and so enhance their economic opportunities.
majandusele. 5 2. KÜPROSE VABARIIGI MAKOÖKONOOMIKA AASTATEL 2000-2013 2.1. Kriisieelne areng aastatel 2000-2007 Kriisieelseks arenguks võttis töö autor aastad 2000-2007. Majanduslik olukord oli sel ajal Küprosel hea ning majandussektor arenes jõudsalt. Keskmine SKP kasv aastas oli 3,0%, mis oli 2 korda rohkem kui sel ajal euroalal. Aastatel 2000-2007 tõusis SKP riigis 2,3 miljardilt dollarilt kolmele miljardile.(Gross Domestic Product (GDP) in Cyprus...2014) Samuti oli kriisieelsetel aastatel Küprosel madal inflatsioon. Inflatsioonimäär näitab hinnataseme %-set muutust võrreldes baasperioodi hinnatasemega ning inflatsioon on üldine hinnatõus. Joonis 1. Küprose inflatsioonimäär aastatel 2000-2008. Allikas: Cyprus Inflation Rate 2014 Inflatsioonimäära peaks hoidma võimalikult madalal ja stabiilsena, sest muidu pole riik majanduslikult stabiilne kui inflatsioon kõigub. Antud joonis näitab, et inflatsioonimäär
2000-2010 aastani. Selle ajaga on tõusnud Eesti IAI 0,787-lt 0,886-le. Tabel 2. IAI (HDI) osakomponendid Riik IAI indeks Koht Keskmine Täiskasvanut SKT inimese (HDI value) maailma oodatav e (üle 15.a) kohta (GDP per riikide eluiga kirjaoskus ja capita PPP $) hulgas (Life koolis käidud (HDI rank) expectancy aeg (Adult at birth) literacy rate / Mean years of schooling)
Tootmine ja tootlikkus IX peatükk Sisemajanduse Sisemajanduse kogutoodang (SKT ehk GDP) on teatud kogutoodang (SKT ehk perioodi jooksul riigis toodetud kaupade ja teenuste GDP) turuväärtus. SKT puudused - ei kajasta kõiki kaupu ja teenuseid, mida toodetakse elatustaseme arvutamisel - hõlmab ainult lõpptarbimise kaupu - hõlmab vaid puhas eksporti (impordi ja ekspordi vahe) - inflatsioon võib moonutada SKP kasvu tähtsust - ei kajastu kvaliteedi muutused - rahvastiku muutused
election. The transportation infrastructure includes 1018 kilometers of railroads but only 132 kilometers of electrified rail lines. There are 10 935 kilometers of paved roads, including 75 kilometers of expressways. All international flights use the Tallinn Airport, and there are several ports on the Baltic Sea, the port of Tallinn being the third largest in the Baltic Sea. Economic factors As a member of the European Union, Estonia is considered a high-income economy by the World Bank. The GDP (PPP) per capita of the country, a good indicator of wealth, was in 2015 28 781 USD according to the IMF. The country is ranked 8th in the 2015 Index of Economic Freedom, and the 4th freest economy in Europe. A balanced budget, almost non- existent public debt, flat-rate income tax, free trade regime, competitive commercial banking sector, innovative e-Services and even mobile-based services are all hallmarks of Estonia's market economy.
Tootlikkus sõltub riigis toodetud kaupade ja teenuste väärtusest, mida mõõdetakse nende vabaturu-hinnas, ja efektiivsusest, millega neid toota suudetakse.Ainult piisav tootlikkus võimaldab riigil säiliada tugevat valuutat ja koos sellega ka kõrget elatustaset. 5.Kuidas mõjutavad sisemajanduse koguprodukti muutused elatustaset? 6.Mis on sisemajanduse koguprodukt ja kuidas seda mõõdetakse? Sisemajanduse koguprodukt (SKP,inglise keeles Gross Domestic Product, GDP) on kindla perioodi jooksul riigis toodetud toodete ja teenuste koguväärtus. Sisemajanduse koguprodukti mõõdetakse, liites kokku aasta või kvartali jooksul toodetud lõpptarbimisega toodete ja teenuste ostud.(GDP = private consumption + gross investment + government spending +exports imports). Sisemajanduske koguprodukti arvestatakse ka puhaseksport, st. ekspordi ja impordi vahe. SKP ei võta arvesse tooteid, mida ettevõtted teiste toodete valmistamiseks ostavad. 7
fiscal and monetary policies, has contributed to a controlled reduction in the rate of inflation. The annual inflation rate has decreased from a high of 80.2% in 1991 to 7.9% in 1998. inflation for FY1998/99 was 6.2% compared to 7.2% in the corresponding period in CUU1997/98. The Government remains committed to lowering inflation, with a long-term objective of bringing it in line with that of its major trading partners. After a period of steady growth from 1985 to 1995, real GDP (gross domestic product) decreased by 1.8% and 2.4% in 1996 and 1997, respectively. The decrease in GDP in 1996 and 1997 was largely due to significant problems in the financial sector and, in 1997, a severe island-wide drought (the worst in 70 years) that drastically reduced agricultural production. In 1997, nominal GDP was approximately J$220,556.2 million (US$6,198.9 million based on the average annual exchange rate of the period).
arvessevõtmisest, arvestatakse ainult lõpptarvimiseks kasutatavaid kaupu. · Ei arvestata tooteid ja teenuseid, mis on toodetud välismaal, isegi kui tootja on välisriigis tegutsev kohalik ettevõte. Reaalne vs nominaalne, per capita, PPP · Reaalsed arvud näidatakse püsivates hindades, st. Korrigeeritud baasaasta hinnaindeksiga. · Nominaalsed arvud näidatakse jooksvates hindades. · Reaalne SKP (GDP) on aasta jooksul toodetud kaupade ja teenuste kogusumma mida on korrigeeritud baasaasta hinnaindeksiga. SKP 1993 2009 Moneymoneymoney 2000 12000 SKP 100mln 200mln THI tarbijahinnaindeks. 100mln (*1,5)200mln - rahaliselt kasvas 50mln. · SKP ühe elaniku kohta saadakse kui jagatakse aasta jooksul loodud SKP riigi rahvaarvuga
) 65 ja vanemad: 20.6%(N-9557634, M-7217163milj/in.) Rahvastiku püramiid Click to edit Master text styles Second level Third level Fourth level Fifth level Ränne Olulisem ränne on toimunud riigi idaosast lääneossa. 0.54% immigranti/1000 elaniku kohta Riigi arengutase 8.1% of GDP (2009) Saksamaa SKT kasv 0.10% Praegune SKT 3.6% Haridustase 4.5% GDP Lapsed vanuses 15 ja enam oskavad lugeda ja kirjutada. 99% rahvastikust oskab kirjutada. Sündmus ja suremus väikesed (11-12o/oo). Iive enamasti negatiivne. Riigi tähtsamad organisatsioonid Corps Borussia Bonn -1821.aastal asustatud üliõpilasteorganisatsioon Bonnis. Hitlerjugend - oli asustatud II maailmasõja eel. Natsionaalsotsialistliku Saksa Töölispartei skautlik paramilitaarne noorteorganisatsioon.
plahvatusse. Arvan nii, sest Peruus on palju lapsi ning vanurite osakaal rahvastikus kasvab aasta-aastalt. 4. Linnastumine. a) 77% kogu riigi rahvastikust elab linnades. b) Suure rahvaarvuga linnad Peruus: pealinn Lima- 8, 769 miljonit inimest; Arequipa- 778000 inimest. c) Huvitavad faktid: Peruu pealinn Lima kohale asutas Hispaania konkistadoor Francisco Pizarro 18. jaanuaril 1535 asula nimega La Ciudad de los Reyes, mis tõlkes tähendab ,,Kuningate linn". 5.Majandus. a) SKT(GDP) suurus: $274.7 biljonit. Maailmas 44.kohal. b) SKT (GDP) per capita: $9200. Eestis on see näitaja $19000. c) Peamised põllumajandussaadused: spargel, kohv, kakao, puuvill, suhkruroog, riis, kartulid, mais, jahubanaanid. Viinamarjad, apelsinid, ananassid, guajaavid, banaanid, õunad, sidrunid, pirnid, koka, tomatid, mangod, oder, sibulad, nisu. Tööstustoodang: teras, naturaalne gaas, kalad, tekstiil, riided. d) Elektri ja nafta tarbimine: elektri tarbimine 28,97 biljonit kWh, maailmas 60
Agriculture About 77 per cent of the land area of Britain is under agricultural use of some sort. However, the sector's role in the economy is much smaller than in most other major industrial countries, in terms of employment and contribution to GDP, reflecting Britain's early industrialization. Agriculture employs less than 2 per cent of the population and contributes 2 per cent of GDP. However, it achieves high levels of efficiency and productivity. Britain is self-sufficient in 58 per cent of all types of food and animal feed. Large parts of Britain, notably in Scotland and Wales, are suitable only for grazing. Overall, in the first half of the 1990s about 39 per cent of agricultural land was under pasture, another 27 per cent under rough grazing, and the remainder under crops or lying fallow. Over half of all full-time farms are devoted to dairy or beef farming, or sheep
explorer, Juan de Bermúdez. Executive authority in Bermuda is vested in the monarch and is exercised on her behalf by the Governor. The governor is appointed by the Queen on the advice of the British Government. The current governor is Sir Richard Hugh Turton Gozney ; he was sworn-in on December 12, 2007. There is also a Deputy Governor (currently Mark Andrew Capes). Bermuda has a highly affluent economy, with finance as its largest sector followed by tourism, giving it the world's highest GDP(gross domestic product - GDP or gross domestic income - GDI ) per capita in 2005. It has a subtropical climate, beaches with pink sand, and is surrounded by cerulean blue ocean waters. Bermuda is divided into nine parishes and two municipalities. Bermuda's nine parishes: Devonshire Hamilton Paget Pembroke St George's Sandy's Smith's Southampton Warwick Bermuda's two incorporated municipalities: Hamilton (city) St. George's (town) Sport is a popular pastime in Bermuda, especially football
Õige Kuidas jaguneb elanikkond 16'ndast eluaastast pensionieani? · Tööjõud: 1. Hõivatud, 2. Töötud o Töö kaotanud inimesed o Töölt vabatahtlikult lahkunud o Esmakordselt töötuks registreerinud o Taasregistreerinud Ülejäänud ei ole tööjõud. EV GDP oli 2002.a. 103 mlrd krooni. Tööpuudus oli 12%. Kui suur oleks olnud GDP maht, kui tööpuudus oleks olnud 7%? 88 ---> 100% 93 ---> x x= 109 mlrd krooni Milline on inflatsiooni ja tööpuuduse seos? Vt. konspekt joonis lk 38 Isik, kes töötab lühendatud tööpäevaga, kuna ei leia täiskoormusega tööd: c) arvestatakse tööjõu hulka Millised maksud riik kehtestab? Üksikisiku tulumaks, sotsiaalkindlustusmaks, ettevõtte tulumaks,
Aliis Uudelt Eritrea State of Eritrea Horn of Africa Sudan, Ethiopia, Djibouti, Red Sea Asmara 117,600 km2 6 million inhabitants Politics and government People's Front for Democracy and Justice The National Assembly Periodically scheduled Regions and districts 6 regions Control over agricultural capacity Historical intra-regional conflicts geography Virtually bisected Fertile lands West Desert East Sandy, arid coastline Highlands economy Agricultural Farming and herding GDP is growing Languages No official language Arabic and Tigrinya English and Italian The End
2. Makromajanduslikud majandusnäitajad, macro : economic indicators majandust kui tervikut (), , , iseloomustavad näitajad: majanduse (SKP) kasv, töötus, . inflatsioon, väliskaubanduse saldo jm. 3. , 3. Sisemanduse kogutoodang (SKP), gross domestic product (- ) (GDP) on mingil periodilriigis toodetud lõpptarbimisegakaupade ja teenuste maksumus 4. Rahvamajanduse kogutoodang (RKP), gross national 4. , , produc, income GNP, GNI = SKP +netotulud välismaalt = + 5. Rahvatulu, RT, national income , NI- faktortulude 5. , ,
level education Open, excellent and attractive research systems ● International scientific co-publications per million population ● Scientific publications among top 10% most cited publications worldwide as % of total scientific publications of the country ● Non-EU doctorate students as a % of all doctorate students Finance & Support ● R&D expenditure in the public sector as % of GDP ● Venture capital investment as % of GDP Firm activities ● R&D expenditure in the business sector as % of GDP ● Non-R&D innovation expenditures as % of turnover Linkages & Entrepreneurship ● SMEs innovating in-house as % of SMEs ● Innovative SMEs collaborating with others as % of SMEs ● Public-private co-publications per million population Intellectual assets
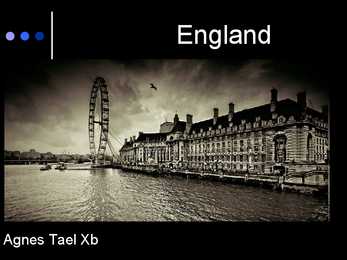
Politics constitutional monarchy and parliamentary democracy leading parties Conservatives and Labour party member of the European Union Population Climate 51 000 000 people Temterate maritime 395 people per km² climate biggest influences come from the proximity to the Atlantic Oean Economy one of the largest in in the world average GDP per capita of £22,907 regarded as a mixed market economy official currency is the pound sterling Education optional nursery, primary, secondary Sixth form college Sports Thank you for your attention!!
· 2. Äri arendamine · 3. Majanduslik ja tehniline koostöö Eesmärk · 1994 seati Bogori eesmärk · Tollimaksude vähendamine ja turgude avamine Aasias · Majanduse kasv · Töökohtade loomine · Vaba rahvusvaheline kaubandus Saavutused · Organisatsiooni algusest on kogu kaubavahetus kasvanud 395 %. · 1989 oli 16,9 % turgudest kinnised, 2004. aastaks vaid 5,5 %. · Liikmesriigid moodustuvad 40% populatsioonist, 54 % kogu maailma GDP-st ja 44 % maailma kaubandusest. · Kaubavahetus kasv välisriikidega on kasvanud keskmiselt 8,3 % aastas. · Internetis kasutust on kolmekordistatud seal piirkonnas. · 2002-2006 suudeti makse vähendada 6 %.
Rahvamajanduse arvepidamine SKP (SKT) ; GDP – mõõdab ära ühe riigi territooriumil teatud aja jooksul toodetud kaupade ja teenuste lõpptarbimise rahalises väljenduses. SKP per capita – SKP ühe elaniku kohta = SKP (EUR) / Elanike arv RKP (RKT) ; GNP – rahvamajanduse koguprodukt RKP mõõdab mingi konkreetse riigi rahvaomanduses olevate varadega mingi perioodi jooksul toodetud kaupade ja teenuste lõpptarbimise kogusumma rahalises väljenduses. RKP = SKP + NFT (rahvusvahelise toodangu tulu?)
Indoneesia Tanel Rohelpuu 12LJ Geograafiline asukoht Indoneesia asub kagu-Aasias Pindala:1,904,569 ruutkilomeetrit Indoneesia on geoloogiliselt aktiivne koht kus toimuvad vulkaanipursked, maavärinad ja tsunamid. Kliima Indoneesia kliima on troopiline Sajab palju vihma kuna ta asub ekvaatori lähedal. Rahvastik Rahvaarv :245,613,043 Rahvastikupüramiid 0-14 aastased: 27.3% 15-64 aastased: 66.5% 65 aastased ja vanemad: 6.1% Keskmine iga 27,7 aastat ARENG GDP inimese kohta 4700 US dollarit SKT 1.21 trillionit US dollarit Töötus 6.7% 18.1 sündi 1000 elaniku kohta Iive 1,069% Indoneesia on arengumaa RAHVUSVAHELISED ORGANISATSIOONID UNESCO- Rahu ja julgeolek WHO- Maailma tervishoiuorganisatsioon IMF- Rahvusvaheline valuutafond Interpol- Rahvusvaheline politseiorganisatsioon MAJANDUS Väljaveoartiklid: gaas,kuld,hõbe,tina,tekstiil, elektrilised seadmed Sisseveoartiklid: nafta,masinad,kemikaalid Ressurssid:Palmiõli,riis,kakao,kohvi Energia
Mõlematele seotuakse kolm fosfaatrühma. Insuliini retseptor. Heterotetrameerne kompleks. Samamoodi. Intratsellulaarsed retseptorid Signaali ülekanne ioonikanaliga seotud retseptori kaudu ? Signaali ülekanne G-valguga seotud retseptori kaudu Neurotransmitter seondub retseptorile, mille tagajärjel toimub konformatsioonimuutus; G-valk membraanis moodustab retseptoriga kompleksi. G-valgu α-subühiku aktiivtsentrist vabaneb GDP 12 GDP asemel seondub GTP α-subühik eraldub G-valgust ja inaktiveerib või aktiveerib membraanivalgu, vastavalt subühikule. Adenülaadi tsüklaasi rada Kõigepelat toimub signaali ülekanne G-valguga seotud retseptori kaudu (GDP vabaneb, GTP seondub, α-subühuk lahkub). αQ/αS – subühik aktiveerib adenülaadi tsüklaasi; adenülaadi tsüklaasi
India Üldinfo 803 940 ruutkilomeetrit 144,6 miljonit elanikku Pealinn: Delhi Rahvused: punjabi, sindhi, pashtu, baloch, muhajir Keeled: urdu, punjabi, pashtu, inglise Usundid: hinduism, budism, jainism ja sikhism Riigipea: peaminister Gen. Pervez Musharraf GDP: 282 miljardit USD GDP elaniku kohta: 2000 USD poole väiksem kui Eestil Majanduskasv: 5 % Inflatsioon: 5,2 % Põhilised majandusharud: tekstiil, põllumajandus, tsement, vaibad, keemiatööstus. Pinnamood Hindustani poolsaar on eelkambriumi platvorm, millel loodes lasuvad paksud basaltkatted. Valdav on 300-800 m kõrgune sügavate orgudega lõhestunud lainjas, üksikute lavamägedega tasandik- Dekaani kiltmaa. Selle kõrgemate äärealade jalamil paiknevad kitsad rannikumadalikud. Induse-Gangese madalik
and didn't think about the future so nowadays there is mostly peat ( turvas) which Ireland uses to produce energy. Economy Ireland had a big economic boom in the late 20'th century, but now the Republic of Ireland is ranked the second wealthiest per capita country in the European Union. Education in Ireland is free at all levels, including college. The construction sector, which is inherently cyclical in nature, now accounts for a significant component of Ireland's GDP. ( ehitus/tõõstus sektor, mis on loomupäraselt tsükliline , mängib nüüd iirimaa GDP's märkimisväärset rolli - GDP =SKT ) In 2005, Ireland was ranked the best place to live in the world, according to a quality of life assessment ( hindamine ) by Economist magazine. The weather Irish think there are 4 kinds of weather , rainy spring , rainy summer , rainy autumn and rainy winter and only the lastone is a bit diffrent from others , its more like sleet ( lõrts)
2 °C and the lowest -21.6 °C. The driest city in New Zealand is on the South Island and it's named Christchurch. The rainfall in Christchurch is only 640mm per year, but in Auckland - which is the wettest city - it rains twice as much. The northern and the north-eastern parts of the South Island are the sunniest areas in New Zealand - the people out there have about 100 sunny days a year. Economy. Largest Cities Economy in New Zealand is very modern and developed. It's GDP is about 101,688 billion dollars (data from 2005). Country's GDP is ~$26,400 per one resident (for example in Australia it's $31,900 and in USA $41,800). New Zealand is a country which mostly bases on its bargaining, agricultural production. 20% of agricultural produce is exported. Most important export partners are Australia, USA, Japan, China, Germany. The country's biggest incomes comes from tourism. Every year about 2
Lárisa 163 400 336 km² 9 Kasutatud allikad https://et.wikipedia.org/wiki/Kreeka https://et.wikipedia.org/wiki/Ateena http://www.census.gov/ipc/www/idb/country.php http://www.zorbas.ee/kreekal.html http://www.estemb.gr/est/kreeka#top http://www.kreeka-reisid.net/index.php?m1=152&lang=17 http://www.vm.ee/et/kreeka-vabariik-majandus http://www.kushnirs.org/macroeconomics/index.php?area=greece&indicator=gdp&lang=et http://www.kushnirs.org/macroeconomics/index.php? area=estonia&indicator=gdp&lang=et#neib https://annaabi.ee/Kreeka-rahvaarvu-muutumine-rahvastikupoliitika-m58637.html https://annaabi.ee/Kreeka-referaat-m55023.html https://et.wikipedia.org/wiki/Pireus https://en.wikipedia.org/wiki/Thessaloniki https://et.wikipedia.org/wiki/L%C3%A1risa https://et.wikipedia.org/wiki/P%C3%A1tra 10
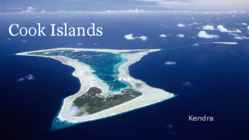
Population: 14,974 Villages, farms Politics Left: Henry Puna, right: John Key Self-governing state In international treaties Head of state: British monarch Parliamentary elections: 4 years Independence: 4th August 1965 Political parties: Cook islands party, the Democratic Economy Few natural resources: cobalt, phosphate Inadequate infrastructure Main industries: Tourism, fishing, banking, mining Export: citrus & tropical fruits, handicrafts, clothes Import: fuels GDP: $183,2 million Education Free Compulsory (5-15) University of the south Pacific in Avarua vast majority: literate Scholarship provided by goverment Cultural life Song and dance festivals Libary and museum in Avarua International culture Traditional ceremonies Major national day: Constituion day Tiare (Gardenia) festival 1 daily newspaper Animal and plant life Dark Purple ground orchid Tropical fruits and vegetables Palms, pandanuses
arenevad N: Singapur, Hiina, Korea, Mehhiko, Brasiilia) -toorainemaad(ressursirikkad, põllumaj.saadused, naftariigid,isatndusriigid, metallimaakide väljavedajad ) -naftariigid(N:Kuiveit, Saudi-Araabia,Iraan, Iraak) -metallimaakide väljavedajad(N:Tsiili, Sambia ) -vaesed riigid(pole loodusvarasid, pole kapitali, pole odavat tööjõudu, ei tunta huvi investeeringute vastu.N: Afganistan, Aafrika riigid MIN.2 näitajat riigi hindamisel, mida rohkem seda parem. N: 1)SKT(GDP)- majanduse kogutoodang riigisiseselt, aasta jooksul toodetud kaupade ja teenuste turuväärtus dollarites, ühe inimese kohta 2)RAHVASTIKUHÕIVE erinevates sektorites *mida rohkem inimesi töötab teeninduses, seda arenenum riik, mida enam põllumajanduses, seda vähemarenenum riik. 3)SIDE JA TRANSPORDI vahendite hulk 1000elaniku kohta 4)ELEKTRIENERGIA tarbimine 1 elaniku kohta aastas. Kw/g 5)AUTODE HULK 6)EKSPORDI ja INPORDI struktuur 7)MAJANDUSE STRUKTUUR 8)KESKMINE ELUIGA 9)IMIKU SUREMUS
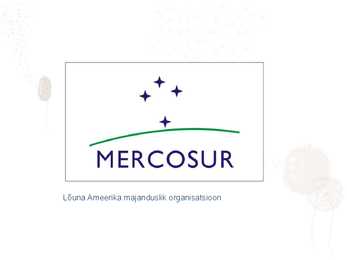
Fourth level Paraguai ja Urugai poolt, et Fifth level saavutada EL-i eeskujul regioonisisene integreerumine ja ühine turg. Faktid Liikmed: Argentiina, Brasiilia, Paraguai ja Uruguai Pindala: 12,781,179 km² Juhtkond: president (praegu Paraguay) Sisemajanduse kogutoodang (GDP): US 2.895 trillion Ametlikud keeled: hispaania, portugali, guaranii Elanikkond: 266.616.849 inimest Mercosuri ülesanded Tasuta kaubavahetus kõigi liikmesriikide vahel. Kehtestada ühised tariifid ja võtta omaks ühised kauplemispõhimõtted. Liikmesriikide otsus võtta vastu muudatusi seadustes, et tugevdada integratsiooni protsessi. Kaubandussuhted EL on Mercosuri jaoks üks olulisemaid ekspordi- ja impordipartnereid. Peamiseks
Governor General appointed by the monarch Parliamentary democracy Similar parliamentary system to other Commonwealth realms Federation "One Dominion under the name of Canada" with the Constitution Act of 1867 GEOGRAPHY Located in North America, north of USA Territory - 9,984,670 km2 World's second largest country CLIMATE Due to large territory, climate varies in greatly ECONOMY One of world's wealthiest nations 1,406,000 GDP 9th in the world About ¾ of Canadians employed in service industry Unusually high importance of primary sector Logging and oil industry two of Canada's most important One of world's most important agricultural suppliers World leader in many natural resources Gold, nickel, aluminum, lead, zinc, uranium One of few developed countries that are net exporters of energy LANGUAGES RELIGION SYMBOLS Flag Coat of Arms Anthem "O Canada!" O Canada! Our home and native land!
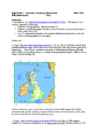
GREAT BRITAIN Across 6. What is the language that is spoken in Scotland by more than 70,000 people 7. Which part of the UK has the population of 2,965,900 10. What was first used in Britain to smelt ores such as iron 13. It is the official religion in Britain 15. A Cumbria's lake that is knows as ''Queen of Lakes'' 16. The second highest top in Britain 18. One of Britains great ports which is connected to the sea by rivers 19. South of the Pennines, also knows as the industrial heart of the United Kingdom 20. Agriculture contributes 2 per cent of... Down 1. Type ...