It measures and records business transactions and provides financial statements that are based on GAAP. Cost accounting measures, analyzes, and reports financial and no financial information relating to cost of acquiring or using resources in an organization. Value-chain analysis: sequence of business functions in which customer usefulness is added to products and services. 1. Research and development 2. Design of products, services, or processes 3. Production 4. Marketing 5. Distribution 6. Customer service. Supply chain describes the flow of goods, services, and information from the initial sources of materials and services to the delivery of products to consumers, regardless of whether those activities occur in the same organization or in other organizations. Five step decision making process: 1. Identify the problem and uncertainties. 2. Obtain information. 3. Make predictions about the future. 4. Make decisions by choosing among alternatives. 5
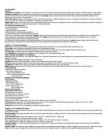
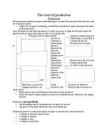
The costs of production Production Decisions about production require individual agents to make decisions about the allocation and use of physical inputs. · Objectives of agents, technology, availability and quality of inputs determine the nature of these decisions. Since the objectives are often pecuniary, it is often necessary to relate the decisions about the physical units of inputs and outputs to the costs of production. · If the prices of the inputs and the production relationships are
.................................................................................................31 9.2 How wind machines work..........................................................................................32 9.3 Types of wind machines............................................................................................. 32 9.4 Wind power plants......................................................................................................33 9.5 Wind production......................................................................................................... 34 9.6 Wind and the environment..........................................................................................34 TIDAL ENERGY............................................................................................................... 35 10.1 Wave Energy............................................................................................................ 36 10
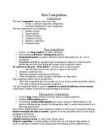
The individual firm has very little to no impact on the market. · Demand is perfectly elastic. · Maximizes productive and allocative efficiency. · Perfect competition includes complete information. ex. Agriculture Pure competition markets do not actually exist. · Note: Pure competition does not actually exist in our society, and the agriculture industry is the closest industry to being purely competitive. The pure competition model is used as a standard to evaluate the efficiency of our economy (something to compare to and help our understanding of economy.) Monopolistic Competition · Involves large number of firms, but not as many as in pure competition. · Produces differentiated products · In marketing, product differentiation (also known simply as "differentiation" is the
"primary energy" sources. 84 percent by volume of the hydrocarbons present in petroleum is converted into energy-rich fuels (petroleum-based fuels), including petrol, diesel, jet, heating, and other fuel oils, and liquefied petroleum gas. The lighter grades of crude oil produce the best yields of these products, but as the world's reserves of light and medium oil are depleted, oil refineries are increasingly having to process heavy oil and bitumen, and use more complex and expensive methods to produce the products required. Because heavier crude oils have too much carbon and not enough hydrogen, these processes generally involve removing carbon from or adding hydrogen to the molecules, and using fluid catalytic cracking to convert the longer, more complex molecules in the oil to the shorter, simpler ones in the fuels. Due to its high energy density, easy transportability and relative abundance, oil has
3 Energy Dividends You Can Still Trust This has been a bad year for energy dividends, but there are still a few out there that investors can still trust. With the price of oil recently hitting a sevenyear low and natural gas now at a 14 year low, there has been a deep impact on the cash flows at oil and gas companies. Many don't have enough money coming in to drill the required number of new wells needed to maintain their production rates, let alone any left over to pay shareholders a steady dividend. This has resulted in the reduction or suspension of a countless number of energyrelated dividends. All that said, there are a few energy dividends that investors can still trust. Here are three companies that have been making their dividend a priority. Jason Hall After Kinder Morgan's stunning announcement that it would cut its rocksolid (or so I
Statistics for the time are notoriously uncertain, but the best ones available show Ukraine's GDP at just $1,307 per capita. Only Azerbaijan, Georgia, Kyrgyzstan, Tajikistan, and Uzbekistan lagged behind Ukraine; even Moldova and Turkmenistan, generally regarded as very poor Soviet republics, were ahead of Ukraine. Ukraine's economy contracted annually between 9.7 and 22.7 percent in 19911996. The country experienced hyperinflation and an exceptionally huge production decline for a country not ravaged by a major war. Official GDP collapsed by almost half from 1990 to 1994, and slow decline continued throughout the decade. Economic growth would not resume again until 2000. The budget deficit was, at 14.4 percent of GDP, exceptionally large. Barter and the use of surrogate moneys and foreign currencies prevailed. Ukraine had introduced a sovereign currency, the Hryvnia, but it was little used. A shadow economy
as all costs ultimately will make way to the final market place to be reflected in the price paid by the end user. Therefore, the leading edge companies seek to make the supply chain as a hole more competitive through the value it adds and the cost it reduces overall. Thus today the real competition is not the companies against the companies but rather supply chain against supply chain. DEFINITIONS Supply Chain Management (SCM) is the process of planning, implementing, and controlling the operations of the supply chain with the purpose to satisfy customer requirements as efficiently as possible. Supply chain management spans all movement and storage of raw materials, work-in-process inventory, and finished goods from point-of-origin to point-of-consumption. According to the Council of Supply Chain Management Professionals (CSCMP),


Kõik kommentaarid