Vajad kellegagi rääkida?
Küsi julgelt abi LasteAbi
Logi sisse

Magustoitude tarbimine (0)

1 Hindamata
Punktid

Overview

Отчет об устойчивости 1
Mudel
STS_1
STS_2
STS_3

Sheet 1: Отчет об устойчивости 1


Microsoft Excel 14.0 Отчет об устойчивости
Лист: [MagustoitudeTarbimineALGUS.xls]Mudel
Отчет создан: 20.02.2014 10:47:55
Ячейки переменных


Окончательное Приведенн.
Ячейка Имя Значение Градиент
$B$16 Shokolaad 1.2499998798 0
$C$16 Jäätis 1.8750000601 0
Ограничения 95 95


Окончательное Лагранжа
Ячейка Имя Значение Множитель
$B$25 Tarbitud_gramme 168.1249994591 0
$B$20 Kaloreid ( kcal ) Tarbitud 449.9999951919 1.4375021723
$B$21 Rasva (grammides) Tarbitud 25 594.4999601278

Sheet 2: Mudel


Magustoitude tarbimine
Magustoitude koostis (ühe portsioni kohta)


Shokolaad Jäätis
Kalorid (kcal) 120 160
Rasv (grammides) 5 10
Gramme ühes portsionis 37 65
Magustoitude maitsvusindeks (sajapunktiskaalal, grammi kohta)
Shokolaad Jäätis
450 0
Tarbimisplaan (portsione päevas)
Shokolaad Jäätis
1.2499998808 1.8750001192
Kalorite ja rasva kitsendused (päevas)
Tarbitud
Lubatud
Kaloreid (kcal) 450.0000047684
450
Rasva (grammides) 25.000000596
25
Kokku tarbitud grammide kitsendus (päevas)
Tarbitud
Vajatud
168.1250033379
120
Maitsvuse koguindeks 20812.4980151653 Maksimeeritav eesmärk
18640
15509 Tundlikkus ühe shokolaadiportsioni kalorite suhtes
Tundlikkus lubatud kalorite suhtes
Tundlikkus shokolaadi ja jäätise maitsvuse indekside suhtes

Sheet 3: STS_1


Oneway analysis for Solver model in Mudel worksheet
Sensitivity of Tarbimisplaan_1 to input
input (cell $D$20) values along side, output cell(s) along top
Data for chart
Tarbimisplaan_1 Tarbimisplaan_2 Maitsvuse_koguindeks
1 Tarbimisplaan_1
375 Stopped
Stopped
400 0 2.5 15437.5
0
425 0.6250000186 2.187499986 15473.4374723164
0.6250000186
450 1.2499999734 1.87500002 15509.3750395479
1.2499999734
475 1.8750000133 1.56249999 15545.312480226
1.8750000133
500 2.4999999965 1.2500000027 15581.2500052731
2.4999999965
525 3.1250000009 0.9374999993 15617.1874986817
3.1250000009
550 3.7499999996 0.6250000003 15653.1250005273
3.7499999996
575 4.3750000003 0.3124999998 15689.0624995606
4.3750000003
600 5.0000000003 0 15725.0000010627
5.0000000003
625 5.0000000003 0 15725.0000010627
5.0000000003

Sheet 4: STS_2


Twoway analysis for Solver model in Отчет об устойчивости 1 worksheet
Sensitivity of $B$16 to Input2
Sensitivity of $B$16 to Input1
$B$16
Output and Input1 value for chart
Output and Input2 value for chart
$C$16 Input1 (cell $B$12) values along side, Input2 (cell $C$12) values along top, output cell in corner
Output Input1 value
Output Input2 value
$B$27 $B$16 70 75 80 85 90 95
1 $B$16 60 1 1 $B$16 70 1
60 Error Error Error Error Error Error
OutputValues_1 Error
65 Error Error Error Error Error Error
Error
Error
70 Error Error Error Error Error Error
Error
Error
75 Error Error Error Error Error Error
Error
Error
80 Error Error Error Error Error Error
Error
Error
85 Error Error Error Error Error Error
Error
Error
90 Error Error Error Error Error Error
Error
95 Error Error Error Error Error Error
Error
$C$16 70 75 80 85 90 95
60 Error Error Error Error Error Error
65 Error Error Error Error Error Error
70 Error Error Error Error Error Error
75 Error Error Error Error Error Error
80 Error Error Error Error Error Error
85 Error Error Error Error Error Error
90 Error Error Error Error Error Error
95 Error Error Error Error Error Error
$B$27 70 75 80 85 90 95
60 Error Error Error Error Error Error
65 Error Error Error Error Error Error
70 Error Error Error Error Error Error
75 Error Error Error Error Error Error
80 Error Error Error Error Error Error
85 Error Error Error Error Error Error
90 Error Error Error Error Error Error
95 Error Error Error Error Error Error

Sheet 5: STS_3


Twoway analysis for Solver model in Отчет об устойчивости 1 worksheet
Sensitivity of $B$16 to Input2
Sensitivity of $B$16 to Input1
$B$16
Output and Input1 value for chart
Output and Input2 value for chart
$C$16 Input1 (cell $B$12) values along side, Input2 (cell $C$12) values along top, output cell in corner
Output Input1 value
Output Input2 value
$B$27 $B$16 70 75 80 85 90 95
1 $B$16 60 1 1 $B$16 70 1
60 Error Error Error Error Error Error
OutputValues_1 Error
65 Error Error Error Error Error Error
Error
Error
70 Error Error Error Error Error Error
Error
Error
75 Error Error Error Error Error Error
Error
Error
80 Error Error Error Error Error Error
Error
Error
85 Error Error Error Error Error Error
Error
Error
90 Error Error Error Error Error Error
Error
95 Error Error Error Error Error Error
Error
$C$16 70 75 80 85 90 95
60 Error Error Error Error Error Error
65 Error Error Error Error Error Error
70 Error Error Error Error Error Error
75 Error Error Error Error Error Error
80 Error Error Error Error Error Error
85 Error Error Error Error Error Error
90 Error Error Error Error Error Error
95 Error Error Error Error Error Error
$B$27 70 75 80 85 90 95
60 Error Error Error Error Error Error
65 Error Error Error Error Error Error
70 Error Error Error Error Error Error
75 Error Error Error Error Error Error
80 Error Error Error Error Error Error
85 Error Error Error Error Error Error
90 Error Error Error Error Error Error
95 Error Error Error Error Error Error
Vasakule Paremale
Magustoitude tarbimine #1 Magustoitude tarbimine #2 Magustoitude tarbimine #3 Magustoitude tarbimine #4 Magustoitude tarbimine #5 Magustoitude tarbimine #6 Magustoitude tarbimine #7 Magustoitude tarbimine #8 Magustoitude tarbimine #9 Magustoitude tarbimine #10 Magustoitude tarbimine #11 Magustoitude tarbimine #12 Magustoitude tarbimine #13 Magustoitude tarbimine #14 Magustoitude tarbimine #15 Magustoitude tarbimine #16
Punktid 50 punkti Autor soovib selle materjali allalaadimise eest saada 50 punkti.
Leheküljed ~ 16 lehte Lehekülgede arv dokumendis
Aeg2014-09-02 Kuupäev, millal dokument üles laeti
Allalaadimisi 5 laadimist Kokku alla laetud
Kommentaarid 0 arvamust Teiste kasutajate poolt lisatud kommentaarid
Autor onde20 Õppematerjali autor
Kristina Murtazin, ärindus, Informaatika II

Sarnased õppematerjalid

CPM1A Programmable Controllers Operation Manual 1784470
402
pdf

CPM1A Programmable Controllers Operation Manual 1784470

Cat. No. W317-E1-11 SYSMAC CPM1A Programmable Controllers OPERATION MANUAL CPM1A Programmable Controllers Operation Manual Revised October 2007 iv Notice: OMRON products are manufactured for use according to proper procedures by a qualified operator and only for the purposes described in this manual. The following conventions are used to indicate and classify precautions in this manual. Always heed the information provided with them. Failure to heed precautions can result in injury to people or dam- age to property. ! DANGER Indicates an imminently hazardous situation which, if not avoided, will result in death or serious injury. Additionally, there may be severe property damage. ! WARNING Indicates a potentially hazardous situation which, if not avoided, could result in death or serious inju

Automatiseerimistehnika
Vormistamine ülesanne 3
18
docx

Vormistamine ülesanne 3

Edith D. de Leeuw, Joop J. Hox, Don A. Dillman INTERNATIONAL HANDBOOK OF SURVEY METHODOLOGY ÜLESANNE Õppeaines: SISSEJUHATUS ERIALASSE Tehnoloogia ja ringmajanduse instituut Õpperühm: Juhendaja: Tallinn 2021 TABLE OF CONTENTS 2 1 THE CORNERSTONES OF SURVEY RESEARCH 1.1 Introduction The idea of conducting a survey is deceptively simple. It involves identifying a specific group or category of people and collecting information from some of them in order to gain insight into what the entire group does or thinks; however, undertaking a survey inevitably raises questions that may be difficult to answer. How many people need to be surveyed in order to be able to describe fairly accurately the entire group? How should the people be selected? What questions should be asked and how should they be posed to respondents? In addition, what data collectio

Andme-ja tekstitöötlus
Tööstuslik andmeside kontrolltöö 2 abimaterjal - vastused
3
doc

Tööstuslik andmeside kontrolltöö 2 abimaterjal - vastused

oData transparency: In bit and byte oriented protocols, there is a problem if a control character (for ETX (End of Text) ·Same as ETB, only no more blocks will follow. ITB (End of > Differences with HDLC ­ length of protocol field (1B or 2B) byte-oriented protocols) or the start-of-frame flag (for bit-oriented protocols) appears in the actual data. Intermediate Transmission Block) ·Same as ETB, except that the receiving statio Differs from HDLC because of multiaccess MAC that provides · Maximum payload length (default: 1500) This was not likely to happen in ASCII text, but is very likely with binary data. This is known as a data will not acknowledge after the error checking. EOT (End of Transmission) framing/error detection: · Type of CRC (2B or 4B) transparency problem an can be rectified with byte stuffing (for byte-orien

Tööstuslik andmeside
Book Analog Interfacing to Embedded Microprocessors
568
pdf

Book Analog Interfacing to Embedded Microprocessors

Analog Interfacing to Embedded Microprocessors Real World Design Analog Interfacing to Embedded Microprocessors Real World Design Stuart Ball Boston Oxford Auckland Johannesburg Melbourne New Delhi Newnes is an imprint of Butterworth–Heinemann. Copyright © 2001 by Butterworth–Heinemann A member of the Reed Elsevier group All rights reserved. No part of this publication may be reproduced, stored in a retrieval system, or transmitted in any form or by any means, electronic, mechanical, photocopying, recording, or otherwise, without the prior written permission of the publisher. Recognizing the importance of preserving what has been written, Butterworth–Heinemann prints its books on acid-free paper whenever possible. Library of Congress Cataloging-in-Publication Data Ball, Stuart R., 1956– Analog interfacing to embedded microprocessors : real world design / Stuart Ball. p. cm. ISBN 0-7506-7339-7 (pbk. : alk. paper) 1. Embedded computer

Mehhatroonika
Mictrocontroller Week 03
14
pdf

Mictrocontroller Week 03

Mictrocontroller Week 03 Numbering systems 1. Convert the decimal number 123.456 to the following formats, taking whole numbers and fractions into account. Show calculations. a) binary b) hexadecimal c) base-5 d) BCD === 1. a) 0111 1011.0111 01002 b) 7B.7416 c) 443.2125 d) 0001 0010 0011.0100 0101 01102 === 2. Extend the following unsigned 8-bit binary numbers to their 16-bit equivalents and convert the result to hexadecimal. a) 011010112 b) 101101012 === 2. a) 006B b) 00B5 === 3. Extend the following signed two’s complement 8-bit binary numbers to their 16-bit equivalents and convert the result to hexadecimal. a) 011010112 b) 101101012 === 3. a) 006B b) FFB5 === Logic and arithmetic 4. Using two’s complement arithmetic, calculate the following (choose a suitable number of bits for the representation): a) 121 – 185 b) -70 – 88 == 4. Convert back to verify answer == 5. Calculate the following without converting the number base. Show calculations.

Mehhatroonika
Lühendite seletus
120
doc

Lühendite seletus

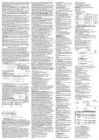
A... AA Auto Answer AAA Authentication, Authorization and Accounting AAB All-to-All Broadcast AAC Advanced Audio Coding AACS Advanced Access Control System AAL Asynchronous Transfer Mode Adaption Layer AAM Automatic Acoustic Management AAP Applications Access Point [DEC] AARP AppleTalk Address Resolution Protocol AAS All-to-All Scatter AASP ASCII Asynchronous Support Package AAT Average Access Time AATP Authorized Academic Training Program [Microsoft] .ABA Address Book Archive (file name extension) [Palm] ABAP Advanced Business Application Programming [SAP] ABC * Atanasoff-Berry Computer (First digital calculating machine that used vacuum tubes) ABEND Abnormal End ABI Application Binary Interface ABIOS Advanced BIOS ABIST Automatic Built-In Self-Test [IBM] ABLE Adaptive Battery Life Extender + Agent Building and Learning Environment [IBM] ABM Asynchronous Balanced Mode ABR Available Bit Rate ABRD

Informaatika
Statistika ülesanned-Andmetöötlus
47
xlsx

Statistika ülesanned. Andmetöötlus.

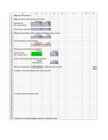
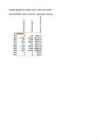
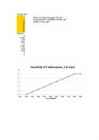
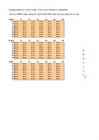
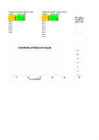
Korrelatsioon- ja regressioonanalüüs - eng. Correlation and Regression Lifetime Lost Due to Smoking Allikas: https://www.spreadsheetweb.com/time-lost-due-to-smoking-calculator/ time X - suitsetatud aastate arv # sig - keskmine suitsetatud sigarettide arv päevas lost Y - prognoositud kaotatud eluaastate arv Hajuvusdiagramm time X # sig lost Y 1 1 0.01 1 5 0.04 20 2 8 0.12 18 Kaotatud eluaastate arv 5 10 0.38 16 5 20 0.76 14 7 4

Andme-ja tekstitöötlus
Andmeanalüüs MS Exceli abil
43
pdf

Andmeanalüüs MS Exceli abil

Andmeanalüüs MS Exceli abil Andmeanalüüs MS Exceli abil Järgnev õpetus püüab võimalikult 'puust ja punaselt' ette näidata elementaarse andmeanalüüsi teostamise võimalused MS Excelis. Samas ei ole see materjal mõeldud matemaatilise statistika konspektiks, vastavad teadmised/materjalid eeldatakse kasutajal enesel olemas olevat. Seetõttu pole ka eriti tegeletud konkreetsete näidetega ega tulemuste tõlgendamisega. See konspekt ei ole Andres Kiviste 1998 aastal ilmunud vihiku "Matemaatilise statistika algteadmisi ja rakenduslikke näiteid MS Exceli keskkonnas" ümbertrükk. MS

Informaatika


Meedia

Kommentaarid (0)

Kommentaarid sellele materjalile puuduvad. Ole esimene ja kommenteeri


Sellel veebilehel kasutatakse küpsiseid. Kasutamist jätkates nõustute küpsiste ja veebilehe üldtingimustega Nõustun