Vormistamine ülesanne 3 (0)
Edith D. de Leeuw, Joop J. Hox, Don A. Dillman
INTERNATIONAL HANDBOOK OF
SURVEY METHODOLOGY
ÜLESANNE
Õppeaines: SISSEJUHATUS ERIALASSE
Tehnoloogia ja ringmajanduse instituut
Õpperühm:
Juhendaja:
Tallinn 2021
TABLE OF CONTENTS
2
1 THE CORNERSTONES OF SURVEY RESEARCH
1.1 Introduction
The idea of conducting a survey is deceptively simple. It involves identifying a specific group or
category of people and collecting information from some of them in order to gain insight into what
the entire group does or thinks; however, undertaking a survey inevitably raises questions that may
be difficult to answer. How many people need to be surveyed in order to be able to describe fairly
accurately the entire group? How should the people be selected? What questions should be asked
and how should they be posed to respondents? In addition, what data collection methods should one
consider using, and are some of those methods of collecting data better than others? And, once one
has collected the information, how should it be analyzed and reported? Deciding to do a survey
means committing oneself to work through a myriad of issues each of which is critical to the
ultimate success of the survey.
Yet, each day, throughout the world, thousands of surveys are being undertaken. Some surveys
involve years of planning, require arduous efforts to select and interview respondents in their home
and take many months to complete and many more months to report results. Other surveys are
conducted with seemingly lightning speed as web survey requests are transmitted simultaneously to
people regardless of their location, and completed surveys start being returned a few minutes later;
data collection is stopped in a few days and results are reported minutes afterwards. Whereas some
surveys use only one mode of data collection such as the telephone, others may involve multiple
modes, for example, starting with mail, switching to telephone, and finishing up with face-to-face
interviews. In addition, some surveys are quite simple and inexpensive to do, such as a mail survey
of members of a small professional association. Others are incredibly complex, such as a survey of
the general public across all countries of the European Union in which the same questions need to
be answered in multiple languages by people of all educational levels.
In the mid-twentieth century there was a remarkable similarity of survey procedures and methods.
Most surveys of significance were done by face-toface interviews in most countries in the world.
Self-administered paper surveys, usually done by mail, were the only alternative. Yet, by the 1980s
the telephone had replaced face-to-face interviews as the dominate survey mode in the United
States, and in the next decade telephone surveys became the major data collection method in many
countries. Yet other methods were emerging and in the 1990s two additional modes of surveying—
3
the Internet and responding by telephone to prerecorded interview questions, known as Interactive
Voice Response or IVR, emerged in some countries. Nevertheless, in some countries the face-to-
face interview remained the reliable and predominantly used survey mode.
Never in the history of surveying have their been so many alternatives for collecting survey data,
nor has there been so much heterogeneity in the use of survey methods across countries.
Heterogeneity also exists within countries as surveyors attempt to match survey modes to the
difficulties associated with finding and obtaining response to particular survey populations.
Yet, all surveys face a common challenge, which is how to produce precise estimates by surveying
only a relatively small proportion of the larger population, within the limits of the social, economic
and technological environments associated with countries and survey populations in countries. This
chapter is about solving these common problems that we described as the cornerstones of
surveying. When understood and responded to, the cornerstone challenges will assure precision in
the pursuit of one’s survey objectives.
1.2 What is a survey?
A quick review of the literature will reveal many different definitions of what constitutes a survey.
Some handbooks on survey methodology immediately describe the major components of surveys
and of survey error instead of giving a definition (e.g., Fowler, Gallagher, Stringfellow, Zalavsky
Thompson & Cleary, 2002, p. 4; Groves, 1989, p. 1), others provide definitions, ranging from
concise definitions (e.g., Czaja & Blair, 2005, p. 3; Groves, Fowler, Couper, Lepkowski, Singer &
Tourangeau, 2004, p. 2; Statistics Canada, 2003, p. 1) to elaborate descriptions of criteria (Biemer
& Lyberg, 2003, Table 1.1). What have these definitions in common? The survey research methods
section of the American Statistical Association provides on its website an introduction (Scheuren,
2004) that explains survey methodology for survey users, covering the major steps in the survey
process and explaining the methodological issues. According to Scheuren (2004, p. 9) the word
survey is used most often to describe a method of gathering information from a sample of
individuals. Besides sample and gathering information, other recurring terms in definitions and
descriptions are systematic or organized and quantitative. So, a survey can be seen as a research
strategy in which quantitative information is systematically collected from a relatively large sample
taken from a population.
Most books stress that survey methodology is a science and that there are scientific criteria for
survey quality. As a result, criteria for survey quality have been widely discussed. One very general
4
definition of quality is fitness for use. This definition was coined by Juran and Gryna in their 1980s
book on quality planning and analysis, and has been widely quoted since. How this general
definition is further specified depends on the product that is being evaluated and
the user. For example, quality can be focusing on construction, on making sturdy and safe furniture,
and on testing it. Like Ikea, the Swedish furniture chain, that advertised in its catalogs with
production quality and gave examples on how a couch was tested on sturdiness. In survey statistics
the main focus has been on accuracy, on reducing the mean squared error or MSE. This is based on
the Hansen and Hurwitz model (Hansen, Hurwitz, & Madow, 1953; Hansen, Hurwitz, & Bershad,
1961) that differentiates between random error and systematic bias, and offers a concept of total
error (see also Kish, 1965), which is still the basis of current survey error models. The statistical
quality indicator is thus the MSE: the sum of all squared variable errors and all squared systematic
errors. A more modern approach is total quality, which combines both ideas as Biemer and Lyberg
(2003) do in their handbook on survey quality. They apply the concept of fitness for use to the
survey process, which leads to the following quality requirements for survey data: accuracy as
defined by the mean squared error, timeliness as defined by availability at the time it is needed, and
accessibility, that is the data should be accessible to those for whom the survey was conducted.
There are many stages in designing a survey and each influences survey quality. Deming (1944)
already gave an early warning of the complexity of the task facing the survey designer, when he
listed no less than thirteen factors that affect the ultimate usefulness of a survey. Among those ar
the relatively well understood effects of sampling variability, but also more difficult to measure
effects. Deming incorporates effects of the interviewer, method of data collection, nonresponse,
questionnaire imperfections, processing errors and errors of interpretation. Other authors (e.g., Kish,
1965, see also Groves, 1989) basically classify threats to survey quality in two main categories, for
instance differentiating between errors of nonobservation (e.g., nonresponse) and observation (e.g.,
in data collection and processing). Biemer and Lyberg (2003) group errors in sampling error and
nonsampling error. Sampling error is due to selecting a sample instead of studying the whole
population. Nonsampling errors are due to mistakes and/or system deficiencies, and include all
errors that can be made during data collection and data processing, such as coverage, nonresponse,
measurement, and coding error (see also Lyberg & Biemer, Chapter 22).
In the ensuing chapters of this handbook we provide concrete tools to incorporate quality when
designing a survey. The purpose of this chapter is to sensitize the reader to the importance of
designing for quality and to introduce the methodological and statistical principles that play a key
5
role in designing sound quality surveys.
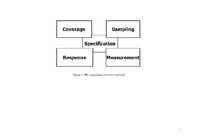
A useful metaphor is the design and construction of a house. When building a house, one carefully
prepares the ground and places the cornerstones. This is the foundation on which the whole
structure must rest. If this foundation is not designed with care, the house will collapse or sink in
the unsafe, swampy underground as many Dutch builders have experienced in the past. In the same
way, when designing and constructing a survey, one should also lay a well thought-out foundation.
In surveys, one starts with preparing the underground by specifying the concepts to be measured.
Then these clearly specified concepts have to be translated, or in technical terms, operationalized
into measurable variables. Survey methodologists describe this process in terms of avoiding or
reducing specification errors. Social scientists use the term construct validity: the extend to which a
measurement method accurately represents the intended construct. This first step is conceptual
rather than statistical; the concepts of concern must be defined and specified. On this foundation we
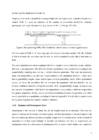
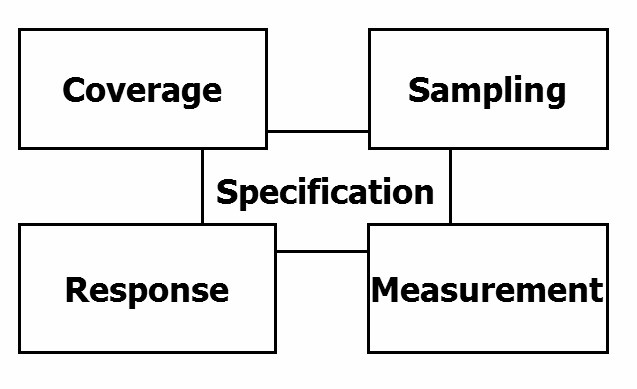
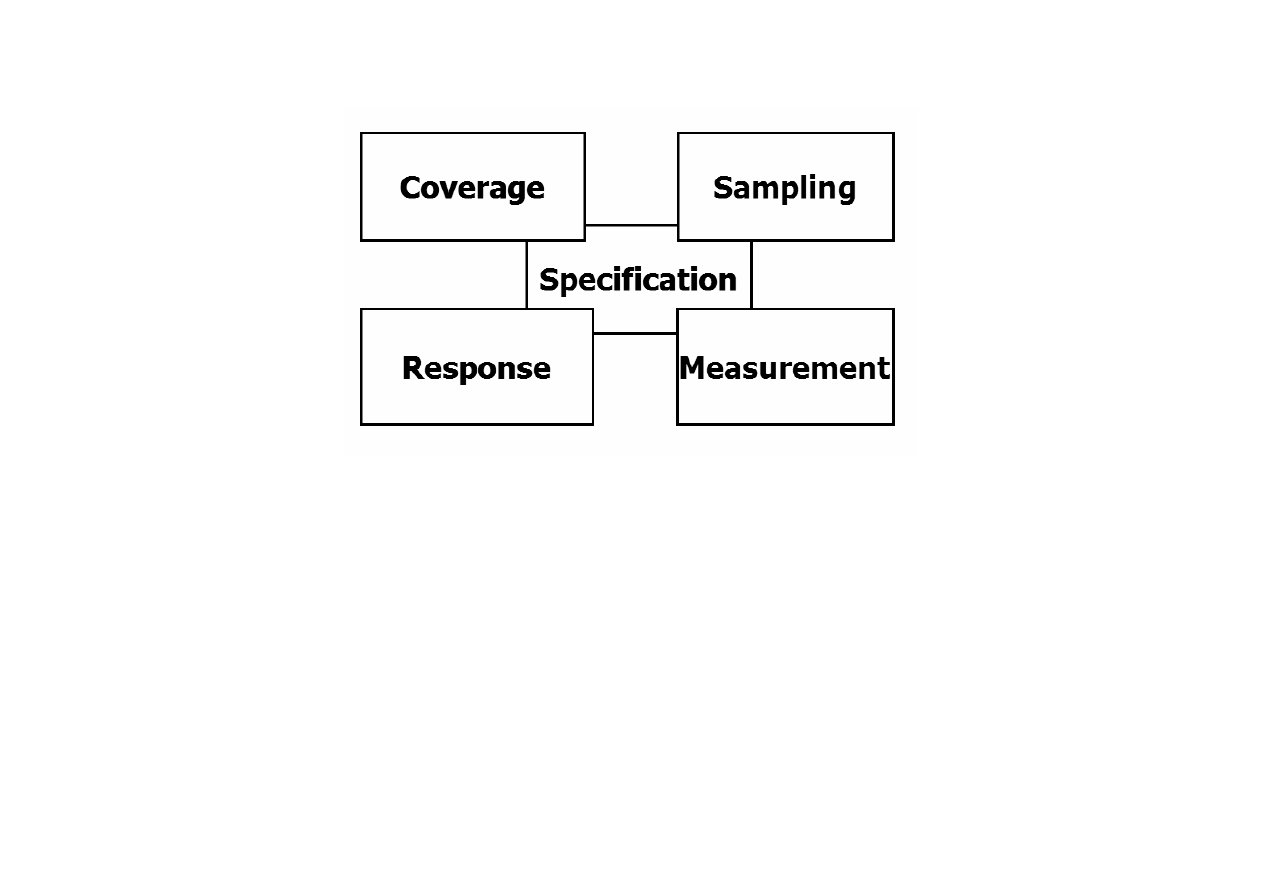
place the four cornerstones of survey research: coverage, sampling, response, and measurement
(Salant & Dillman, 1994; see also Groves, 1989).
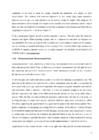
6
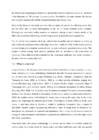
Figure 1. The cornerstones of survey research
7
Figure 1.1 provides a graphical picture of the cornerstone metaphor. Only when these cornerstones
are solid, high quality data are collected, which can be used in further processing and analysis. In
this chapter we introduce the reader to key issues in survey research
1.3 Breaking the ground: specification of the Research and the survey
questions
The first step in the survey process is to determine the research objectives. The researchers have to
agree on a well-defined set of research objectives. These are then translated into a set of key
research questions. For each research question one or more survey questions are then formulated,
depending on the goal of the study. For example, in a general study of the population one or two
general questions about well-being are enough to give a global indication of well-being. On the
other hand, in a specific study of the influence of social networks on feelings of well-being among
the elderly a far more detailed picture of wellbeing is needed and a series of questions has to be
asked, each question measuring a specific aspect of well-being. These different approaches are
illustrated in the text boxes noted later.
Survey methodologists have given much attention to the problems of formulating the actual
questions that go into the survey questionnaire (cf. Fowler & Cosenza, Chapter 8). Problems of
question wording, questionnaire flow, question context, and choice of response categories have
been the focus of much attention. Much less attention has been directed at clarifying the problems
that occur before the first survey question is committed to paper: the process that leads from the
theoretical construct to the prototype survey item (cf. Hox, 1997). Schwarz (1997) notes that large-
scale survey programs often involve a large and heterogeneous group of researchers, where the set
of questions finally agreed upon is the result of complex negotiations. As a result, the concepts
finally adopted for research are often vaguely defined.
When thinking about the process that leads from theoretical constructs to survey questions, it is
useful to distinguish between conceptualization and operationalization. Before questions can be
formulated, researchers must decide which concepts they wish to measure. They must define they
intend to measure by naming the concept, describing its properties and its scope, and defining
important subdomains of its meaning. The subsequent process of operationalization involves
choosing empirical indicators for each concept or each subdomain. Theoretical concepts are often
referred to as ‘constructs’ to emphasize that they are theoretical concepts that have been invented or
adopted for a specific scientific purpose (Kerlinger, 1986). Fowler and Cosenza’s (Chapter 8)
8
discussion of the distinction between constructs and survey questions follows these line of
reasoning.
To bridge the gap between theory and measurement, two distinct research strategies are advocated:
a theory driven or top down strategy, which starts with constructs and works toward observable
variables and a data driven or bottom up strategy, which starts with observations and works towards
theoretical constructs (cf. Hox & De Jong-Gierveld, 1990). For examples of such strategies we refer
to Hox (1997).
When a final survey question as posed to a respondent fails to ask about what is essential for the
research question, we have a specification error. In other words, the construct implied in the survey
question differs from the intended construct that should be measured. This is also referred to as a
measurement that has low construct validity. As a result, the wrong parameter is estimated and the
research objective is not met. A clear example of a specification error is given by Biemer and
Lyberg (2003, p. 39). The intended concept to be measured was “…the value of a parcel of land if it
were sold on a fair market today.” A potential operationalization in a survey question would be
“For what price would you sell this parcel of land?” Closer inspection of this question reveals that
this question asks what the parcel of land is subjectively worth to the farmer. Perhaps it is worth so
much to the farmer that she/he would never sell it at all.
There are several ways in which one can investigate whether specification errors occur. First of all,
the questionnaire outline and the concept questionnaire should always be thoroughly discussed by
the researchers, and with the client or information users, and explicit checks should be made
whether the questions in the questionnaire reflect the study objectives. In the next step, the concept
questionnaire should be pretested with a small group of real respondents, using so called cognitive
lab methods. These are qualitative techniques to investigate whether and when errors occur in the
question-answer process. The first step in the question answer process is understanding the
question. Therefore, the first thing that is investigated in a pretest is if the respondents understand
the question and the words used in the question as intended by the researcher. Usually questions are
adapted and/or reformulated, based on the results of questionnaire pretests. For a good description
of pretesting, methods, see Campanelli Chapter 10. Whenever a question is reformulated, there is
the danger of changing its original (intended) meaning, and thus introducing a new specification
error. Therefore, both the results of the pretests and the final adapted questionnaire should again be
thoroughly discussed with the client.
9
1.4 Placing the cornerstones: coverage,sampling, nonresponse, and
measurement
As noted earlier, specification of the research question and the drafting of prototype survey
questions are conceptual rather than statistical; it concerns the construct validity of the
measurement. In other words, does the question measure what it is supposed to measure, does it
measure the intended theoretical construct (Cronbach & Meehl, 1955). In contrast, the sources of
data collection error summarized in our four cornerstones can be assessed statistically by examining
the effect they have on the precision of the estimates. Three of the four cornerstones refer explicitly
to the fact that surveys typically collect data from a sample, a fraction of the population of interest.
Coverage error occurs when some members of the population have a zero probability of being
selected in the survey sample. For example, the sample list (frame) may fail to cover all elements of
the population to which one wants to generalize results. Sampling error occurs because only a
subset of all elements (people) in the population is actually surveyed. Sampling error is statistically
well understood provided that probability samples are used: in general the amount of sampling error
is a direct function of the number of units included the finaal sample. For a clear discussion of
coverage and sampling, see Lohr (Chapter 6). Nonresponse error occurs when some of the sampled
units do not respond and when these units differ from those who do and in a way relevant to the
study. For an introduction into nonresponse and nonresponse error, see Lynn (Chapter 3). The last
cornerstone is measurement error, which occurs when a respondent’s answer to a question is
inaccurate, departs from the “true” value (see also Hox, Chapter 20).
A perfect survey would minimize all four sources of errors. Coverage error is avoided when every
member of the population has a known and nonzero chance of being selected into the survey.
Sampling error is reduced simply by sampling enough randomly selected units to achieve the
precision that is needed. Nonresponse error is avoided if everyone responds or if the respondents
are just like the nonrespondents in terms of the things we are trying to measure. Measurement error
can be prevented by asking clear questions; questions that respondents are capable and willing to
answer correctly. In the survey design stage the methodological goal is to prevent or at least reduce
potential errors; in the analysis stage the statistical goal is to adjust the analysis for errors in such a
way that correct (i.e., unbiased and precise) results are produced. The methodological survey
literature suggests a variety of methods for reducing the sources of survey error; however, one
should keep in mind that there is more than one source of error and that one has to compromise and
choose when attempting to reduce total survey error. And, do this all within a workable budget too;
10
or as Lyberg and Biemer put it in Chapter 22: “the challenge in survey design is to achieve an
optimal balance between survey errors and costs.” In the remainder we discuss the four
cornerstones in more detail and relate these to specific chapters in this book.
1.4.1 Coverage and Coverage Error
When doing a survey one has an intended population in mind: the tärget population. To draw a
sample from the target population, a sample frame is needed. This can be a list of target population
members, for instance, a list of all members of a certain organization, or the register of all
inhabitants of a certain city. But it may also be a virtual list, or an algorithm, such as in area
probability sampling or in Random Digit Dialing (RDD) sampling (cf. Lohr, Chapter 6 on coverage
and sampling, and Steeh, Chapter 12 on RDD). In area probability sampling, the population is
divided into clusters based on geographical proximity, and then specific areas are selected. In RDD,
random telephone numbers are generated using an algorithm that conforms to properties of valid
telephone numbers in the country that is being investigated. Frame coverage errors occur when
there is a mismatch between the sampling frame and the target population. In other words when
there is no one-to-one correspondence between the units in the frame and the units in the target
population.
The most common form of coverage error is undercoverage, that is, not all units of the target
population are included in the sampling frame. A clear example of undercoverage is persons with
an unlisted phone number when the sampling frame is the telephone book. Another form of
coverage error is overcoverage; here a unit from the target population appears more than once in the
sampling frame. Duplications like this can occur when a sampling frame results from the
combination of several lists. For example, on one list a woman is listed under her maiden name, and
on a second list under her married name. If these lists are combined, the same person is listed under
two different entries. Another example is surveys that use mobile (cell) telephones; these overcover
persons who own more than one phone. A third type of coverage error is caused by erroneous
inclusions in the frame. For example, a business number is included on a list with household phone
numbers.
As a final example, consider the case of web surveys. A common way to attract respondents to a
web survey is placing a link to the survey on a populaar web site. Basically, this means that the
researcher has no control over who responds to the questionnaire. Coverage error for web surveys is
related to two different causes (cf. Ramos, Sevedi, & Sweet, 1998). First, it is the respondent who
11
has to make contact with the data collection program. In a web survey, this requires access to a
computer and the internet, plus some degree of computer skill. Individuals who lack these are not
covered. In addition, interviewing software is in general not hardware or software independent.
Screens look differently in different resolutions, or when different browsers are used to access the
survey website, and some combinations of hardware and software may make the survey website
inaccessible to some users, resulting in coverage error. For an overview of different types of web
surveys and their potential for errors, see lozar manfreda and vehovar (chapter 14).
The availability of comprehensive lists or algorithms that cover the population differs widely
depending on the target population, but also on the country. For instance, in countries like Denmark
and The Netherlands the national statistical agency has access to the population registry (see also
Bethlehem Chapter 26). This makes it possible for the national statistical agency to draw a
probability sample not only of the general population, but also to draw specific subsamples. Some
countries have good lists of mobile phone users, whereas others do not. In some areas, the
telephone system has a welldefined structure of used and unused number banks, which makes it
possible to generate random telephone numbers with good coverage properties. In most areas, the
telephone system does not have such a structure or several competing telephone systems are in use,
which makes generating random telephone numbers more difficult (cf. Steeh, Chapter 12).
Web surveys are a special challenge to survey methodologists, because the coverage problem is
large and difficult to solve. There are no lists of the population that can be used to draw samples
with known properties. Email addresses have no common structure that can be used to generate
random addresses similar to the way random telephone numbers are generated in RDD. Finally, the
often-used volunteer samples are convenience samples, for which coverage cannot be determined
(cf. Lozar Manfreda & Vehovar, Chapter 14).
1.4.2 Sampling and Sampling Error
Sampling error occurs because only a sample of the population is investigated instead of the whole
population. Sampling and sampling error is treated by Lohr (Chapter 6). Based on the values for the
variables in the probability sample, the value for the population is estimated using statistical theory.
When simple random sampling is used, standard statistical techniques can be used; however, when
more complicated sampling schemes are used, such as cluster sampling or stratification, the
standard statistical techniques do not provide accurate pvalues and confidence intervals and more
complicated statistical techniques should be used. Methods for analyzing complex survey designs
12
are discussed by Stapleton in Chapter 18.
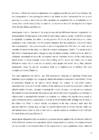
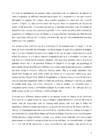
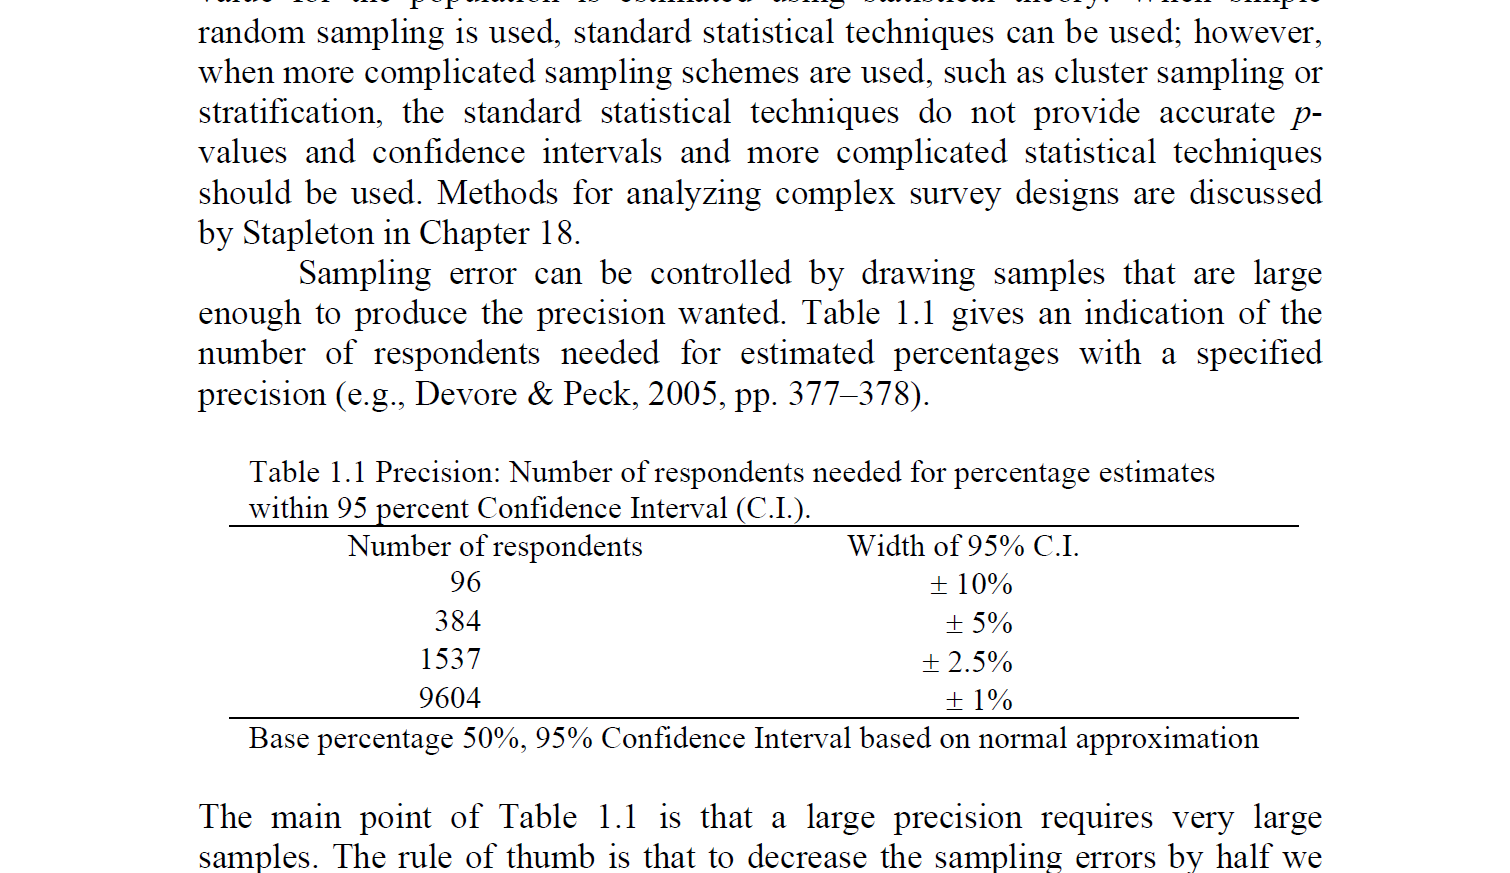
Sampling error can be controlled by drawing samples that are large enough to produce the precision
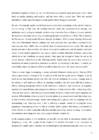
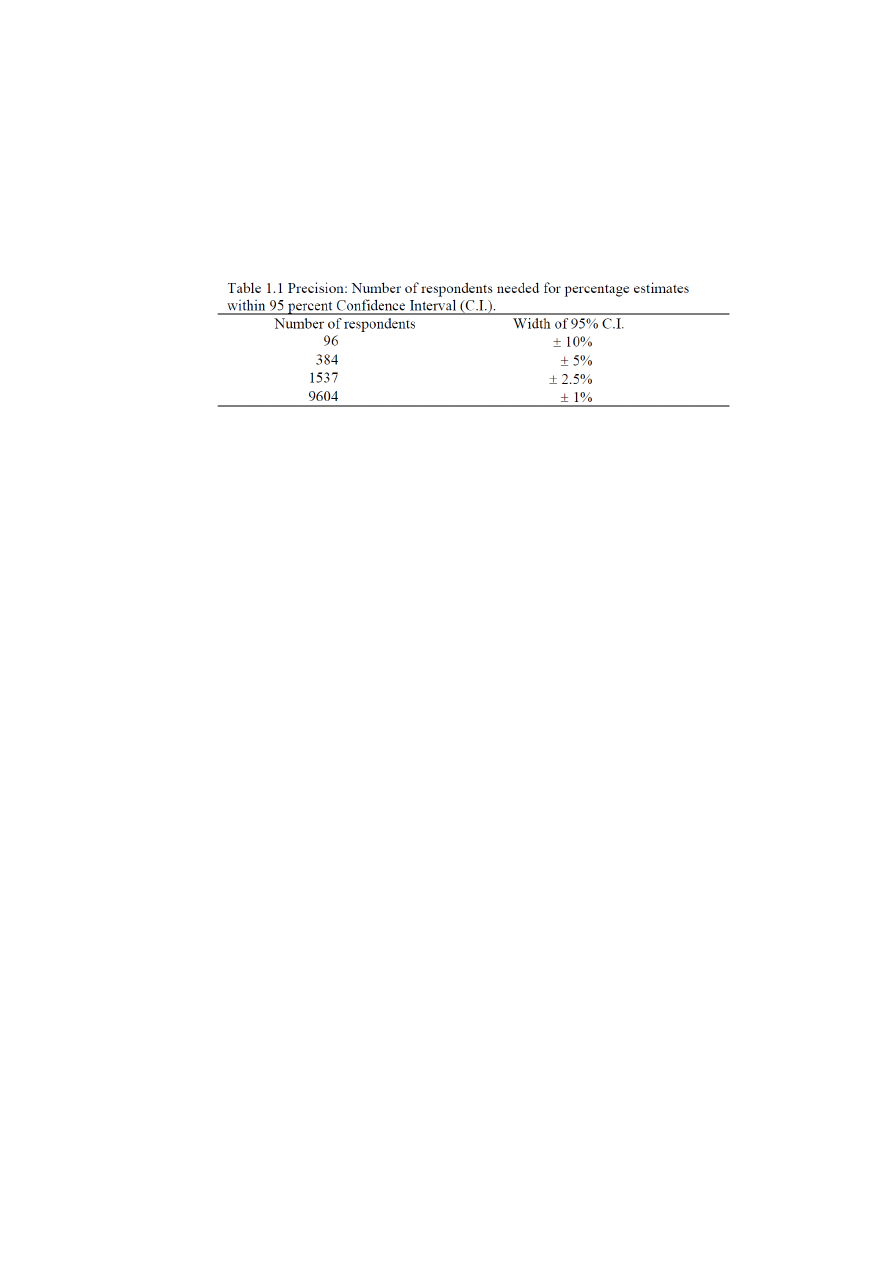
wanted. Table 1.1 gives an indication of the number of respondents needed for estimated
percentages with a specified precision (e.g., Devore & Peck, 2005, pp. 377–378).
Figure 2. Base percentage 50%, 95% Confidence Interval based on normal approximation
The main point of Table 1.1 is that a large precision requires very large samples. The rule of thumb
is that to decrease the sampling errors by half we need a completed sample that is four times as
large.
The most important issue about sampling is that if our sample is not a probability sample, statistical
inference is not appropriate. The difference between probability and nonprobability sampling is that
nonprobability sampling does not use a random selection procedure. This does not necessarily
mean that nonprobability samples are unrepresentative of the population; however, it does mean
that nonprobability samples cannot depend upon statistical probability theory. With a probabilistic
sample, we know the probability that we represent the population well and therefore we can
estimate confidence intervals and significance tests. With a nonprobability sample, we may or may
not represent the population well, but it is not appropriate to apply statistical inference to generalize
to a general population. At best, we can use statistical inference to assess the precision with which
we can generalize to a population consisting of whoever responded. Whether this is representative
for any general population is beyond statistical inference.
1.4.3 Response and Nonresponse Error
Nonresponse is the inability to obtain data for all sampled units on all questions. There are two
types of nonresponse in surveys: unit nonresponse and item nonresponse. Unit nonresponse is the
failure to obtain any information from an eligible sample unit. Unit nonresponse can be the result of
noncontact or refusal. Lynn (Chapter 3) provides an extensive overview on nonresponse and
nonresponse error; for a discussion of nonresponse error in cross-cultural studies, see Couper and
13
de Leeuw (2003); for statistical adjustment and weighting see Biemer and Christ (Chapter 16).
Item-nonresponse or item missing data refers to the failure to obtain information for one or more
questions in a survey, given that the other questions are completed. For an introduction see de
Leeuw, Hox, and Huisman (2003), for statistical approaches to deal with missing data see Chapter
18 by Rässler, Rubin, and Schenker.
Nonresponse error is a function of the response rate and the differences between respondents and
nonrespondents. If nonresponse is the result of a pure chance process, in other words if nonresponse
is completely at random, then there is no real problem. Of course, the realized sample is smaller,
resulting in larger confidence intervals around estimators. But the conclusions will not be biased
due to nonresponse. Only when respondents and nonrespondents do differ from each other on the
variables of interest in the study, will there be a serious nonresponse problem. The nonresponse is
then selective nonresponse and certain groups may be underrepresented. In the worst case, there is a
substantial association between the nonresponse and an important variable of the study causing
biased results. A classic example comes from mobility studies: people who travel a lot are more
difficult to contact for an interview on mobility than people who travel rarely. Thus, selective
nonresponse caused by specific noncontacts leads to an underestimate of mobility. For more
examples, see Lynn (Chapter 3).
Two main approaches are used to cope with nonresponse: reducing and adjusting. Nonresponse
reduction applies strategies that, in general, reduce the number of noncontacts and refusals. Causes
of noncontact depend on the specific survey design. For instance, in face-to-face surveys,
noncontact can be the result of the inability of the interviewer to reach the respondent within the
allotted number of contact attempts. Increasing the number of contact attempts not only increases
the number of contacted and thus the response rate, but also the costs. Varying the days and times at
which contact is attempted also increases the response rate, without affecting the cost as much. In
mail and Internet surveys, noncontacts can be the result of undeliverable mailings due to errors in
the address list. Tools to reduce refusals also depend on the data collection mode used. For
instance, interview surveys may use specially trained interviewers to convert refusals, while mail
and Internet surveys have to rely on incentives or special contacts to counteract explicit refusals.
For more detail, see Lynn (Chapter 3).
Nonresponse adjustment refers to statistical adjustments that are applied after the data are collected.
If the difference between the respondents and the nonrespondents is known, for instance because
we can compare certain characteristics of the respondents to known population values, statistical
14
weighting can be used to make the sample resemble the population with respect to these
characteristics. The problem with statistical adjustment is that usually only simple respondent
attributes such as age, sex, and education can be used to weigh the sample. This improves the
representativeness of the sample with respect to the variables of central substantive interest only if
these variables are related to the attributes used in the weighting scheme. Biemer and Christ discuss
weighting for survey data in detail in Chapter 17.
Finally, nonresponse figures should be clearly reported in surveys. This often takes the form of a
response rate figure. When reporting response rates it is important to state how the response rate
was calculated. For details of response rate calculation and a description of sources of nonresponse,
see the brochure on standard definitions of the American Association for Public Opinion Research
(AAPOR). A regularly updated version and an online response rate calculator can be found on the
AAPOR website (www.aapor.org).
1.4.4 Measurement and Measurement Error
Measurement error is also called error of observation. Measurement errors are associated with the
data collection process itself. There are three main sources of measurement error: the questionnaire,
the respondent, and the method of data collection. When interviewers are used for data collection,
the interviewer is a fourth source of error.
A well-designed and well-tested questionnaire is the basis for reducing measurement error. The
questions in the questionnaire must be clear, and all respondents must be able to understand the
terms used in the same way. With closed questions, the response categories should be well defined,
and exhaustive. When a question is not clear, or when the response categories are not clearly
defined, respondents will make errors while answering the question or they do not know what to
answer. When the data are collected through interviews, interviewers will then try to help out, but
in doing this they can make errors too and introduce additional interviewer error (Fowler, 1995).
Therefore, improving the questionnaire is a good start to improve the total survey quality. For a
good introduction into designing and writing effective questions, see Fowler and Cosenza (Chapter
8). It should be emphasized that even carefully designed questionnaires may contain errors and that
a questionnaire should always be evaluated and pretested before it may be used in a survey. In
Chapter 10 Campanelli provides the reader with information about the different methods for testing
survey questions and gives practical guidelines on the implementation of each of the methods.
Respondents can be a source of error in their own right when they provide incorrect information.
15
This may be unintentional, for instance when a respondent does not understand the question or
when a respondent has difficulty remembering an event. But a respondent can also give incorrect
information on purpose, for instance when sensitive questions are asked (see also Lensvelt-
Mulders, Chapter 23). Measurement errors that originate from the respondent are beyond the
control of the researcher. A researcher can only try to minimize respondent errors by making the
respondent’s task as easy and as pleasant as possible. In other words, by writing clear questions that
respondents are willing to answer. In Chapter 2, Schwarz, Knäuper, Oyserman, and Stich describe
how respondents come up with an answer and review the cognitive and communicative processes
underlying survey responses.
The method of data collection can be a third source of measurement error. In Chapter 7 of this
book, de Leeuw describes the advantages and disadvantages of major data collection techniques.
One of the key differences between survey modes is the way in which certain questions can be
asked. For instance, in a telephone interview respondents have to rely on auditive cues only: they
only hear the question and the response categories. This may cause problems when a long list of
potential answers has to be presented. Dillman, in Chapter 9 on the logic and psychology of
questionnaire design, describes mode differences in questionnaire design and proposes a unified or
uni mode design to overcome differences between modes. This is of major importance when
mixed-mode designs are used, either within one survey, or in longitudinal studies (e.g., panel
surveys see also Chapter 25 by Sikkel & Hoogendoorn), or between surveys as can be the case in
cross-national and comparative studies in which one mode (e.g., telephone) is used in one country
an another mode (e.g., face-to-face interviews) is used in another. For important issues in
comparative survey research, see Harkness (Chapter 4); for more detail on the challenges of mixed
mode surveys, see De Leeuw, Dillman, and Hox (Chapter 16).
A second major difference between modes is the presence versus the absence of an interviewer.
There may be very good reasons to choose a method without interviewers and leave the locus of
control with the respondents, such as ensuring more privacy and more time to reflect for
respondents. Selfadministered questionnaires in general are described by De Leeuw and Hox in
Chapter 13; technological innovations are described by Lozar Manfreda and Vehovar in Chapter 14
on Internet Surveys and by Miller Steiger and Conroy in Chapter 15 on Interactive Voice Response.
On the other hand, using interviewers also has many positive points, especially when very complex
questionnaires are used or when special tasks have to be performed. As Loosveldt states in Chapter
11: “…the task of the interviewer is more comprehensive and complex than merely asking
16
questions and recording the respondent’s answer. Interviewers implement the contact procedure,
persuade the respondents to participate, clarify the respondent’s role during the interview and
collect information about the respondent.”
However, when an interviewer is present, the interviewer can be a source of error too. Interviewers
may misinterpret a question, may make errors in administering a questionnaire, or in registering the
answers. When posing the question, interviewers may unintentionally change its meaning. By
giving additional information or explaining a misunderstood word, they may inappropriately
influence a respondent. Even the way interviewers look and dress may influence a respondent in a
face-to-face interview. Selecting and training interviewers carefully helps reducing interviewer
related errors. For more details, see Chapter 23 on interviewer training by Lessler, Eyerman, and
Wang. Interviewers can make genuine mistakes, but they also may intentionally cheat. Interviewers
have been known to falsify data, or skip questions to shorten tedious interviews. Monitoring
interviewers helps to reduce this. Having a quality controller listening in on telephone interviewers
is a widely used method. In face-to-face interviews, recordings can be made and selected täpes can
be checked afterwards. Special verification contacts or re-interviews may be used to evaluate
interviewer performance in large-scale face-to-face surveys (cf. Lyberg & Biemer, Chapter 22;
Japec, 2005, p. 24). [CITATION Edi08 \n \y \t \l 1033 ]
17
Works Cited
CITATION Edi08 \n \y \t \l 1033 : , [1],
18
See on täidetud versioon TKTK vormistus aine ülesanne 3-st
Kasutatud allikad
Sarnased õppematerjalid
![English as a Global Language]()
60
pdf
English as a Global Language
Tallinna Mustamäe Humanitargümnaasium
Valeria Jefremenkova
ENGLISH AS A GLOBAL LANGUAGE
INGLISE KEEL KUI ÜLEMAAILMNE KEEL
Research work
Supervisor: Jevgenija Kozlova
Tallinn 2016
1
�Table of Contents
СONTENT…………………………………………………………………………………...2
INTRODUCTION…………………………………………………………………………...3
CHAPTER I……………………………………………………………………………….....5
1.1. A Brief History of the English Language…………………………………………...…..5
1.2. Origins of English as the Global Language……………………………………..……....6
1.3. Necessity of a Global Language...……………………………………………………....8
1.4. Critici
![Automaatika referaat-eng]()
10
doc
Automaatika referaat (eng)
Tallinna Polütehnikum
Automation
Author: TomTom2
Group :AA-09
Instructor: Marina Zotikova
� Tallinn 2010
Contents
Introduction......................................................................................................................3-4
Person Knowledge Technologies supports......................................................................4-6
Online Essay Evaluation Service.....................................................................................6-7
WordNet lexical database................................................................................................7-8
Practice Online (TPO)......................................................................................................8-9
Conclusion..........................
![Psühholoogia bioloogiline--kognitiivne- ja sotsiaalne vaade]()
26
doc
Psühholoogia bioloogiline-, kognitiivne- ja sotsiaalne vaade
PSYCHOLOGY PART 1: CORE
Biological level of analysis
Outline principles that define the biological level of analysis.
1) Behavior can be innate, because it is genetically based. Evolution may play a
key role in behavior.
2) Animals may be studied as a means of understanding human behavior.
3) There are biological correlates of behavior. Cognitions, emotions and
behaviors are products of the anatomy and physiology of our nervous and
endocrine system.
Explain how principles of the biological level of analysis may be demonstrated in
research.
1) Correlational studies: Study by Buss, who hypothesized that across cultures,
men will prefer to marry younger women because of greater reproductive
capacity and women will place greater value on a potential mate's earning
potential to provide survival advantages. This evolutionary hypothesis was
tested in 37 cultures by sending out questioners.
2) Twin studies (type of correlational stud
![ECDIS Voyage planning]()
31
ppt
ECDIS Voyage planning
Voyage Planning
� Voyage Planning
The key elements of the Voyage Plan are:
Appraising all relevant information
Planning the intended voyage
Executing the plan taking account of prevailing
conditions
Monitoring the vessel’s progress against the
plan continuously
� Planning
The detailed voyage or passage plan should
include the following factors:
1) the plotting of the intended route or track of the
voyage or passage on appropriate scale charts:
the true direction of the planned route or track
should be indicated, as well as all areas of
danger, existing ships' routeing and reporting
systems, vessel traffic services, and any areas
where marine environmental protection
considerations apply;
2) the main elements to ensure safety of life at sea,
safety and efficiency of navigation, and
protection of the marine environment during the
intended voyage or passage; such elements
should include, but not be limited
![Tööstuslik andmeside kontrolltöö 2 abimaterjal - vastused]()
3
doc
Tööstuslik andmeside kontrolltöö 2 abimaterjal - vastused
oData transparency: In bit and byte oriented protocols, there is a problem if a control character (for ETX (End of Text) ·Same as ETB, only no more blocks will follow. ITB (End of > Differences with HDLC length of protocol field (1B or 2B)
byte-oriented protocols) or the start-of-frame flag (for bit-oriented protocols) appears in the actual data. Intermediate Transmission Block) ·Same as ETB, except that the receiving statio Differs from HDLC because of multiaccess MAC that provides · Maximum payload length (default: 1500)
This was not likely to happen in ASCII text, but is very likely with binary data. This is known as a data will not acknowledge after the error checking. EOT (End of Transmission) framing/error detection: · Type of CRC (2B or 4B)
transparency problem an can be rectified with byte stuffing (for byte-orien
![Book Analog Interfacing to Embedded Microprocessors]()
568
pdf
Book Analog Interfacing to Embedded Microprocessors
�Analog Interfacing to Embedded
Microprocessors
Real World Design
��Analog Interfacing to Embedded
Microprocessors
Real World Design
Stuart Ball
Boston Oxford Auckland Johannesburg Melbourne New Delhi
�Newnes is an imprint of Butterworth–Heinemann.
Copyright © 2001 by Butterworth–Heinemann
A member of the Reed Elsevier group
All rights reserved.
No part of this publication may be reproduced, stored in a retrieval system, or transmitted in
any form or by any means, electronic, mechanical, photocopying, recording, or otherwise,
without the prior written permission of the publisher.
Recognizing the importance of preserving what has been written, Butterworth–Heinemann
prints its books on acid-free paper whenever possible.
Library of Congress Cataloging-in-Publication Data
Ball, Stuart R., 1956–
Analog interfacing to embedded microprocessors : real world design / Stuart Ball.
p. cm.
ISBN 0-7506-7339-7 (pbk. : alk. paper)
1. Embedded computer
![Majandusalased uurimismeetodid]()
70
pdf
Majandusalased uurimismeetodid
9/6/2011
Eesmärk
· Kursuse läbinud üliõpilane: omab teadmisi teadusfilosoofia
sissejuhatusest, äriuuringute spetsiifikast, uuringu
ülesehitusest ja uurimisprotsessi etappidest; teadmisi
kvantitatiivsete ja kvalitatiivsete andmete kogumise ja
Majandusalased uurimismeetodid
![Kuidas muudab mudelprojekteerimine teraskonstruktsioonide valmistamist ja ehitamist]()
228
pdf
Kuidas muudab mudelprojekteerimine teraskonstruktsioonide valmistamist ja ehitamist
EHITUSTEADUSKOND
Ehitustootluse instituut
KUIDAS MUUDAB MUDELPROJEKTEERIMINE
TERASKONSTRUKTSIOONIDE PROJEKTEERIMIST,
VALMISTAMIST JA EHITAMIST?
HOW ARE 3D AND BIM CHANGING THE DESIGN, FABRICATION AND
CONSTRUCTION OF COMPLEX STEEL STRUCTURES?
EPJ 60 LT
Üliõpilane: Tanel Friedenthal
Juhendaja: Prof. Roode Liias
Kaasjuhendaja: Prof. Carrie S. Dossick
Tallinn, 2010.a.
�Olen koostanud lõputöö iseseisvalt.
Kõik töö koostamisel kasutatud teiste autorite tööd, olulised seisukohad,
kirjandusallikatest ja mujalt pärinevad andmed on viidatud.
……………………………………………..
(töö autori allkiri ja kuupäev)
Üliõpilase kood: 041399
Töö vastab magistritööle esitatud nõuetele
…………………………………………?
Meedia
Kommentaarid (0)


Kõik kommentaarid