FIGURE 1. Example of pilled fabric Two common pieces of equipment for pilling measurement, mainly used in Europe, are the Martindale pilling tester and the Pilling Box. The Martindale tester consists of a number of testing plates (See Figure 2) on which the abrading fabrics is attached; these four testing plates are mounted on the base plate of the instrument. Generally speaking, fabrics to be tested using Martindale are cut in an approximate circular shape with diameter equal to 90± 1 mm. A worsted wool cloth is used for abrading the samples and a trajectory based on the Lissajous figure is used to perform each cycle (more precisely, a cycle consists of 16 movements in the Lissajous figure). A 12 kPa head pressure is applied by the machine. 5 FIGURE 2. Martindale pilling tester.
to, and the corresponding relative example, in the testing machine) ini- show that as long as the material is elongation or strain for several materi- tially elongates in proportion with the stressed to less than its "yield point", als used in aircraft construction. stress. Here the aluminum obeys this it has the ability to return to almost (Stress is the stretching load per unit "law of proportionality" quite well. its original shape, as soon as the cross section in pounds/square inch However, at a certain point - let us load disappears. (To be precise, this or, in short, psi ... with 1,000 psi = 1 call it a "yield point" - on the elasticity of the material does not ksi; strain is the change in length of a stress/strain line, the original nice lin- have its upper limit at exactly the part of a specimen of constant cross earity ends
Thesis “How is it possible to calculate IT security effectiveness?” Kristjan Kivimaa August 2022 1 Abstract In IT Security world, there is lack of available, reliable systems for measuring security levels/posture. They lack the range of quantitative measurements and easy and fast deployment, and potentially affects companies of all sizes. Readily available security standards provide qualitative security levels, but not quantitative results – that would be easily comparable. This deficiency makes it hard for companies to evaluate their security posture accurately. Absence of security metrics makes it complicated for customers to select the appropriate measures for particular security level needed. The research question for this research project is – “How is it possible to calculate IT security effectiveness?”. The aim of this research is to use this reference m
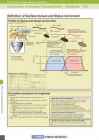
Surface TextureContour Measuring Instruments Explanation of Surface CharacteristicsStandards Definition of Surface texture and Stylus instrument Profile by Stylus and phase correct filter ISO4287: '97 and ISO3274: '96 Total profile Primary profile P Measure perpendicular to lay X axis Z axis Stylus method Form deviation profile
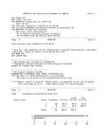
SPSS/PC+ The Statistical Package for IBM PC 6/12/ 2 set /beep off. GET /FILE 'tud.sys'. The SPSS/PC+ system file is read from file tud.sys The file was created on 2/21/10 at 11:40:26 and is titled SPSS/PC+ System File Written by Data Entry II The SPSS/PC+ system file contains 247 cases, each consisting of 44 variables (including system variables). 44 variables will be used in this session. ------------------------------------------------------------------------------- Page 2 SPSS/PC+ 6/12/ 2 This procedure was completed at 10:26:32 * more on - iga lehekylje ja"rel tehakse paus, suvaline klahvivajutus viib edasi * more off - pausi ei tehta, ko~ik ka"sud ja"rjest. SET MORE OFF. SET LENGTH 500. *---------------------------------- * iga tudengi oma va"ljavo~tu tingimused. * Tingimuses olevaid tunnuseid ei tohi analyysis kasutada. SELECT IF (T614=1 AND T713=1). *-----------
Analog Interfacing to Embedded Microprocessors Real World Design Analog Interfacing to Embedded Microprocessors Real World Design Stuart Ball Boston Oxford Auckland Johannesburg Melbourne New Delhi Newnes is an imprint of Butterworth–Heinemann. Copyright © 2001 by Butterworth–Heinemann A member of the Reed Elsevier group All rights reserved. No part of this publication may be reproduced, stored in a retrieval system, or transmitted in any form or by any means, electronic, mechanical, photocopying, recording, or otherwise, without the prior written permission of the publisher. Recognizing the importance of preserving what has been written, Butterworth–Heinemann prints its books on acid-free paper whenever possible. Library of Congress Cataloging-in-Publication Data Ball, Stuart R., 1956– Analog interfacing to embedded microprocessors : real world design / Stuart Ball. p. cm. ISBN 0-7506-7339-7 (pbk. : alk. paper) 1. Embedded computer
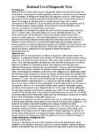
Rational Use of Diagnostic Tests Screening tests Diagnostic tests are often used to screen asymptomatic patients and identify risk factors for occult disease. Screening tests should be generally noninvasive, inexpensive, and of minimal risk to the patient. Screening tests should have high diagnostic sensitivity, which means few false negative results would be expected, as the goal of testing is to rule out the presence of disease. Screening tests should be used to screen for diseases that (1) have serious consequences if left undetected, (2) are reasonably prevalent within the population, and (3) have treatment options readily available. Should a positive result be obtained, a more accurate, confirmatory test should then be performed. One example of a screening test would be the urine cortisol-to-creatinine ratio (Cort:Crt)u, which is used to screen symptomatic patients for canine hyperadrenocorticism.[1,2] The (Cort:Crt)u ratio tests for the presence or absence of u
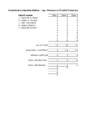
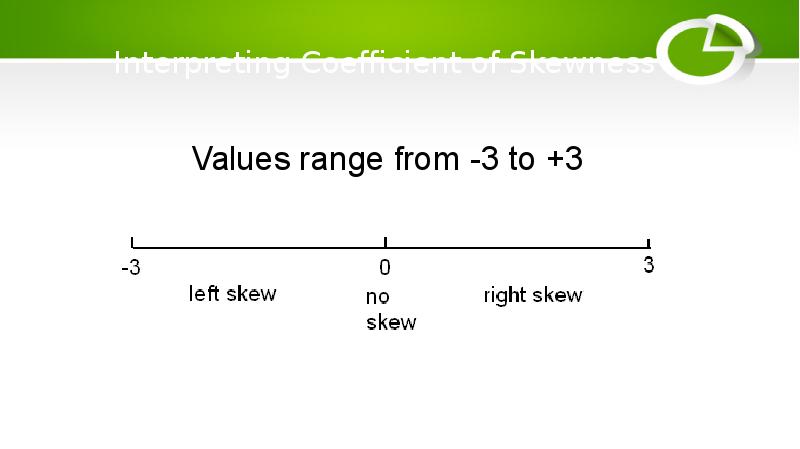
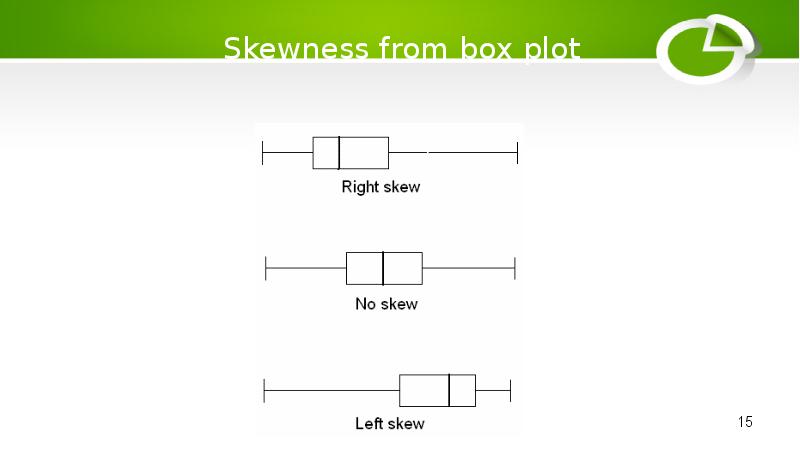
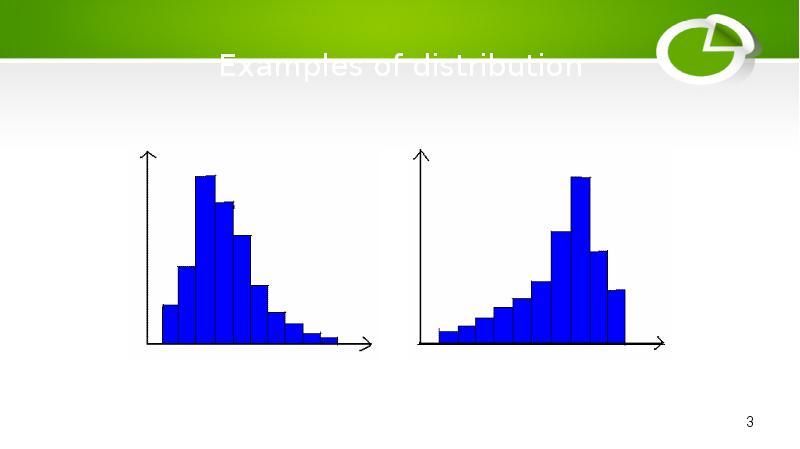
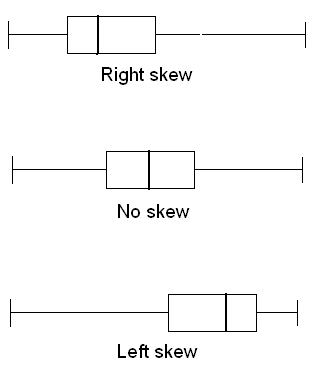
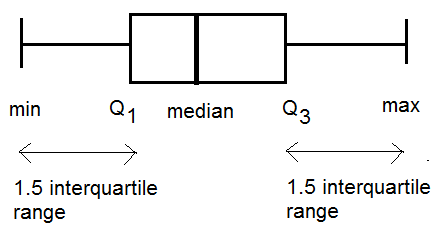
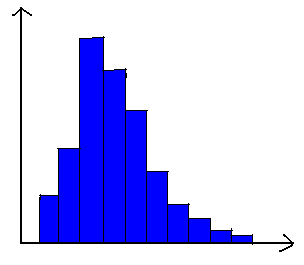
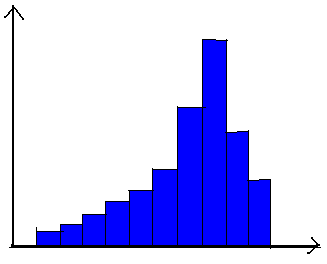
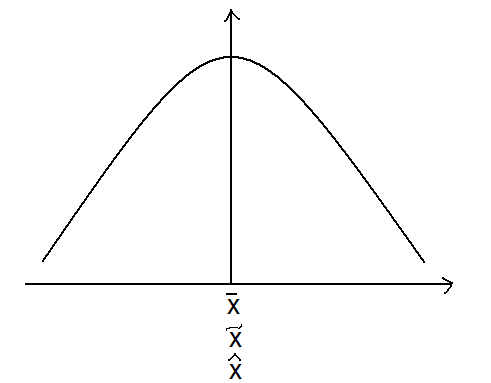
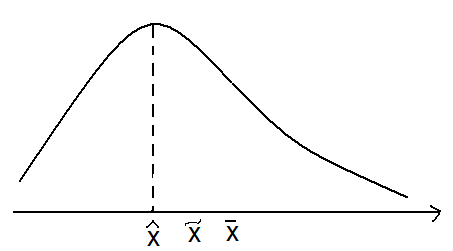
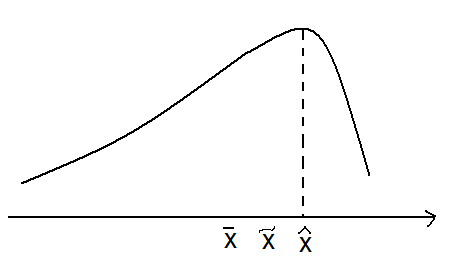
4 Eritrea Sub-Saharan Africa 39.7 Burundi Sub-Saharan Africa 39.4 Zimbabwe Sub-Saharan Africa 33.1 Sudan Sub-Saharan Africa 32.0 Cuba Americas 29.5 Venezuela Americas 24.8 Korea, North Asia-Pacific 3.0 ures of Central Tendency: median, quartiles, deciles, percentiles ures of Form of Distribution: Skewness ja Kurtosis cum - kumulatiivne osakaal =PERCENTRANK.INC Moodusta variatsioonirida: Data -> Filter cum Põhilised arvkarakteristikud 100.00% 99.43% Riikide arv =COUNT 177 98.86% 97.72% Maksimaalne väärtus =Max 84.4 97.72%


Kõik kommentaarid