1
Thesis
“How is it possible to calculate IT security effectiveness?”
Kristjan Kivimaa
August 2022 2
Abstract
In IT Security world, there is lack of available, reliable systems for measuring security
levels/posture. They lack the range of quantitative measurements and easy and fast deployment,
and potentially affects companies of all sizes.
Readily available security standards provide qualitative security levels, but not quantitative results
– that would be easily comparable. This deficiency makes it hard for companies to evaluate their
security posture accurately. Absence of security metrics makes it complicated for customers to
select the appropriate measures for particular security level needed.
The research question for this research project is – “How is it possible to calculate IT security
effectiveness?”.
The aim of this research is to use this reference model to calculate and to optimize major
university’s and a small CSP-s (Cloud Service Provider) security posture and their spending’s on
security measures. Aim is to develop a reference model to support IT Security team and business
side to make reasoned and optimal decisions about IT security and all that with a reasonable
number of manhours.
In this Graded Security Expert System (GSES) aka Graded Security Reference Model (GSRM) the
quantitative metrics of the graded security approach are used to express the relations between
security goals, security confidence and security costs.
What makes this model unique, is the option to use previous customers security templates/models
– cutting the implementation time from 500+ manhours to as low as 50 manhours. The first
customers 500+ manhours will also be cut down to 50+ manhours on the second year
implementing the expert system.
The G
raded Security Reference Model (GSRM) was developed using a combination of
theoretical method and design science research. The model is based on InfoSec (info security)
activities and InfoSec spendings from previous year – cost and effectiveness – gathered from
expert opinions
By implementing GSRM, user can gather quantitative security levels as no other model, or a
standard provides those.
GSRM delivers very detailed and accurate (according to university’s IT Security Team)
effectiveness levels per spendings brackets.
GSRM was created as a graded security reference model on CoCoViLa platform, which is unique as
it provides quantitative results corresponding to company’s security posture.
Freely available models and standards either provide vague quantitative security posture
information or are extremely complicated to use – BIS/ISKE (not supported any more).
This Graded Security Reference Model has turned theories presented in literature review into a
functional, graphical model.
The GSRM was used with detailed data from the 15+k users university and their IT security team
(all members have 10+ years of IT security experience) concluded that the model is reasonably
simple to implement/modify, and results are precise and easily understandable. It was also
observed that the business side had no problems understanding the results and very few
explanatory remarks were needed.
3
Contents
Abstract .............................................................................................................................................. 2
Acknowledgments .............................................................................................................................. 5
List of Figures ...................................................................................................................................... 6
1. CHAPTER - INTRODUCTION ............................................................................................... 9
1.1 Introduction .............................................................................................................................. 9
1.11 Research Question ............................................................................................................ 11
1.12 Research Problem Definition ............................................................................................ 11
1.13 Research Objective ........................................................................................................... 12
1.14 Design Objective ............................................................................................................... 13
1.15 Assumptions ..................................................................................................................... 14
1.16 Benefits of the Research ................................................................................................... 15
1.17 Limitations ........................................................................................................................ 15
1.18 Implementation ................................................................................................................ 16
2.
CHAPTER – METHODOLOGY ......................................................................................................... 21
2.1 Methodology .......................................................................................................................... 21
2.2 Research Plan.......................................................................................................................... 25
2.3 Data Gathering ........................................................................................................................ 26
3. CHAPTER – LITERATURE REVIEW .................................................................................................. 28
3.1 Literature Review .................................................................................................................... 29
3.2 Security Standards and Frameworks ...................................................................................... 44
3.3 Existing models ....................................................................................................................... 56
3.4 Insurance ................................................................................................................................ 63
3.5 Graded Security Reference Model ......................................................................................... 65
4. CHAPTER – UNIVERSITY ANALYSIS AND EVALUATION ................................................................. 71
4.1 University on-prem standing .................................................................................................. 71
4.2 Implementation ...................................................................................................................... 79
4.3 Evaluation ............................................................................................................................... 81
5. CHAPTER – CSP ANALYSIS JA EVALUATION .................................................................................. 85
5.1 CSP Security measures ............................................................................................................ 85
4
5.2 Implementation ...................................................................................................................... 89
5.3 Evaluation ............................................................................................................................... 96
6. CHAPTER – SUMMARY OF FINDINGS .......................................................................................... 100
7. CHAPTER – FUTURE .................................................................................................................... 104
7.1 Research Limitations ............................................................................................................. 104
7.2 Future Directions of Research .............................................................................................. 105
REFERENCES .................................................................................................................................... 106
Bibliography .................................................................................................................................... 111
APPENDIXES ................................................................................................................................. 113
Scheme Loading Manual ....................................................................................................... 113
Expert-level User Manual for GSES/GSRM ................................................................................. 120
Introduction ............................................................................................................................ 120
Installation Manual ................................................................................................................. 122
Installation Guide for CoCoViLa .............................................................................................. 122
Installation of the GSES .......................................................................................................... 122
Start GSES ............................................................................................................................... 122
Results for managers .............................................................................................................. 124
Program Structure .................................................................................................................. 128
Input of collected expert information to GSRM/GSES ........................................................... 129
Security Class .......................................................................................................................... 129
MeasureGroups ...................................................................................................................... 131
Nodes ...................................................................................................................................... 132
Edges ....................................................................................................................................... 133
Super Class .............................................................................................................................. 135
Optimizer ................................................................................................................................ 136
Graph2D .................................................................................................................................. 137
Graph3D .................................................................................................................................. 138
Losses Matrix Expert Table ..................................................................................................... 139
Dependency Matrix Expert Table ........................................................................................... 139
Practical Work - main problems and ideas ............................................................................. 140
5
Acknowledgments
This dissertation was completed in Lulea University of Technology. Firstly, I would like to express
my gratitude to my supervisor, Dr. Tero Päivärinta, for his outstanding support and advice during
the writing period.
I would also like to thank Dr. Jüri Kivimaa from CCDCOE (NATO Cooperative Cyber Defense Centre
of Excellence) for sharing his knowledge and assistance in constructing the working model. His
motivation has helped me to successfully complete my research. Special thanks also belong to Enn
Tyugu, Andres Ojamaa, Ando Saabas and Pavel Grigorenko from the Institute of Cybernetics at
Tallinn University of Technology, who have created and developed the visual programming
platform “CoCoViLa”. I also want to give my biggest admiration to Toomas Kirt, who developed the
the evolutionary algorithms for optimization. Using brute force optimization Intel i7 computer,
would take about billion years to calculate 32 security activities areas on 4 levels (432 variations),
but thanks to evolutionary algorithm, it takes around 1-2 minutes.
6
List of Figures
Figure 1. 1– Reference Model Programming Layout example (present research) .......................... 18
Figure 1. 2– Reference models generated graphs (present research)Figure 1. 35 –
Efficiency/Security Level Optimums (present research) .................................................................. 19
Figure 1. 4– Three-year 3D graph (present research) ....................................................................... 21
Figure 1. 5– Effect of adoption of Cyber Insurance on the level of IT security investment (Filks,
2016). ................................................................................................................................................. 64
Figure 2. 1 - Modes of DSR inquiry (Sonnenberg, 2012) ................................................................... 22
Figure 2. 2 - Build-Evaluate in DSR methodology (Sonnenberg, 2012) ............................................. 23
Figure 2. 3 - Evaluation activities within a DSR process (Sonnenberg, 2012) ................................... 24
Figure 3. 1
- CSP recommendations for SaaS platform (Hanges, 2015). ........................................... 35
Figure 3. 2 – Risk considerations (present research). ........................................................................ 39
Figure 3. 3 – Reference Model of Information Assurance and Security – RMIAS - (Cherdantseva and
Hilton, 2013) ...................................................................................................................................... 39
Figure 3. 4
– Risk assessment – Critical systems ((Cherdantseva and Hilton, 2013). ....................... 41
Figure 3. 5 – Probability ranking and materialization criteria ((Kivimaa, 2013) ................................ 42
Figure 3. 6 - Criteria for the consequences of the realization of the threat (RIA, 2021) ................... 43
Figure 3. 7 - Descriptions of risk classes (RIA, 2021) ......................................................................... 43
Figure 3. 8 – Risk assessment – Risk table ISKE/BIS (RIA, 2021) ........................................................ 44
Figure 3. 9 – Risk mitigation plan (RIA, 2021) .................................................................................... 44
Figure 3. 10 – Estonian Information Security Standard (RIA, 2021) .................................................. 44
Figure 3. 11– ISO 27001 implementation steps (27001 Academy, 2021) ......................................... 45
Figure 3. 12– Entire NIST Risk-management framework (Ross, 2008). ............................................. 47
Figure 3. 13– NIST Framework 5 areas (NIST, 2015) ......................................................................... 47
Figure 3. 14– NIST Cyber Security Framework overview (NIST, 2015). ............................................. 48
Figure 3. 15– NIST Cyber Security Framework detailed fill-in sheet (NIST, 2015). ............................ 49
Figure 3. 16– ISKE reference security combinations (Kivimaa, 2013). .............................................. 51
Figure 3. 17– Modified business process model (Kivimaa, 2017). .................................................... 55
Figure 3. 18– Example of relevant coefficient (Kivimaa, 2017) ......................................................... 55
Figure 3. 19 – GSTool IT assets (BIS, 2004) ........................................................................................ 56
Figure 3. 20 – GSTool IT resources list (BIS, 2004)............................................................................. 57
Figure 3. 21 – GSTool Excel example (BIS, 2004) ............................................................................... 57
Figure 3. 22 -GSTool Object Model (BIS, 2004) ................................................................................. 58
Figure 3. 23– GSTool Safeguards (BIS, 2004) ..................................................................................... 59
Figure 3. 24 - GSTool Tab cards/Modules (BIS, 2004) ....................................................................... 59
Figure 3. 25 - CyberProtect Infrastructure layout (CyberProtect, 2011) ........................................... 60
Figure 3. 26 - CyberProtect Tools Catalogue (CyberProtect, 2011) ................................................... 61
Figure 3. 27– CyberCIEGE layout (CyberCIEGE, 2013) ....................................................................... 62
Figure 3. 28 – CyberCIEGE Scenario Definition Tool (CyberCIEGE, 2013) ......................................... 62
Figure 3. 29 – Trusted Information Sharing Network (TISN, 2020) ................................................... 65
Figure 3. 30 – TISN model modified from IT (TISN, 2020). ................................................................ 66
Figure 3. 31 – Typical dependency of losses and security expenses of security level (Kivimaa, 2017).
........................................................................................................................................................... 66
7
Figure 3. 32 – Serial and parallel IT activities. (Kivimaa, 2017). ........................................................ 67
Figure 3. 33 – CyberProtect CyberProtect, 2011) .............................................................................. 67
Figure 3. 34– Security level priorities ................................................................................................ 68
Figure 3. 35 – Graded Security Model University security model in CoCoViLa ................................. 70
Figure 3. 36 – Graded Security models graphical outcome example (Kivimaa, 2017 ...................... 70
Figure 4. 1 - Information Technology structure in a university (university data protection
document). ....................................................................................................................................... 71
Figure 4. 2 - Current IT and IT Sec Activities. Levels achieved and to be achieved: color-coded
(current research Closer view). ........................................................................................................ 75
Figure 4. 3.– Example of Current IT and IT Sec Activities. Levels achieved and to be achieved: color-
coded ................................................................................................................................................ 76
Figure 4. 4– Redundancy Coefficient expert opinions example ....................................................... 76
Figure 4. 5 - Security levels and required levels (Kivimaa, 2017) ..................................................... 79
Figure 4. 6 - Security levels and required levels modification (Kivimaa, 2017) ................................ 79
Figure 4. 7 – Full university reference model overview (current research closer view) .................. 80
Figure 4. 8 - Minimal and Maximal Budget + maximum Annual Losses ........................................... 81
Figure 4. 11 - Magnified Exp Total Costs = IT Costs + Exp IT Losses ..................................... 82
Figure 4. 12 – Magnified Total Cost, Efficiency and Budget ............................................................. 83
Figure 4. 13 – Effectiveness and Mitigation Rate ............................................................................. 83
Figure 5. 1 – Programs used from VMware Cloud Provider Program (Amazon, 2020) ..................... 90
Figure 5. 2 - Full CSP reference model overview ............................................................................... 91
Figure 5. 3 – Security levels and next potential steps to increase security ....................................... 92
Figure 5. 4 - Redundancy Coefficient figures for CSP ........................................................................ 93
Figure 5. 11 – Close-up of Expected Total Cost = IT Cost + Expected IT Losses ................................. 99
Figure 5. 12 – Maximum Annual Loss Expectancy ............................................................................. 99
Figure 7. 1 - CoCoViLa download. .................................................................................................... 113
Figure 7. 2 - Loading the package. ................................................................................................... 114
Figure 7. 3 - Loading the Scheme. ................................................................................................... 114
Figure 7. 4 - File selection. ............................................................................................................... 115
Figure 7. 5 - Running the Schema. .................................................................................................. 115
Figure 7. 6 – Outcome graphs and java ........................................................................................... 116
Figure 7. 7 – Security Measures Properties list ............................................................................... 116
Figure 7. 8 – Properties values (Investment, Maintenance, Effectiveness, Initial and Required Levels
etc.) .................................................................................................................................................. 117
Figure 7. 9 – Algorithm properties .................................................................................................. 117
Figure 7. 10 – Algorithm values (Min and Max Budget, Annual Loss etc.) ..................................... 118
Figure 7. 11 - Supporting-Parallel activities properties ................................................................... 118
Figure 7. 12 - Supporting-Parallel activities values .......................................................................... 119
Figure 7. 13 – Schema overview ...................................................................................................... 123
Figure 7. 14 – Total Cost Curve ........................................................................................................ 124
Figure 7. 15 – Total Cost curve ........................................................................................................ 125
Figure 7. 16 – Effectiveness and mitigation rate curve year 1 ........................................................ 125
8
Figure 7. 17 - Effectiveness and mitigation rate curve year 2 ......................................................... 125
Figure 7. 18 - Effectiveness and mitigation rate curve year 3 ......................................................... 126
Figure 7. 19 – Java Console .............................................................................................................. 127
Figure 7. 20 - #D Graph .................................................................................................................... 127
Figure 7. 21 - GSES toolbar .............................................................................................................. 129
Figure 7. 22 - Security Class scheme symbol ................................................................................... 129
Figure 7. 23 - Security Class properties window .............................................................................. 129
Figure 7. 24 - Security Class properties ........................................................................................... 130
Figure 7. 25 - Measure group scheme symbol ................................................................................ 131
Figure 7. 26 - Measure group properties window ........................................................................... 131
Figure 7. 27 - Measure group properties ......................................................................................... 131
Figure 7. 28 - Node scheme symbol ................................................................................................ 132
Figure 7. 29 - Node properties window ........................................................................................... 132
Figure 7. 30 - Node properties ......................................................................................................... 132
Figure 7. 31 - Labeled node scheme symbol ................................................................................... 132
Figure 7. 32 - Labeled node properties window .............................................................................. 133
Figure 7. 33 - : Relevant Edge scheme symbol ................................................................................ 133
Figure 7. 34 - Relevant Edge properties window ............................................................................. 133
Figure 7. 35 - Edge properties ......................................................................................................... 134
Figure 7. 36 - Supporting edge scheme symbol .............................................................................. 134
Figure 7. 37 - Supporting Edge properties window ......................................................................... 134
Figure 7. 38 - Super class scheme symbol ....................................................................................... 135
Figure 7. 39 - Super Class properties window ................................................................................. 135
Figure 7. 40 - Super class properties ............................................................................................... 135
Figure 7. 41 - Optimizer scheme symbol ......................................................................................... 136
Figure 7. 42 - Optimizer properties window.................................................................................... 136
Figure 7. 43 - Optimizer properties ................................................................................................. 136
Figure 7. 44 - 2D graph scheme symbol .......................................................................................... 137
Figure 7. 45 - 2D graph properties window ..................................................................................... 137
Figure 7. 46 - Graph2D properties ................................................................................................... 137
Figure 7. 47 - 3D graph scheme symbol .......................................................................................... 138
Figure 7. 48 - 3D graph properties window ..................................................................................... 138
Figure 7. 49 - CoCoViLa losses matrix .............................................................................................. 139
Figure 7. 50 - CoCoViLa dependency matrix .................................................................................... 139
Figure 7. 51 – Dependency graph for big corporations ................................................................... 140
Figure 7. 52 – Dependency graph for small and medium companies ............................................. 140
9
1.
CHAPTER - INTRODUCTION
1.1 Introduction
Motivation for this research was that there is no freely available models that calculates risk levels
based on financial spending’s on security and gives exact quantitative figures as an outcome. There
is no model that can even give you a rated risk levels, efficiency and mitigation rates. Im not
claiming that those models don’t exist, but they are not freeware and most “tools” available are
just standards. Most “tools/standards” used in literature reviews used sample data like surveys
and interviews, not full IT and financial profiles as it would be too time consuming. Most seem to
follow 3 general advice for security - use of a firewall, antiviruses and regular training of staff
(Shaik & Modak, 2017). There are plenty of theory’s also on how to measure CSP security posture
and majority tends to suggest using a 3rd party to accomplish the task (Whaiduzzaman & Gani,
2014). That again has no benefits as insurance company experts have access to CSP presentation
environment but not to actual production environment.
Only actual tool I found was GSTool, but it is extremely complicated and time consuming the use.
For example, its manual is 400 pages long, and in a medium company of 1000-2000 employees, the
implementation is expected to be over 10,000 hours (BIS, 2004). It is not free, even now the
license costs 685 euros and the support for the tool was ended in 2016 due to not being profitable.
For example, CSP is responsible for protecting the global infrastructure that runs all of the services
offered. This infrastructure includes the hardware, software, networking, and facilities that run
Cloud services. Protecting this infrastructure is the number one priority of CSP. You can maybe see
the physical security measures, but we can only assume what is exactly done for security posture
inside, on hardware and software levels.
In SaaS model, the CSP handles basic security tasks like guest OS and database patching, firewall
configuration and disaster recovery. Customer is responsible for configuring logical access controls
and protecting user credentials.
For IaaS customer must do all the above security configuration themselves (Amazon, 2020).
One motivation for this thesis was that we have very limited information how CSP-s protect their
infrastructure. We have been given only very limited information and it has been stated that their
security measures are equal to a bank’s security measures (Kivimaa,2017).
Like we all have seen; basically, all new startups and new business adventures in existing
companies tend to make use of Cloud Service Providers (CSP) services to test their business models
viability. Main problem remains the same – is our data safe?
The CSP-s must be more transparent and specific in clarifying the issues regarding the security and
to responsibilities with their clients. As there are no regulatory bodies yet defined, then I
concluded that insurance companies would be the best 3rd party to monitor security related issues
as with new European General Data Protection regulation (GDPR) that come into effect on 25 May
2018, should require all companies and CSP-s to have cyber insurance to be able to afford the
penalties if a breach occurs (Official Journal of the European Union, 2016).
Similar issue plagues insurance companies that provide cyber security insurance to companies. As
far as we can assume, they are basing their premium and amounts that will be paid out, mostly on
guesswork. They can get from a company their potential losses in case of a data breach and an
auditor’s assessment on security standing. That will always be an expert opinion and not
something quantitative - easily measurable and comparable.
For a company basically only way to protect themselves against huge GDPR enforced fines is to
acquire cybersecurity insurance. And without knowing the security level of a CSP and especially
how CSP will determine if they were to blame for the breach or
the customer…
10
We must keep in mind when I speak of effectiveness in this thesis, I always mean CIA
(Confidentiality, Integrity, Availability) effectiveness.
I used a graded graphical decision support model (Java based desktop application created in
CoCoViLa) for my model, which provides accurate solution to the problem of calculating efficiency
and mitigation rates (security levels) based on business security levels/potential monetary losses
(Kotkas, 2011).
The main benefit of this kind of an approach is that the results are quantitative, not qualitative as
most similar solutions and standards. The graded security reference model is created based on
expert opinions (E=efficiency) and cost. The reference model gives quantitative figures for
comparison and is easily optimized for better security posture.
The reference model is created on following basic ideas:
•
Olovsson (1992) basic concept of structured computer security - min Expected IT Security Total
Cost = IT Security Costs + Expected IT Sec Losses
•
Uses of actual effectiveness ratios for certain information security activities areas.
•
IT as Business Process & System Reliability (Availability) Theory - IT as Business Process &
System Reliability (Availability) Theory - Based on the simplest version of business process
model “People-Process-Technology//Governance” has been modified to suit IT sector as
People-Software (SW)-Hardware (HW)//Governance (G)”. IT Security activities are supporting-
parallel to IT activities (P, SW, HW, G) –multilevel security.
Most important findings will include mitigation rate, efficiency, expected annual losses and total
cost.
•
Mitigation rate equation – AL(Annual Loss) = ALE (Annual Loss Expectancy) (1 - E) and mR
(mitigation rate) = ALE/AL = 1/(1- E)
•
Calculate mitigation rate mR=f(budget) based on E (efficiency) : mR=1/(1-E)
•
Calculate Expected Annual Loss=f(Budget): AL=maxALE/mR
•
Total Cost (TC)=IT Costs+IT Losses=f(Budget) optimal TC is minimal,
Olavsson model was chosen because it was to my knowledge only model that also considered
potential losses from IT incidents.
You are responsible for calculating the CIA effectiveness of security for a specific companies
Information System (including the CSP’s Information Technology System). The general fuss about
standards and theoretical model doesn't help here. It is necessary to take the IS model as a basis
and include the prices / security efficiencies of things done by a specific company and then
calculate the situation of IT as one business process. The simplest People-Process-Technology //
Governance model of the business process based on the model, which would be People-Software-
Hardware // Governance for IT. In addition to this basic model, information security activities will
be added to make the ITS system more secure, and that is for the Graded Security Reference
Model Authority. There are IT / IT Security fields of activity in series and in parallel, there is a
theory to calculate such a model -
Quantitative System Reliability / Availability theory - System
Reliability and Availability (eventhelix.com).
Combined with same calculations from cloud service providers and any organization, it gives a
good overview of overall security levels, which could be used by insurance companies providing
cyber insurance and calculating premiums.
This model will considerably simplify expert information collection, comparison as well as its
accuracy.
11
It has been proven with this model, with relatively minimal work, it is possible to collect the
required information. With most frameworks, creating a functional model takes thousands, if not
tens of thousands of man hours – with my model it takes hundreds of man hours.
To describe IT and IT Security as a process, there are two especially important basic ideas:
• If all relevant security activities are at a good level, the entire system will be in good standing.
• Parallel supporting activities to relevant (serial) activities. Same availability theory applies.
1.11 Research Question
The research question for this research project is – “One potential way of calculating security
measures effectiveness”.
My intention is that having comparable efficiency and mitigation rates from a company itself and
CSP-s, makes it easier for customers to compare different CSP-s security levels to fit their needs.
Meaning that customers would have the CSP efficiency level and price, so they could make
calculated judgments. If company needs 99% security efficiency, they don’t have to pay a higher
price for 99.5% security efficiency. Knowing CSP efficiency levels would also help them to integrate
CSP into Graded Security Reference Model (GSRM).
The reference model can also be applied in every company to check their security posture and
optimize their spending’s on security measures. The reference model results can be used by
insurance companies to provide more accurate cyber security premiums as they will receive the
calculation results from both CSP and a company, calculated using the same reference model.
The reference model has been tested and deemed to be adequately accurate. As the input is based
on expert opinion, we can assume ±20% accuracy. The 20% has been assumed by security experts
and auditors as most inaccurate. In my research, the university security experts were highly skilled
and experienced, so we agreed that in the university model the expert opinion accuracy was +-5%.
That is the accuracy of the expenses on security measures – loss expectancy accuracy is expected
to be much less accurate. The financial side can normally predict the bracket of loss, not the exact
figure – for example is the loss expectancy 1 million, 10 million or 100 million.
1.12 Research Problem Definition
As mentioned before – more and more companies are moving their data centers to the cloud. BUT
the main concerns are still there. There is detailed information what security measures Cloud
Service Providers are implementing. There is no information how the data is stored or even
transferred. The metrics that customer receives are regarding uptime and confirmation that their
data is backed-up in 3 different locations (Amazon, 2020).
Nowadays it is basically impossible to manage any business without the help of IT. Companies have
realized that they have to concentrate on risk, not only on new business opportunities (Carr,2003).
No company can be competitive in any field without making use of IT systems. IT security has
always been regarded as expensive (and unnecessary) and many companies have neglected that
aspect altogether. Due to GDPR, security has become more prevalent issue than ever. Normal
audits select quite random areas of security and inspect if the security measures in place are
adequate. Audit gives recommendations how to remedy the shortcomings, but don’t look at the
security as a whole.
12
According to survey done among 2000 cybersecurity specialists, main security concerns are
(Schulze, 2017) - Data loss (57%), threats to data privacy (49%), breaches of confidentiality
(47%),traditional security tools and knowledge are not designed for cloud (78%), compliance
(36%). According to SANS Institute (2016) very minimal security measures should be: Anti-
malware, data loss prevention (DLP), encryption, federated identity and access management,
firewalls, IDS/IPS, multifactor authentication, network access controls and VPN.
We can easily say that most companies (especially smaller) dont even fill the minimal security
requirements.
One potential solution would be using the reference model to optimize their security spendings
and also getting a quantitative efficency/security level upon which to improve their security
standing in the future. Same reference model should be used by CSP-s to provide their security
standing in concrete figures to customers.
1.13 Research Objective
The research aim is:
•
To develop a reference model using quantitative approach to calculate security
levels/efficiency, mitigation rates and optimal spending’s.
•
To develop a reference model to support system IT Security team and business side to make
reasoned and optimal decisions about investments to IT security with the amount of work
which is also acceptable also to small and medium-sized companies.
•
Model is sufficiently simple - information collection, optimization and analysis tasks require 1-2
months of work instead of the detailed risk analysis, that requires 1-2 years (like implementing
ISKE/GSTool).
•
Gaining metrics that are suitable for making information security decisions.
•
All previous can be done with reasonable workload (1-2 man-months).
To develop the decision-support-system and to be sure that it adequately describes the real
situation the following steps must be taken:
•
Building a descriptive model.
•
Collect data for model.
•
Testing the model.
•
Implementing the model.
13
1.14 Design Objective
My aim was to find design objectives that are functional and non-functional. I stated those as goals
for what reference models design was meant to achieve. Objectives served as a guide for the
design process and how to measure results.
The model differs from standards as it doesn’t provide any recommendations how to achieve
minimal (basic) security levels, like most standards do. The model requires financial input
regarding IT spending`s and expert opinions about their current security posture (security level).
That makes the model perhaps not suitable for small businesses, which don’t have the required
expertise within the company and don’t have the financial possibility to rent external experts.
The design of the model has been improved over the years – the model has been tested in a big
Swedish bank, Estonian government department and a big Estonian university. The feedback from
the companies has been very positive and the design and functionality of the model has been
deemed accurate. The accuracy of the model is highly dependent on the accuracy of the expert
data received from the companies. If the data is correct, then the results received from the model
are accurate. Security specialist will know what needs to be improved (Figure 3. 37– Security level
priorities Figure 3. 38 – Graded Security Model University security model in CoCoViLa) but the
model will help them to see which security measures improvement will increase the overall
security the most and should be prioritized. Quite often security measures that are deemed most
important by the security team are also the most expensive and don’t increase the overall security
efficiency much, so they need to know the optimal solutions within their given budgets.
Beside accuracy attention was paid to usability, compatibility, cost (man-hours to implement) and
reliability of the security reference model.
The main design objective for the graded reference model was to cut down on the
implementation time as much as possible. One of the big downfalls of any security standard is that
it takes months to implement, and they are quite hard for non-IT stakeholders to comprehend.
Estonian government made ISKE standard mandatory in March 2009 and gave government
agencies 1 year – till March 2010 – to implement ISKE security measures. Most government
agencies were able to hold to that deadline, but it required huge human resources and financial
investment. I has been assumed that every agency had between 3 and 6 IT security specialist
working 40 hour weeks (Riigiteataja, 2020).
The design is meant to be easily modified and results are to be represented in a graphical form and
in an easily readable and understandable text output. Easily modifiable means that after making
the model for the first time, it is easy to change different values (like the budget and redundancy
coefficient) within the model. The results are easily understandable to every person who has some
knowledge in IT security, and I believe that the graphs are ever easily understandable to
stakeholders as they tend to have business background and they are all about graphs.
The model can calculate multiple different values – total cost, annual loss expectancy, maximum
annual loss expectancy, loss and budget, effectiveness, mitigation rate etc. I have mainly
concentrated in the model on effectiveness and budget.
The model has been designed to have simple and fast way to modify all the inputs – security levels
effectiveness, budget, security measures, redundancy, investment, maintenance cost etc. Inserted
data will be modified and new model will be compiled with the new data with one click of a
button.
Graded reference models main aim is to get concrete figures on company’s security effectiveness.
An appropriate estimate of a company’s appropriate IT Security effectiveness could be based on
five levels (5th is rarely applicable) -
14
1. One nine - ~ 0.9 (0.85-0.95 or 85-95%) - this is generally suitable for small company.
2. Two nines - 0.95-0.99 (95-99%) - are generally required for medium-sized company.
3. Three nines - 0.99-0.999 (99-99.9%) - are generally required for large company, but also for
medium-sized ones where IT is mission-critical (such as a smaller bank).
4. Four nines - ~ 0.9999 (99.99%) - something like this is needed for large and IT mission-critical
company.
5. Five nines (~ 0.99999 (99.999%)) could be added, but it is suitable for very few - very large and
very IT mission-critical - US / NATO military systems, nuclear power plants, etc.
The graded security reference model is still in development but based on feedback from the
Swedish banks Estonian branch, Estonian government agency, Estonian university and CSP from
Bahamas – the model is sufficiently accurate, gives easily understandable quantitative results and
shows great promise. The model’s accuracy was based on expert opinions of IT Security experts -
I can be quite certain that the approach I took to the design and implementation was the correct
one and hopefully when the model progresses from a scientific project to a commercial one – it
can be improved even further. Security experts have divided 32 security measures into 4 different
categories – three as the first level is always no security actions taken. They have detailed in every
security measure what action should be taken, no they are in a good standing to compare what
security measures are more essential and compare that data to the model’s suggestions. As
budget increases or one time security measures are implemented, they have a good understanding
what should be done next and model gives accurate information how next year budget should be
divided between security measures, optimal budget spread and which security measures are more
crucial.
1.15 Assumptions
The work includes types of assumptions:
• Rational assumptions – the main goal is to ensure a lower workload when implementing the
model.
• Rational assumptions –the goal is to ensure accuracy of expert opinions and financial information
to make the model accurate. To give detailed information for the year 2 – what security measures
are optimal to increase/implement.
• Forced assumptions –caused by the lack of quality information. The underlying problems in cases
remain unsolved. Model is only as accurate as the data inserted.
Rational assumptions:
1. Based on the IT view on information security – mainly CIA (confidentiality, integrity, availability
or
Security Effectiveness) and security measures required.
2. Use of the simplest and widely used People-Process-Technology business process model
(Olavsson, 1993).
3. Exclude decisions, which are clearly bad. Creation of a model that does security
level/effectiveness calculations and optimization without searching for and excluding technical and
human errors.
15
Forced assumptions:
1. Mostly impossible to find or specify numeric values for the cyber-attack probabilities. I need to
assume that unprotected information will be attacked.
2. In the public sector there is no real information about probable losses from security incidents
financially.
1.16 Benefits of the Research
Qualitative and quantitative form will be subjected to rigorous analysis in formal and rigid fashion.
I believe that my model is significant as it makes security level calculations much easier than the
existing frameworks. As it uses quantitative approach, it gives concrete figures, which are easily
comparable and optimizable. Thus, it is an innovative approach. Most importantly it can be
implemented in hundreds of hours, instead of tens of thousands of man hours. I believe that this
approach is better and very significantly, as it also allows business side to understand the security
metrics – no complicated ifs and buts, but concrete figures.
This reference model is intended give benefits in the form of:
•
Allows calculation of the max security confidence/efficiency levels, total IT risk/losses and
mitigation rates for any given budget
•
Provides clear results in the form of graphs that can be included in executive reports and
are easily understandable.
•
Provides in java a full list of most optimal security measures to any given budget.
1.17 Limitations
Main improvement to the previous, theoretical model, will be that I have actual security measures
and financial information from one of the biggest universities in Estonia and security measures
implemented in a CSP from the Caribbean.
I have contacted insurance companies in Ireland to find out what information they exactly require
from the company and from CSP to provide cyber security insurance. I have not yet acquired any
detailed information but with preliminary talks it seems to indicate that they require a full security
and financial audit to be conducted by a 3rd party approved by the insurance company. I haven’t
been able to get any information what information insurance companies require from CSP-s or
even a slightest indication how they might calculate their premiums. I can only assume it is some
equation taking into consideration the level of risk and potential losses.
If the security measures information and budget information gathered is incorrect, then the model
will be inaccurate. That means, the better the experts within the company, the more accurate the
model will be. We can refer to the graded security model as decision support model, which
indicates that preliminary expert opinion is crucial for an accurate decision.
It is quite difficult to find people who are proficiently knowledgeable in IT security and in IT
security budget details.
16
1.18 Implementation
This research follows a quantitative and qualitative approach where data collected from the
business side (quantitative) and IT side (qualitative expert assessment) will be implemented into
the reference model.
To implement the model, you need to input relevant security activity areas and their cost into the
model (Kivimaa, 2013).
For parallel supporting activities Redundancy Coefficient (Rc) must be included.
As the basis I looked at CompTIA minimal IT security areas described in Foundational
Security Technology Package (Kivimaa, 2017). In 2016 CompTIA identified key
technologies required and is supported by UK Cyber Security Essentials, SANS institute
and multiple best practice recommendations worldwide (SANS, 2016):
•
Backup
•
Antivirus
•
Mail Scanning/Protection
•
Access Control
•
Patching and Updating
•
Secure Wireless
•
Control Physical Access
Supporting IT Sec activities:
•
AWT - Awareness Training
•
Backup
•
Antimalware
•
Access Rights Management
•
Patching and Updating
•
Secure Configuration
•
Encryption + key management
•
Governance
Basic examples of graphs calculations that are of interest to me are mentioned below:
•
Effectiveness, E=f(Budget)
•
IT Costs=f(Budget)
•
Calculate mitigation rate mR=f(budget) based on E: mR=1/(1-E)
•
Calculate Expected Annual Loss=f(Budget): AL=maxALE/mR
•
Total Cost=IT Costs+IT Losses=f(Budget) optimal TC is minimal,
•
deltaLoss/deltaCost=f(Budget) rational area for IT Security is where delta-
Loss/deltaCost >1
User can define multiple levels of confidence and cost. Other parameters and levels can be defined
but the model’s algorithm will base all calculation of level of confidence of the overall system and
specific security measure (Kirt, 2010).
17
•
Abstract: a reference model is abstract. The things described by a reference model are not
actual things, but an abstract representation of things. Therefore, when describing the
architecture of a house, an actual exterior wall may have dimensions and materials, but the
concept of a wall is part of the reference model. One must understand the concept of a wall in
order to build a house that has walls.
•
Entities and Relationships: A reference model contains both entities (things that exist) and
relationships (how they interact with one another). A list of entities, by itself, is not sufficient
to describe a reference model.
•
Within an environment: A reference model does not attempt to describe "all things." A
reference model is used to clarify "things within an environment" or a problem space. To be
useful, a reference model should include a clear description of the problem that it solves, and
the concerns of the stakeholders who need to see the problem get solved.
•
Technology Agnostic: A reference model is not useful if it makes assumptions about the
technology or platforms in place in a particular computing environment. A reference model is a
mechanism for understanding the problems faced, not the solutions involved, and as such,
must be independent of the selected solutions to provide value to the practitioner.
Figure 1– Graded Security Reference Model Security Levels (Kivimaa, 2017)
In above Figure 1 we can see that with each level the cost and confidence is increased. To find the
optimal confidence and efficiency for security we need to have the company’s IT budget. From
that the graded security model can calculate the optimal security profile. Firstly, is needed the
input from the person/department that is responsible for the IT security budget. Next is needed
the input of the IT security team – applied security measures and redundancy coefficient (how
much each security measure contributes to overall security).
18
Below are few examples of the model’s data processing outcomes - where you can find the
optimums, mitigation rates, efficiency, cost, loss predictions etc.
Figure 1. 1 – Reference Model Programming Layout example
Figure 1. 2 - Reference Model Programming Layout zoomed in examples
19
Figure 1. 3– Reference models generated graphs (present research)Figure 1. 45 – Efficiency/Security Level Optimums
(present research)
20
Figure 1. 3– mR chart based on effectiveness and budget
In the above Figure 1.3 we can see that efficiency increases steeply until the budget reaches
around 7500 (more detailed view when zooming in or using java console output) but after that the
output flattens out. That means, that spending anything over 7500 doesn’t provide substantial
benefits. We can state that optimal spending for the highest reasonable effectiveness and
mitigation rate is around 7500. The reason for spending more to reach higher effectiveness is if the
potential losses are very high or the data protected is highly sensitive.
21
Figure 1. 5– Three-year 3D graph (present research)
Figure 1.4 shows the mitigation rates rise over 3 years cycle. We can see that with a budget around
2500, effectiveness and mitigation rate rises drastically one the 2nd year. That is due to
contribution made to overall IT security one the first year. On the 3rd year there is a slight increase
but as most security requirements are fulfilled on the 1st and 2nd year, the security posture
improvement is not significant.
2. CHAPTER – METHODOLOGY
2.1 Methodology
The main research methods used in Economics and Commerce are:
• Empirical and experimental research-based projects - surveys, statistics, questionnaires, or
fieldwork.
• Theoretical projects - looking mainly at conceptual issues.
• Case studies - Analysis of real-world problems of which one has experience or can observe.
22
The graded security reference model was developed using a combination of theoretical method
and design science research. The model is based on info security activities and info security levels –
cost and effectiveness – gathered from expert opinions. It can be assumed that the first year will
be less accurate than the following years as IT security experts will gain more experience.
Existing models that were similar were compared and analysed, and a graph-based general
IT and information security model for enterprises and the corresponding optimization
algorithms were synthesized using CoCoViLa (Kivimaa, 2013).
Sonnenberg (2012) stated that Design Science Research (DSR) should prove the usefulness of the
designed artifact before it is even used.
DSR in information systems comprises of two primary activities - build and evaluate. This suits my
model perfectly as testing different inputs and variables is a crucial part of the research.
Prescriptive knowledge created during the build and data gathering activity is assumed to have
truthlike value. Prescriptive knowledge cannot be validated before it is applied in the model and
results interpreted (Sonnenberg, 2012). This is very to regarding the graded security reference
model – the data must be accurate and we can only verify that after the data has been inserted
into the model and calculations have finished.
In DSR there is 2 modes – Interior mode and Exterior mode (Fig.2.1).
Figure 2. 1 - Modes of DSR inquiry (Sonnenberg, 2012)
I have investigated design of other models (especially CyberProtect) to help me form a function
and design theory for graded security model. Mainly I gained from CyberProtect the concept of
using security levels and GSTool (using BIS/ISKE standard) to gain insight into security activities.
Like shown in Figure 2.1 I also used exterior modes observation part to gain overview of the
accuracy of the theory. Accuracy is based on company’s spending’s vs security measures required.
Model suggests the optimal security levels based on budget, required security efficiency and
redundancy coefficient.
As a template the model uses the security levels as they are now, budget allocated and calculates
the best variation of security measures levels within the given budget for next year. The most
demanding and time consuming is gathering all the data for the first time – with experience it
23
becomes faster and faster and the experts security plans will consider the application of the model
in the coming years.
Suggested in DSR is to use three levels of research - conceptual level, descriptive level, and
prescriptive level (Sonnenberg, 2012).
Conceptual knowledge captures “what things are out there” - concepts, models, frameworks, and
classifications and standards.
Descriptive research is dealing with describing ‘how things are out there’ and produces descriptive
knowledge from observations and research.
Prescriptive research draws knowledge from IT artifacts and recommendations. Answering a
question “how one can effectively achieve specified ends”.
For graded security reference model extensive research was performed to see what kind of models
are available (freeware only), what are their positive and negative sides, what ideas we could draw
from them. That lead me to visualizing what functions a usable model should have and how would
it be possible to be used by people with no programming experience.
I have tested the model in use and we (me and university IT security team) came to a conclusion
that the theory holds water – model is simple to implement and results are easily understandable.
Implementing the model takes hundreds of manhours, not tens or hundreds of thousands of
manhours. I observed that the business side had no problems understanding the results and very
few explanatory remarks was needed.
Figure 2. 2 - Build-Evaluate in DSR methodology (Sonnenberg, 2012)
Like seen on Figure 2.2 I have identified at least 2 major issues plaguing companies at this point of
time:
•
No efficency and security measures information from CSP-s
•
No freely available IT security models that implement security levels and algorithms.
In my model there is security measures clearly defined and also the links between them. It
implements security levels, redundancy coefficent and evolutionary algorthms. It provides clearly
defined efficency, mitigation rates and security levels.
24
I have implemnted the model fully in a major university with over 15.000 employees and students.
The data aquired from the university is accurate and 5 experienced security experst from the
university side were involved in the implementation process.
To theorize in the interior mode – in prescriptive knowledge the researcher must document the
emerging IT artifact in a way that allows to understand its purpose, rationale and how and when
the artifact is expected to work.
Design theory consists of eight components (Sonnenberg, 2012):
1. Purpose and scope
2. Constructs
3. Principle of form and function
4. Artifact mutability
5. Testable propositions
6. Justificatory knowledge
7. Principles of implementation
8. Expository instantiation.
Evaluation criteria for DSR artifacts - The suggested criteria are importance, suitability, and
accessibility of an artifact.
I feel that this type of quantitative model that takes much less time to implement than any
standard has a important place in today’s IT security field. Like predicted the biggest problem was
to gather accurate details about implemented security measures and security measures to be
implemented on the next (higher) security level. Financial information gathering was a long
process, as expected, as the business side was not very intrigued about the model and the extra
work it produced.
Figure 2. 3 - Evaluation activities within a DSR process (Sonnenberg, 2012)
There are approximately to 440 or 1026 different logical variations for implementing strong
information security. For small companies, there are significantly less variations (approximately
1010). Therefore, implementing the model in a real company can only be based on the specific case
– it is only possible to optimize the specific information security of the specific company. Existing
25
case studies are very useful as guides for new case studies – allowing significant (if the cases are
similar) savings in work hours (Kivimaa, 2017).
I have mostly followed the DSR process in Figure 2.3 in development of the graded security model.
I started with identifying the problem on the CSP and on the customer side. It was followed with
design of the model and series of evaluations as the accuracy of the data was improved. Within the
model there is two ways of implementing the algorithms – evolutionary algorithm and brute force.
Brute force takes hundreds of times longer but would be assumably more accurate. The CSP and
university model were tested in both modes and conclusion was that evolutionary algorithm in
hundreds of times faster but as accurate as the brute force approach.
2.2 Research Plan
Design Science Research (DSR) is attended to create and evaluate an IT artifact to solve a business
problem (Herner R. et al. 2004). They created guidelines for creating IT artifacts. They created 7
guidelines, but mainly I was inspired from the idea that the artifact should be also usable by non-IT
people. As business side decides how much money is diverted from budget to IT department, it is
imperative for IT department to have the ability to present their reports in simple and
understandable format to the business side.
Most security models and guidelines take thousands of man hours and are only understandable to
IT people. We need a security model that takes hundreds, not thousands (or tens of thousands) of
man hours and that results are easily understandable to business side. For example, gathering
information for the university was integrated into everyday work with basically no impact to work
performance. 5 people were involved, and everyone dedicated 2 hours per week to the task (40
hours a month). The process took 6 months, so altogether 240 hours were spent. Another 300
hours were dedicated by me as a model implementor. It is assumed that with lessons learned from
this round, the next round will take approximately 200-300 hours.
I have identified quite a few distinct existing organizational problems:
•
Companies don’t have the ability to evaluate their optimal spending’s and security standing
within reasonable timeframe (not tens of thousands of manhours but withing few hundred
manhours).
•
Customers have no way to assess Cloud Service Providers (CSP) security standings.
•
Insurance companies providing cyber security insurance, do it without having sufficient
information.
The research question for this research project is – “One potential way of calculating security
measures effectiveness”.
My idea was that having comparable security/efficiency- and mitigation levels from companies and
CSP-s side, makes it easier for customers to compare price and security trustworthiness of CSP-s.
Those figures could potentially be used by insurance companies to provide more accurate cyber
security premiums for their customers. As cyber security is in its infancy – having accurate incident
statistics is questionable.
At this point insurance companies reply mainly on business side audits and technical audits done
by 3rd party auditors.
Also, it is interesting to investigate how CSP proves if the breach was either their or customers’
fault.
At this point the research idea has been formulated and plenty of testing has been done with
fictional data. The model for a university in Estonia has been created and tested with different
methods and it has been confirmed that the model works. The data gathering period with the
26
university took almost two years and the results have been accepted and confirmed by the
university CIO, IT department, financial department, and an audit company for the university.
That has given me confidence that the basis of my idea is viable and I’m able to use university
financial data as basis for CSP. By adding CSP security measures to that, a realistic result can be
achieved.
Receiving information from insurance companies is the main obstacle at this point. I have contacted
quite a few Irish insurance companies and they are not willing to enclose any information hoe they
calculate cyber insurance premiums. Information given just stated that they require the client to
perform financial audit and IT audit with an audit company accepted by the insurance company.
When constructing the idea of the model, I will use the SMART approach (CFI, 2021):
•
Specific – target a specific area for improvement.
•
Measurable – as an indicator of progress.
•
Achievable – within the local research environment.
•
Relevant – to the aim that it qualifies.
•
Time-related – specify when the result can be achieved.
The Research Strategy section has three subsections:
•
Significance.
•
Innovation.
•
Approach.
I believe that my model is significant as it makes security level calculations much easier than the
existing frameworks. Thus, it is also innovative. I believe that my approach is better and very
significant as it allows business side to understand the security metrics better.
At this point the feedback and calculations have been done for a company. I’m waiting for
feedback from CSP, that was promised to me first or latest the second week of March.
I have received feedback from 2 insurance companies and like suspected – it is very vague and
limited. They just stated that they require for a company to order two audits – business side and IT
infrastructure side. They did not provide information what information they need from a CSP side.
I’m still in talks with them and hopefully will get more detailed information at a later date.
2.3 Data Gathering
The financial and security measures data was gathered by the expert in IT Security and finance. In
the university the data was gathered by the CIO (Chief Information Officer), 4 security experts and
the finance department. In the CSP (Cloud Service Provider) all the data was provided by the
VMware Security Architect. All the experts had over 10 years of IT Security experience and are on
top of their respective fields (Bergdahl, 2007).
The data gathering process had overall five steps:
1. Determine What Information You Want to Collect
2. Set a Timeframe for Data Collection
3. Determine Your Data Collection Method
4. Collect the Data
5. Analyse the Data and Implement Your Findings
27
There are two types of data collection – Primary and Secondary.
Primary Data Collection
Primary data collection is the gathering of raw data collected at the source. It is a means collecting
the original data collected by a researcher for a specific research purpose. The downside in first-
hand research is that it can be potentially time-consuming and expensive.
Primary data collection can be divided into two segments - Qualitative research and Quantitative
data collection methods (Cleary, 2021).
Qualitative Research Method
The qualitative research methods of data collection do not involve the collection of data that
involves numbers and is more based on the non-quantifiable elements like the feeling or
assumption/best-guess.
Quantitative Method
Quantitative methods are presented in numbers and require a mathematical calculation to
deduce.
There are multiple methods of collecting primary data, but as my IT security data came from
experts, then we can state that they used the Delphi technique (Cleary, 2021).
Delphi Technique
Just like the Oracle at Delphi (according to Greek mythology), was the high priestess of Apollo’s
temple and gave advice, prophecies, and counsel. In the realm of data collection, researchers use
the Delphi technique by gathering information from a panel of experts. Each expert answers
questions in their field of his-hers specialty, and the replies are consolidated into a single opinion
(Cleary, 2021).
Secondary Data Collection
Secondary data collection, on the other hand, is referred to as the gathering of second-hand data
collected by an individual who is not the original user. That was in my case the financial controller,
gathering IT Security spendings information for the previous year.
It is much less expensive and easier to collect than primary data.
Secondary information though raises concerns regarding accuracy and authenticity. Quantitative
data makes up most secondary data.
Main things that data gatherer must keep in mind are both data gathering stages (Cleary, 2021):
•
Data Completeness
•
Data Accuracy
•
Data Reliability, i.e., reproducibility
•
Data Reasonableness (Reality Checking)
28
Reporting
Data reporting is the process of gathering and submitting data to be further subjected to analysis.
The key aspect of data reporting is reporting accurate data because of inaccurate data reporting
leads to inaccurate decision making (Cleary, 2021).
Pros
•
Informed decision-making.
•
Easily accessible.
Cons
•
Self-reported answers may be exaggerated.
•
The results may be affected by bias.
•
Respondents may be too shy to give out all the details.
•
Inaccurate reports will lead to uninformed decisions.
Existing Data
This is the introduction of new investigative questions in addition to/other than the ones originally
used when the data was initially gathered. It involves adding measurement to a study or research.
An example would be sourcing data from an archive – in university case, the data from the
previous year (Cleary, 2021).
Pros
•
Accuracy is very high.
•
Easily accessible information.
Cons
•
Problems with evaluation.
•
Difficulty in understanding.
3. CHAPTER – LITERATURE REVIEW
This literature review section is meant to give me ideas how to design my model, what to measure,
how many security levels is realistic to use etc. It also allowed me to converse with Caribbean CSP.
Gave me direction what to ask them and what issues to emphasize.
There is no model like mine – closest was GSTool, but the support for that software ended in 2016.
Whenever some researchers state a model or a tool in their research it is just a framework like any
given standard – just provides a framework but no actual tool/program where you can enter the
data and calculate quantitative answers. There is most likely something similar in use in big banks,
insurance companies or even in CSP-s, but nothing is obviously shared with the public.
My model is unique in multiple ways – it uses security levels (0-3), it uses redundancy coefficient
for every single security activity in a relevant security area and the level of support the security
29
areas provide to Relevant areas (People, Software, Hardware – all under Governance umbrella). It
uses IT budget (not only security budget) and especially Annual Loss Expectancy. Loss doesn’t
mean it happens every year – even if a major leaks and GDPR fine of 4 million occurs once in 20
years, I have calculated in a potential loss of 200,000 a year which will cover the major loss
happening every 20 years.
It allows individual investment and maintenance to be set on individual security measure.
The basis for my model is quite unique as it needs involvement of the Financial Controller and
various (or perhaps one for a small company) security experts. For example, in the university five
different security experts were involved as they all dealt with different part of the whole security.
My model does require input from a qualified security expert who knows the current state of
security posture and can tell what higher level security posture requirements would be.
As there is no other even closely similar model openly available, thus my literature review is just an
overview of articles and theses that gave me ideas for my model or rebutted my ideas.
My main aim is to gain quantitative figures regarding security effectiveness and no such model was
to be found. Even theories that described security frameworks lack some very important parts like
ecoefficiency of individual security measures and Annual Loss Expectancy.
3.1 Literature Review
Maroria (2013) used in his research a qualitative and quantitative research methodology, various
ways of data classification were identified. Those included - classification based on type of data,
owner, value of data, sensitivity of data, legal and regulatory requirement, user needs etc. The
research also investigates various data security requirement and problems - CIA, legal
requirements, data response, utility, accountability and privacy. That proved to me that having
only one security specialist might not be enough for a such a large organization like a university. It
is improbable that one person can be knowledgeable in all those areas. In the university, beside
the CIO, four more specialized security specialist were involved.
Data center managers and IT security professionals engage in a perpetual game of cat and mouse
with hackers, identity thieves, and even organized criminal syndicates. As fast as they deploy
security counter measures; these criminals discover loopholes or entirely new avenues of attack.
Chief Financial Officer (CFO) and Chief Information Security officer (CIO) continue debating on the
need to reduce cost and the need to invest more on security. How best to implement security
while optimizing security cost is big challenge for many organizations.
That makes my model unique and nothing anything even close to be it can be found on the free
market. It only not allows to set security measure levels, redundancy coefficient, budget etc. but it
also considers annual loss expectancy. The data entered to the model is very accurate as it is based
on previous years data.
Shim (2010) wrote in his doctoral thesis that one of the common ways of transferring residual risks
is to use market insurance mechanisms. Cyber insurance was created to mitigate IT security risks,
particularly in cyberspace. It covers physical losses such as computer theft and hardware
breakdowns as well intangible losses caused by data loss and leaks of confidential information.
He designed a framework of employing cyber insurance mechanisms for mitigating IT security risk
that cannot be managed by technology-based solutions. He stated that organizations need to
assess their own IT security risks to fill the gap of residual risk using cyber insurance products.
Their key finding was that cyber insurance could serve as a strong incentive for increased
investment in self-protection. He presented economic models of under- and over-investment in
security protection under correlated security risks. That’s why I think my model is important – it
will take all information from previous year and by changing (decreasing or increasing) the budget,
we get suggested security measures and their levels to be implemented the following year.
30
Using game theory to address the economic incentives for company’s sharing security information
and proposed a theoretical framework which can explore the relationship between information
sharing and information security investments. They showed that there are strong economic
incentives for organizations to share security information if such sharing of information results in
sufficiently large positive demand. That applies to companies that require cyber insurance but
does not apply to CSP-s. CSP-s are not publicly sharing information about confidentiality and
integrity – just availability. As the GDPR fines reach up to 40 million euros per incident, then
companies spend large sums on IT Audits and Financial Audits to acquire cyber insurance. Shims
research gave me an idea that the output from GSRM (Graded Security Reference Model) could be
used instead of IT Audit and Financial Audit as it provides also Annual Loss Expectancy information
which covers not only IT but the entire company.
If CSP-s would use GSRM and publish their security efficiency data, it could greatly speed up the
acquiring cyber insurance process and would give customers a required information regarding CSP-
s security when choosing their provider.
Whaiduzzaman & Gani (2014) acknowledge that number of shortcomings in reliable monitoring
and identifying security risks and threats exists in Cloud Computing. They suggested the use of
trusted Third Party (TTP) like credit rating agency. TTP should present security ranking by
identifying current assessable security risks. They suggested to use automated software scripting
for penetration testing to run on CSP side. It should identify the vulnerabilities and check security
strength and fault tolerance capacity of the CSP. At this point I already realized from my
experience in Microsoft in Ireland that it would never be allowed. I worked as Azure engineer and
was aware that huge clients and insurance companies had access to demo environments under
supervision, but no-one would ever be allowed to run any scripts even in isolated demo
environment.
Whaiduzzaman & Gani (2014) felt the need for a ranking system by which a new cloud customer
can identify his/her needs and take the calculated risk of business data. Which I agree with 100%
but before that could happen, one of the major CSP-s should implement the ranking and other
would be forced to follow suit. Not one has felt the need yet and it is hard to see why they should.
I think the only way to implement any security ranking on CSP-s would be government regulations
demanding it.
Their assumption was that all new cloud customers can independently make decisions without any
cloud broker which is a significant feature of their model. Making TTP model available in
worldwide a TTP monitoring system is proposed that provide higher confidence and wider
acceptability, and homogeneously and impartially available worldwide.
In their conceptual model, several assumptions should be considered:
• Like credit Rating company, TTP must maintain the trust and reliability.
• TTP should have enough resources to provide for processing and executing their own work.
Figure 3.- Conceptual Model of CSP ranking system Whaiduzzaman & Gani (2014)
31
TTP should collect other non-measurable factors such as: previous down time, user feedback,
provide input of other non-measurable criteria or metric as a value or metric to give the result in
quantitative figures. Influencing factors such as the location of CSP, platform, hardware,
infrastructure, elasticity, service provisioning, hiring human resources, company policies,
maintaining standards of SLA and previous downtime, customer satisfaction records should be
considered. This sounds farfetched as I don’t see how their proposed script would ever be able to
capture all that information. For sure no script would ever be allowed to access any HR data and
company policies. SLA and customer satisfaction data should be inputted by a customer and CSP-s
monitoring software (SLA) and that hardly can be captured by a script.
Same applies to infrastructure information and elasticity.
Benefits of the model should be (Whaiduzzaman & Gani, 2014):
• Model provides an easy and convenient way to find a secure CSP by rank system.
• The interpretation of ranking system is easy so customer can evaluate the ranked result for TTP
website and interpreted themselves.
• No need of any brokerage or other help to find desired CSP.
• This rank system conceptually monitored by different layer of supervision and monitoring which
ensures the homogeneity of rank system worldwide.
• Unavailability of one TTP will not be a problem since multiple TTPs will work in one region.
• Model ensures a new customer to adopt best secured cloud from the market.
In general, I would say that their idea is very grandiose, but in reality, it is not feasible. Compared
to my model, where company or CSP would be self-sufficient to gather and enter all required data
and doesn’t allow 3rd parties to interfere is more plausible. I feel that there is a small chance that
CSP-s would implement my model but allowing all that access to TTP-s seems like fiction.
Shaikh & Modak (2017) stated that the user identity, credentials, and data privacy etc., are some
of the issues for which user needs to assure about proper control by the provider. A tool to assess
and select the cloud security based on the user demands is needed in a cloud environment. They
propose a data security measurement tool is proposed that will be used to measure the cloud
computing data security.
Data protection issues including data confidentiality, integrity and availability are key security
issues in cloud computing. They propose a data security assessor tool is proposed that includes a
set of parameters and Sub parameters.
32
Figure 3. 1 - Data Protection parameter
A. Stored Data Protection (D1)
Stored data is prone to physical damage of the media, unauthorized access and modifications.
Data protection at the storage should be the combined efforts taken by both CSP and user by
maintaining privacy and integrity. User can perform encryption and at the provider side provider
can also perform encryption leading to double encryption. Data protection i.e., D1 is proposed as a
weighted sum of the following sub parameter or functions:
a) Encryption from user side (En1)
User data encryption key size is used to determine the strength of encryption.
b) Encryption from server side (En2)
CSP can also perform encryption before storing the data on to the cloud. This will increase the
storage strength of the cloud data.
c) Disk leakage property (DLP)
Media used for data storage will also contribute towards the strength. Magnetic disk, compact
disk etc. are more superior for storage comes with longer life span in terms of data loss as
compared to other media types. Bit error rate is probability ok leakage by a media device over a
period. Value for DLP is {8 or 5} depending on the disk or tape respectively.
d) Integrity strength (INT)
Most crucial issue for any data is of getting modified by malicious entity, either intentionally
or otherwise. Data integrity strength measures this with respect to data storage encryption key,
use of cryptographic hash or use of the parity check.
B. Measure of access granularity (D2)
In a shared cloud environment multiple users access the same portion of datacenter, leads to
performance issues. The performance bottleneck that could be determined by the cloud
users can be measured by checking the level of data access granularity. As the access granularity
33
increases performance bottleneck is reduced and accordingly security concerns with respect to
data updates are affected.
C. Update/Delete Anomalies (D3)
Updating and deletion method provided by a cloud service also considered while evaluating data
protection strength. Some services provide permanent delete of data and some
make it just in-accessible.
D. Transient data protection (D4)
Data protection strength at the time of migration is determined by the encryption key size. This
key is used to encrypt the data passing between provider and user.
E. Backup and Disaster recovery plan (D5)
Provisions available for disaster recovery also contribute towards the data protection strength.
Time to perform backup and frequency of backup are the measures that is used to determine its
strength.
B. Evaluating Fairness of the Model
A second aspect of evaluating model is to validate it against actual services and see if the values
computed are meaningful and indicative of the “trust-ability” of the service. For this
purpose, the trust model is evaluated against a number of existing cloud service providers. Data
security issues handled by various cloud service providers vary. Following are the cloud services
considered for evaluation.
.
34
Figure 3. 2 – Security Challenges Addressed
I do agree with most of the Shaikh & Modak (2017) statements and assessments, but I do feel that
they have not considered few aspects that might be a bottleneck also. I agree that client-side
encryption and CSP side encryption together is a great way to protect data integrity. How long
does it take for large datasets to be decrypted? How does that affect the availability/usability of
the data?
35
Next article/whitepaper was choses mainly that Estonian ISKE standard (which Im quite familiar
with) is based on German BIS standard. It was amazing overview as it brought in CIA which I
consider being the minimum when talking about IT security.
Hanges (2015) whitepaper on Security Recommendations for Cloud Computing Providers largely
based on ISO 27001/2 and BSI 100-2. It is created by Federal Office for Information Security (BSI in
German) and I think it was used as a template in creating Germany Government Private Cloud. It
covers both Private and Public Cloud recommendations. The recommendations are ranked into
three categories –
•
B stands for basic requirement (aimed at all cloud service providers),
•
C+ (=Confidentiality high) covers additional requirements for areas with a high confidentiality
protection requirement,
•
A+ (=Availability high) covers additional requirements for areas with a high availability protection
requirement.
The entire whitepaper is quite comprehensive and gives different category recommendations
(Data Centre security, Server security, Network security, Application and Platform security, Data
security, Encryption etc.). The subcategories are too many to mention but below is a screenshot of
recommendations for CSP providing SaaS.
Figure 3. 3
- CSP recommendations for SaaS platform (Hanges, 2015).
That whitepaper gave me a very good overview but not enough details I was looking for. Benefit of
reading it was that now I know what sort of questions to ask the CSP.
Friedrich-Baasner et al (2018) looked into reasons why SME-s (Small, medium enterprise) in
Germany might move their business to the Cloud. What I found interesting was technological
36
reason “security”, environmental reason “privacy” and individual reason “trust”. As they
interviewed IT specialist in SME-s, I was wondering how can they state things like that? Which part
of CSP service gives you security, trust and privacy? Is it because they claim to provide that or is
there any evidence to back it up? They collected data
via surveys and interviews, but never looked
into what reasoning was behind the IT specialist’s “expert” opinion. There are multiple examples
what the specialists answered, but they all sounded like an advertisement for cloud services – it
applies to all 3 reasons I mentioned. There were altogether 32 reasons given, but I could relate to
rest of them, except the above mentioned three. I have a contact in a CSP, working as a Security
Architect, so my aim is to get more detailed knowledge about what security measures they apply
in reality.
Nur Ilyani Ahmad et al (2019) acknowledges that Cloud is a growing trend and there is no real
alternative. They pinpoint the security, loss of control and governance issues. Based on ISO/IEC
27017 – clouds specific standard – there are 7 domain categories and 37 security controls that CSP
has to implement. If we add also ISO/IEC 27017 standard, there will be additional 7 security
controls. I would like to know if they do and also want to get a response to their claim that they
provide banking level security. As per BSI (2015) – German Federal Office for Security – there
should be 66-69 security measures. From my perspective it does not matter which is true, because
adding new security measures in my model is quite simple and quick process. I felt that main thing
next to security measures is the governance. If there is no governance, then overall security will be
weak.
Rizvi, S et al (2020) proposes to use a fuzzy-based trust model for CSP-s to self-evaluate and
promote their trustworthiness. They define 2 types of trust as follows - Subjective trust is gradual
formulation of trust based upon continuous interaction and encompasses user’s perception of the
intentions of the other party. The subjective trust used in their paper and combines direct,
recommendation, and reputation trust in order to create a comprehensive trust but with a degree
of uncertainty Objective trust involves quantitative data – graphs, equations, data etc. involved to
assess the mathematical trust value. Their calculations were very complex and way above my
ability to understand, but I found similarities between our approaches – both require CSP to self-
evaluate. It is much to hope that CSP-s would allow scripts or 3rd parties to access their actual
production environments. The difference being my approach would have an insurance company as
an independent auditor as they do have access to demo environment in CSP data center. But what
I found incredibly useful in their research was the reasoning behind why CSP should do it – to build
trust and build a reputation to gain more customers. I think making more money is a good
incentive for a CSP to implement their own model or my model. And I believe if one does it, others
must follow, otherwise they will be in a great disadvantage.
Kequin Li (2020) has a good basic idea that all CSP-s are competitors, and they are interested in
providing the best service and have the most loyal customers. This enforces the ideas by Rizvi, S et
al (2020) that most probable would be to get the CSP-s to self-evaluate. He states that oligopoly
can be turned to a hypothetical game theory – non-cooperative game approach. Im not sure if his
basis of the game – all CSP-s having the same customer satisfaction level – is possible in the real
world. But even having that very mathematically complex study done, shows that CSP-s do
compete, and the market is limited. That made me think of smaller companies with very limited IT
security knowledge. There are quite a few securities related games on the market and they would
provide a good possibility for smaller companies security teams to investigate different attack
37
vectors and countermeasures. My model will be tested in two environments – customer on-site
security posture and CSP security posture. Both are equally important – if customers infrastructure
is weak and employees not trained then no security measures deployed by the CSP will keep their
data safe.
I think that Benabied el at (2015) research on Cloud Security Framework has some
merit (though not peer reviewed), because that is the only thing what user can do at
the moment. He states that we cannot change a CSP behavior, but we can do certain
things on our own part to keep our data as safe as possible. They propose two tier
frameworks based on trust model and mobile agents.
1) Trust model that calculates users’ trust with respect to their domain trust degree.
2) Monitor users’ behaviors. He suggests using mobile agents.
Interface Agent - just a graphical interface to other modules
Proxy Agent - authenticate user and talks to trust user agent to verify trust degree
Trust Agent - checks and updates users trust degree
Mobile Agent - launched by the proxy agent and it migrates to a cloud service provider site as
missionary.
And following steps are taken to connect to a CSP –
STEP 1: the user sends his identification
information to the interface agent.
STEP 2: the interface agent sends the identification information to the proxy agent.
STEP 3: the proxy agent checks the credentials and if the access information is correct, it
establishes a secure SSL connection with interface agent, and asks it to load the interface, and to
transmit the user request. Otherwise, the access request is rejected.
STEP 4: the proxy agent sends the user identifiers to the trust user agent (TUA) for trust level
checking.
STEP 5: trust user agent calculates the trust level of the user, and compares it with a specific
threshold, if it is greater than this threshold TUA returns response (trusted user) to proxy agent,
otherwise returns (not trusted user).
STEP 6: Connecting to CSP
It is not correct approach to put all the blame on the user. This could backfire badly when it comes
to cyber insurance. Data breach happens and it is NEVER CSP-s fault. I think we should look for
ways to put more responsibilities on the CSP. Customer pays a lot of money and gets little in
return.
Torkura et al. (2020) engineered a chaos algorithm o test for testing cloud vulnerabilities. This
includes Access Control Policies, overprivileged users and lack of audit logging. Cloud Security
Alliance (CSA) stated that data breaches due to misconfiguration and inadequate change control to
be the top 2 problems. 49% of breaches are due to system faults or human error. That figures
apply to customers, but we can be quite certain that the number is not much lower for CSP
employees and systems. Torkura et al. uses RDFI – Risk Driven Fault Injection – loop approach with
MAPE-K (Execute Monitor Analyze Plan over-a-shared Knowledge-base) framework to inject
known issues from CVSS - Common Vulnerability Scoring System. They use Java API of AWS etc., so
no agents are installed on target cloud system. They inject faults to impact confidentiality, integrity
and availability (CIA). They have tested their approach on AWS S3 . I feel that if there would be an
independent 3rd party to run those tests on every cloud provider, it could give users some
understanding ow secure the CSP systems are based on the statistics, it would be feasible to give
38
every CSPs (and their different products) a score rank. It would help customers, but also would
force CSPs to fix their security issues.
Hong et al. (2017) conducted a survey of usability and practical application of Graphical Security
Models. I found it remarkably interesting because my model is
graphical. We all know that money
to IT departments comes from CEO or the board and they are not very tech savvy, so having a easy
to understand graphical model to prove your claims is very important. They investigated various
aspect in their surveys and also in reviewing past surveys, but I was mostly interested in Usable
Metrics and Complexity aspects as I think my model is very easy to use and it does give various
readable metrics that can be presented easily to the board. Hong et al. investigated security
models that deal with networks – like most of them do – and their main finding was that though
they provide basically the same capability, the way to use them differs greatly, making them
difficult to comprehend. As far as I know, there is nothing like my model on the market, but I do
admit – it might look confusing at first sight.
ISKE/BIS (Bundesamt für Sicherheit in der Informationstechnik
) (RIA, 2015) makes use of CIA
(Confidentiality, Integrity and Availability) security classes in mapping their information systems
and I have used the same approach in grades security reference model.
All security classes are divided into four levels:
Availability –
A0 - Reliability is low, the total allowable downtime is more than 1 day a week.
A1 - Total downtime allowed up to 1 day per week.
A2 - Total downtime allowed up to 2 hours per week
A3 - Total downtime allowed up to 10 minutes per week
.
Integrity –
I0 - The identifiable nature of the alteration or destruction of the information are not relevant;
accuracy, completeness and timeliness checks are not required
I1 - The fact of changing and destroying the information must be identifiable accuracy,
completeness, and timeliness checks in specific cases and as appropriate
I2 - The fact of alteration and destruction of the information must be identifiable; the accuracy of
the information required, periodic completeness and timeliness checks
I3 - The fact of alteration and destruction of the information must have probative value; the
accuracy of the information required, real-time completeness and timeliness check
Confidentiality –
C0 - Public information: access to information is not restricted, i.e., the right to read for all
interested parties, the right to change defined integrity requirements
C1 – Information for internal use: access to the information is granted to the person requesting
access in the case of a legitimate interest
C2 – Confidential information: access to information is allowed only to certain groups of users,
access
the person requesting access has a legitimate interest
C3 - Top-secret information: access to information is restricted to certain specific users, access to
information is permissible in the legitimate interest of the person requesting access
39
We have used the same approach on analyzing the CIA security standing of the university and the
tables created looked similar to one below:
Figure 3. 4 – Risk considerations (present research).
I have only presented an example in Figure 3.2 as I signed a NDA (Non-disclosure agreement) and I
was not given permission to publish universities specific risk consideration assessment.
I have felt that CIA Triad has been missing some crucial security goals. Reference Model of
Information Assurance and Security (Cherdantseva and Hilton, 2013) has filled in many missing
goals.
Addition are as follows:
•
Accountability
•
Privacy
•
Authenticity and Trustworthiness
•
Non-Repudiation
•
Auditability
Figure 3. 5 – Reference Model of Information Assurance and Security – RMIAS - (Cherdantseva and Hilton, 2013)
40
Information Assurance and Security considerations could also include (Figure 3.3) (Cherdantseva
and Hilton, 2013) -
Confidentiality
Information system must be able of storing, accessing, and modifying data and should provide
confidentiality. Every action must be authorized, and no unauthorized access should be allowed.
Confidentiality is enforced with Access Level Restrictions (ACLs) and Cryptography while storing
and transferring data.
Integrity
Data cannot be in no way contaminated and modified. Data store or an application process will be
genuine and is not tampered by any unauthorized parties. Anomaly checks and hashing on storage
applications and processing applications are used in implementing integrity.
Availability
Availability provides accessibility to the information to the authorized user or owner with high
efficiency. Information processing system must be redundant against attacks (DoS, DDoS etc.)
Measures used can be Load balancing, Distributed asset storage and Decentralized architecture.
Accountability
Authority of information systems to successfully inspect the actions of an entity and hold them
accountable for the actions.
No entity (authorized unauthorized or the owner itself) should be able to deny the changes made.
Measures implemented include digital signatures, asymmetric cryptography and digital
certificates.
Privacy
Privacy gives the ability to abstain from sharing assets and associated attributes. Asset owner
should be able to decide the norms on which access to that information is allowed.
Privacy involves complying to legislations, standards, and even political requirements like GDPR,
Privacy Framework by NIST etc.
Authenticity and Trustworthiness
Information system should be able to successfully establish trust and authenticity before the
interaction. Two entities communicating should be able to trust and authenticate each other.
When this is achieved, the actual transaction can start.
This requires checking certain things like the SSL keys, Certificate and the domain registration
details, unique ID associated with the account etc.
Non-Repudiation
Requires the ability to confirm the action performed and must not have un-deniable proof of
action. Systems without non-repudiation might lead to serious impersonation attacks.
41
Auditability
Every change or action on an informational asset should be auditable. Meaning all actions must be
recorded and validated.
These changes include ones done by both humans and the systems. Both external, internal audits
should be possible and must ensure compliance.
Money is needed for specified optimal spending’s – reasonable expense
.
The dependence of critical activity on the information system was determined using the following
scale:
1
- Dependence is not very important
2
- Dependence is important, but there is an alternative solution
3 - Dependence is critical
In the risk analysis, it is obligatory to consider the following types of danger as the risk scenarios
(causes of a cyber incident) ((Cherdantseva and Hilton, 2013):
• Physical damage
• Natural event
• Power failure
• Network interruption
• Software error
• Hardware error
• Device failure
• Cyber attack
• Physical attack
• User error
• Administrative error
• Error with external service provider
Figure 3. 6
– Risk assessment – Critical systems ((Cherdantseva and Hilton, 2013).
Big part of ISKE/BIS is aimed to Identifying existing security measures and vulnerabilities.
Weaknesses can be classified and grouped, for example, as follows:
• organizational weaknesses
• staff weaknesses
• infrastructure weaknesses
• technological weaknesses
42
Company must conduct analysis to identify vulnerabilities that could lead to threats to systems or
the organization. They also must finding the likelihood of a threat materializing from that
weakness. Finding the likelihood of a threat materializing is based primarily on previously
identified vulnerabilities/weaknesses, considering previously applied security measures.
The purpose of probability assessment is to identify the security measures in place to prevent,
detect and mitigate disruptions that have been implemented to minimize or reduce the likelihood
of the risk materializing.
Figure 3. 7 – Probability ranking and materialization criteria ((Kivimaa, 2013)
There are generally three types of measure, that can be implemented:
•
Preventive measures - aimed at preventing the realization of the threat.
•
Detectable measures - used continuously to identify hazards and to define and specify the
situation that has arisen when a threat has materialized.
•
Mitigation measures - aimed at reducing or avoiding possible negative effects when the risk
materializes.
43
Figure 3. 8 - Criteria for the consequences of the realization of the threat (RIA, 2021)
The level of risk criticality is expressed in ISKE/BIS as a risk class
.
Risk class = Consequence x Probability
Figure 3. 9 - Descriptions of risk classes (RIA, 2021)
Below on Figure 3.8 we can see how ISKE (Estonian Information Security Standard) has made use
of BIS (Bundesamt für Sicherheit in der Informationstechnik) standards and ISO standards.
The outcome of the universities internal risk analysis will produce the following output as per
ISKE/BIS:
44
Figure 3. 10 – Risk assessment – Risk table ISKE/BIS (RIA, 2021)
Figure 3. 11 – Risk mitigation plan (RIA, 2021)
Figure 3. 12 – Estonian Information Security Standard (RIA, 2021)
The previous examples are used by the university also as ISKE is mandatory methodology for all
Estonian government departments and also many larger companies follow this standard.
The examples have shown clearly that most of rankings go from very general minor/small to
catastrophic/very high and are qualitative. Qualitative assessment of risks might answer the goals
set by ISKE/BIS and ISO standards, but they dont provide quantitative results that can be
influenced by adding or removing security measures.
3.2 Security Standards and Frameworks
The most popular IT security standards are ISO, NIST and in Estonia, ISKE (German BIS). They all
have their advantages and disadvantages and I feel that the best result for a company (if they are
45
looking for higher security level, not accreditation) is combining different characteristics from
different frameworks.
3.21 ISO Security Standards
The ISO 27001 (officially named ISO/IEC 27001:2005) standard provides guidance to building an
effective information security management system (ISMS). The standard doesn't specify a
particular method but recommends a “process approach” - Plan-Do-Check-Act strategy. It allows
the use of any model if the requirements and processes are clearly defined, implemented
correctly, and reviewed and improved regularly
Figure 3. 13– ISO 27001 implementation steps (27001 Academy, 2021)
16 steps of ISO 27001 implementation (27001 Academy, 2021):
1. Obtain management support - get enough people for the project and sufficient finances.
2. Treat it as a project - define what is to be done, who is going to do it, and in what time frame.
3. Define the scope - include whole of the company or just certain parts.
4. Write an Information Security Policy - highest-level internal document in your ISMS.
5. Define the risk assessment methodology - most complex task. Define the rules for identifying
the risks, impacts, and likelihood. Define the acceptable level of risk. I
6. Perform the risk assessment & risk treatment - comprehensive picture of the internal and
external dangers to your information. Decrease the risks that are not acceptable.
7. Write the Statement of Applicability - Which controls from Annex A you need (there are 114
controls). This document (SoA) is to list all controls and to define which are applicable and which
are not - the reasons for such a decision and the objectives to be achieved.
8. Write the Risk Treatment Plan - to define exactly how the controls from the SoA are to be
implemented – who is going to do it, when, with what budget, etc.
46
9. Define how to measure the effectiveness of controls - if you can’t measure what you’ve done,
how can you be sure you have fulfilled the purpose?
10. Implement the controls & mandatory procedures - you must implement the documents and
records required by clauses 4 to 10 of the standard, and the applicable controls from Annex A.
11. Implement training and awareness programs - train your people to be able to perform as
expected.
12. Operate the ISMS - ISO 27001 becomes an everyday routine.
13. Monitor the ISMS - you must check whether the results you obtain are achieving what you
have set in your objectives.
14. Internal audit - to find out potential problem areas and take corrective and/or preventive
actions.
15. Management review - if the ISMS is achieving the desired results and fulfilling the defined
requirements, management must still make some crucial decisions.
16. Corrective and preventive actions - corrective and preventive actions are done systematically.
The downside of this standard is that implementation and accreditation costs can also be
considerable. Certification can potentially bring benefit, acquiring a certification is extremely costly
and time consuming. Company must pay a substantial amount to its consultants and registrar. (Hsu
et al, 2018). All that also requires extensive documentation.
ISO 27001 standard was first developed in 1995 as BS-7799. ISO 27001 is a standard defines a set
of principles to implementation an appropriate information security management system. ISO
27002 (formerly called ISO 17799) is a guideline and code-of-practice on Information Security
Management System (ISMS) implementation and is a complementary standard to ISO 27001. ISO
27005 concentrates on the other hand on the information security risk management - detailing the
risk management approach taken by ISO 27001 (Hsu et al, 2018).
In reality, ISO 27001 is more of an obligation to many companies, instead of a competitive
advantage.
3.22 NIST Risk-management framework
Federal Information Security Management Act (FISMA) had demand for information security (IS)
requirements for the federal government and contractors recruited National Institute of Standards
and Technology (NIST) to develop IS standards and guidelines to allow for compliance. NIST had to
establish mandatory minimum IS standards and guidelines, while ensuring flexible implementation
based on diverse business functions.
The RMF (Risk management framework) promotes a
disciplined, structured, and flexible process for applying the NIST security standards and
guideline
s (http://csrc.nist.gov) based on specific missions, business functions, operational
environments, technologies, and threat conditions (Ross, 2008).
Framework can be implemented as “plug and play” and it allows the use of any security
categorization approach, risk assessment, set of security controls, or assessment process in
any organization.
NIST special publications 800–37, 800–59, 800–60, 800–53, and 800–53A have been vetted and
input received from a tens of thousands of individuals and organizations that use the standards
and guidelines. This ensures that the standards and guidelines are technically sound, cost-
effective, sup to date and can be implemented as needed.
NIST is mandatory for U.S. federal agencies, but it has gained wide approval by organizations all
over the globe.
47
Figure 3. 14– Entire NIST Risk-management framework (Ross, 2008).
NIST security framework is divided into a cycle of 5 security areas/steps –
Figure 3. 15– NIST Framework 5 areas (NIST, 2015)
•
Identify
•
Protect
•
Detect
•
Respond
•
Recover
The 5 security areas are divided into 22 categories as seen on Fig. 1.16
•
Identify –
1.
Asset Management
2.
Business Environment
3.
Governance
4.
Risk Assessment
5.
Risk Management Strategy
48
•
Protect –
1.
Access Control
2.
Awarness and Training
3.
Data Security
4.
Info Protection Process and Prcedures
5.
Maintenance
6.
Protective Technology
•
Detect -
1.
Anomalies and Events
2.
Security Continuous Monitoring
3.
Detection Processes
•
Respond –
1.
Response Planning
2.
Communication
3.
Analysis
4.
Mitigation
5.
Improvements
•
Recover –
1.
Recovery Planning
2.
Improvements
3.
Communications
Figure 3. 16– NIST Cyber Security Framework overview (NIST, 2015).
49
Using NIST special publication 800–53 catalog demonstrates the commitment to increase
information-system security levels beyond required minimum baselines.
NIST 800-53 has 22 Categories and 98 Sub-categories as seen on a table Figure. 3.18.
Figure 3. 17– NIST Cyber Security Framework detailed fill-in sheet (NIST, 2015).
The subcategories list is available from the following link -
https://www.nist.gov/document/csfsubcategories-sp80053mappingxlsx
The benefit of NIST is that it is public domain, and it is mostly free for everybody – with the
exceptions of Standard Reference Data.
3.23 ISKE/BIS
ISKE is an information security standard that is developed for the Estonian public sector.
ISKE is compulsory for state and local government organizations (just like NIST is compulsory for
U.S federal agencies) who handle databases/registers.
ISKE is based on the description of information assets that need security using standard modules
and includes the means to determine the security class of each type of module and the required
security level of the module according to this security class. Depending on the required security
level of the type of module, it is determined security measures from the reference directories
through the security specification of the module and are verified security of the module using the
reference catalog of threats (RIA, 2021).
A three-level baseline system means three different sets of security measures for three different
security requirements have been developed (different databases and information systems may
have different security levels) (RIA, 2021). Compared to the one-level baseline security system this
version is more accurate (economic), while being more inaccurate, compared to detailed risk
analysis.
ISKE is based on a German information security standard – IT Baseline Protection Manual (IT-
Grundschutz in German) – which has been adapted to fit Estonian situation.
50
ISKE is baseline security system - one set of security measures will be applicable to all information
assets, regardless of their real security requirements.
ISKE contains more than 1,000 security measures. The main disadvantage of the system is the
implementation of an average set of measures to systems with different security requirements.
Process for the implementation of ISKE is as follows –
•
Mapping databases.
•
Mapping information systems and other information assets.
•
Identifying links between databases, information systems and other information assets.
•
Identifying the required security class and level for databases.
•
Identifying the required security class and level for information systems and other
information assets.
•
Identifying the typical modules, which comply with information systems, and other
information assets.
•
Identifying the required security measures for information systems and other information
assets.
Benefits of ISKE (RIA, 2017) –
•
Regularly updated – every 1-2 years.
•
Free of charge
•
No need for time consuming risk assessment.
•
Comprehensive set of safeguards.
•
Suitable granularity.
•
Enables to justify investments into IT security in a needed level.
•
Enables to develop a common understanding about the security level.
Security class is used to select a appropriate security levels to all information assets deemed to
need one based on security analysis.
There are a total of 64 different security classes, ie three different combinations of security
sub-classes.
The following table corresponds to these 64 combinations of three levels of reference security:
•
low security level (L),
•
average security level (M),
•
high security level (H).
51
Figure 3. 18– ISKE reference security combinations (Kivimaa, 2013).
Based on the security class of each information asset, the required for the respective asset is
found in the table of reference security level and indicated in the corresponding information
asset specification box. Then, in the type of module catalog M, the symbol of the type module
corresponding to this information asset (indicated in the relevant box of the information asset
specification) is found.
Once the security levels of all specified assets have been determined, further action will
depend on the action taken on the security levels (RIA, 2017):
•
If all assets have the same level of security, security measures may be imposed through the
catalog of security specifications and security measures for standard modules.
•
If there are two or three security levels, the possibility of authority information security must
be analyzed for appropriate zoning.
In the ISKE catalogs, the factors influencing information security are described and divided into
five standard modules:
1) General components
2) Infrastructure
3) Information technology systems
4) Networks
5) Information technology applications
Each module describes in detail what measures need to be taken at a certain level of security.
Security measures, in turn, are divided into ten categories:
1) Infrastructure
2) Organization
3) Staff
4) Hardware and software
5) Communication
6) Disaster Recovery
52
7) (H) Mandatory general measures
8) (H) Security measures for information availability
9) (H) Information integrity security measures
10) (H) Security measures for the confidentiality of information
All security classes are divided into four levels using CIA triad (Kivimaa, 2017):
Confidentiality –
C0 - Public information.
C1 – Information for internal use.
C2 – Confidential information.
C3 - Top-secret information.
Integrity –
I0 - Accuracy, completeness and timeliness checks are not required.
I1 - Information must have identifiable - accuracy, completeness, and timeliness checks when
appropriate.
I2 - Information must be identifiable - accuracy of the information required, periodic completeness
and timeliness checks.
I3 - Information has probative value - accuracy of the information required, real-time
completeness and timeliness check.
Availability –
A0 – Low reliability - downtime is more than 1 day a week.
A1 - Downtime up to 1 day per week.
A2 - Downtime up to 2 hours per week
A3 - Downtime up to 10 minutes per week
Main downfall of ISKE is that it is very comprehensive (ISKE manual is 3833 pages long) and it is
impossible for a smaller business to implement. It takes years for a government agency to
implement. ISKE audits are only conducted on small parts of the security areas at the time.
Information security is an ongoing process to ensure the confidentiality, integrity and availability
of data and assets. The goal is to find a balance between these three components and ISKE can be
very good reference. At the same time, the whole catalog gives a chaotic impression and is difficult
to manage and comprehend.
There was developed a ISKE application tool, which was planned as a tool that helps and supports
the implementation of ISKE and enables mapping of information assets used in the organization,
determination of security classes and security levels, linking information assets with standard
modules, grouping and zoning of information assets. In addition, the tool was supposed to allows
you to create and manage an implementation plan. The tool was created in 2011, but already in
2017 the tool was not available, so we can assume that the tool wasn’t as helpful as intended and
the development was halted.
53
3.24 Graded Reference model
Graded reference model is a graphical decision support model - Java based desktop application
created in CoCoViLa. It provides accurate solution to the problem of calculating efficiency and
mitigation rates (security levels) based on business security levels/potential monetary losses
(Kotkas, 2011).
In the reference model we are looking for security level/effectiveness – IT effectiveness logic is
that it does one certain thing and only that thing what is needed. Measured by the CIA
"availability" probability.
Efficiency security level sufficient levels can be broadly divided as follows:
•
~0.9 = sufficent efficiency level for a small company
•
~0.95-0.98 = sufficent efficiency level for medium sized company (university)
•
~0.995 = sufficent for banks, CSP-s, insurance companies, governemnt agencies etc.
The results are quantitative, not qualitative as most similar solutions. Model gives concrete
efficiency, mitigation rate, potential annual losses etc. rates. Mostly standards like ISO, ISKE, NIST
etc. are used for the same purpose, and they give only qualitative results. Implementing audit type
of practise based on standards will take tens of thousands of man hours – depending on the size
and complexity of the company.
The reference model is created based on expert opinions (E=efficiency) and cost. The reference
model gives quantitative figures for comparison and is easily optimized for better security
standing.
The reference model was created on 3 basic ideas:
•
A Structured Approach to Computer Security (Tomas Olovsson)
•
CyberProtect – Uses actual effectiveness ratios for certain information security activities area
levels. (Figure 1.20)
•
IT as Business Process & System Reliability (Availability) Theory - IT as Business Process &
System Reliability (Availability) Theory - Based on the simplest version of business process
model “People-Process-Technology//Governance” has been modified to suit IT sector as
People-Software-Hardware//Governance”. IT Security activities are supporting-parallel to IT
activities (P, SW, HW, G) –multilevel security (Figure 1.21).
User can define multiple levels of confidence and cost. Other parameters and levels can be defined
but the model’s algorithm will base all calculation of level of confidence of the overall system and
specific security measure (Kirt, 2010).
Olovsson(1992) describes basic security function where the total cost of security is based on the
total security investment plus the damage and cost of recovery from security incident. This
function can be used to find the optimal level of security and cost.
54
Figure 3. 19 – Olovsson (1992) Optimal level of security and cost
Some things to note about the model:
A reference model is abstract. Things described by a reference model are not actual things, but an
abstract representation of things.
A reference model contains both entities (things that exist) and relationships (how they interact
with one another). A list of entities, by itself, is not sufficient to describe a reference model.
A reference model does not attempt to describe "all things." A reference model is used to clarify
"things within an environment" or a problem space. To be useful, a reference model should
include a clear description of the problem that it solves, and the concerns of the stakeholders who
need to see the problem get solved.
A reference model is not useful if it makes assumptions about the technology or platforms in place
in a particular computing environment. A reference model is a mechanism for understanding the
problems faced, not the solutions involved, and as such, must be independent of the selected
solutions to provide value to the practitioner. Note: That does not preclude the development of a
reference model that describes a set of software applications, because the problem space may be
"how to manage a set of software applications." (Kivimaa, 2013).
Reference Model –
• The things described by a reference model are not very concrete actual things, but an
abstract representation of security activities areas.
• Contains entities and relationships - a reference model contains both entities (things that
exist) and relationships (how they interact with one another). A list of entities, by itself, is
not sufficient to describe a reference model.
• Clear description of the problem that it solves - the concerns of the stakeholders who need
to see the problem get solved.
• Mechanism for understanding the problems faced, not the solutions involved, and as such,
must be independent of the selected solutions to provide value to the practitioner.
55
Figure 3. 20– Modified business process model (Kivimaa, 2017).
In the model we have redundant security areas and if one fails, they all fail. That is not normally
the case in real life as in reality even relevant security measures are different and one failing would
not cause all the rest to fail. In IT normally one security activity supports another and in that case
we don’t have full redundancy and we need to use Redundancy Coefficient (Rq). Rq will ensure we
can consider the relevant security areas and the level of support the security areas provide to
Relevant areas.
Figure 3. 21– Example of relevant coefficient (Kivimaa, 2017)
56
3.3 Existing models
The existing models’ section will give a general overview of 3 programs that have been helpful
tools in developing the graded security reference model.
There are multiple standards and interactive models created to assist IT security personnel
manage the IT security infrastructure. I have seen as an IT auditor that none of them actually are
one size fits all solutions and they all are either very simplified solutions that don’t actually work as
intended, or they are extremely expensive and time consuming to implement.
Well known risk management tools are - FSR-Manager Tool, Strategic Thought and RiskNav. They
are all very hard to use and are extremely expensive.
Many smaller programs utilize Microsoft Excel or Access based customized risk management tools
and those are very tedious to use and hard to understand.
3.31 GSTool
GSTool was developed by The Federal Office for Information Security - German Upper- level
Federal agency in charge of managing computer and communication security for the German
government (Kivimaa, 2017). The model has improved a lot, but still resembles an Excel sheet type
of an environment and is ridiculously hard to understand and even harder to learn to use.
It is composed of the following security measures - computer applications, critical
infrastructure, Internet security, cryptography, counter eavesdropping, and security
accreditations (BSI, 2004)
From GSTool I learned their approach to IT Baseline Protection Catalogs - personnel,
organizational, technical, and infrastructural security measures. BSI also includes
probability and potential damage, implementation costs, but like in my reference
model – they all are expert opinions, so we can assume +-20% error margin. GSTool
tries to avoid costly security analyses by experts (Kouns and Minoli, 2011).
Figure 3. 22 – GSTool IT assets (BIS, 2004)
57
Figure 3. 23 – GSTool IT resources list (BIS, 2004)
Figure 3. 24 – GSTool Excel example (BIS, 2004)
58
Figure 3. 25 -GSTool Object Model (BIS, 2004)
59
Figure 3. 26– GSTool Safeguards (BIS, 2004)
Figure 3. 27 - GSTool Tab cards/Modules (BIS, 2004)
GSTool was chosen as an example mainly because Estonian ISKE standard is based on German BSI
and it was a good and familiar reference point for security measures for the university, where the
model was implemented. BIS and ISKE standards are mandatory for Estonian government agencies
and the GSTool itself is very expensive, so it is unavailable for most medium sized companies.
University had tried previously to implement the full GSTool model as a program but found it too
time-consuming and complicated. They had based their security on manual selection of security
measures chosen from the BSI/ISKE. It can still be stated that the GSTool is perfect reference to
implement security measures.
60
3.32 CyberProtect
CyberProtect was created with the sponsorship from the U.S Assistant Secretary of Defense as a
Information Assurance game to implement countermeasures in a local area network. The game
has a span of 1 year (4 quarters) and user can purchase software and hardware to defend against
simulated attacks. User makes decisions what security measures to implement and then sets the
simulation in motion to see if the measures were adequate (
Ottis, R., 2014).
The amount of attacks varies and is initiated from outside and inside of the company. The game
uses three levels of security based on CIA – Confidentiality, Integrity and Availability. That gave me
an idea to also implement levels in my reference model – 4 levels in reference model case. I do
think that perhaps 5-6 levels would be more suitable for CSP-s, banks, insurance companies etc.
(CyberProtect, 2011).
For closer look at the games possibilities, I would recommend to watch the following video -
https://www.youtube.com/watch?v=gFORT37n7dg&ab_channel=ScottStokely
Figure 3. 28 - CyberProtect Infrastructure layout (CyberProtect, 2011)
61
Figure 3. 29 - CyberProtect Tools Catalogue (CyberProtect, 2011)
It can be stated that the main idea for the model came from CyberProtect as it implemented
multilevel security, but it was lacking the underlying algorithms for proper security level
calculations. That created a situation when creating my own model was necessary.
3.33 CyberCIEGE
CyberCIEGE is another security orientated game that focuses on Information assurance. It was
created by U.S. Naval Postgraduate School and Rivermind Inc.
User must buy and configure computer and network devices. At the same time the users cannot be
inconvenienced too much and still protecting assets from attacks. CyberCIEGE is resource
management, Information Assurance (IA) teaching and learning lab.
The game was developed in C++ and has variety of elements – simulation engine, scenario
development tool, scenario definition language and video enhanced encyclopedia.
In the game user has to manage and configure servers, workstations, access control lists, operating
systems, access control policies etc. using PKI (Public Key Infrastructure) based encryption, VPN
(Virtual Private Network), firewalls, VPN Gateways, VPN clients, routers, switches, link encryptions,
anti-virus, authentication servers etc. (CyberCIEGE, 2021).
The game has thousands of scenarios and using a Scenario Development Tookit, user can create
and submit new scenarios (CyberCIEGE, 2013).
Derived from the game was the concept of Risk=Threat x Vulnerability.
62
Figure 3. 30– CyberCIEGE layout (CyberCIEGE, 2013)
Figure 3. 31 – CyberCIEGE Scenario Definition Tool (CyberCIEGE, 2013)
63
CyberCIEGE was selected based on a impression that it actually is an improvement from
CyberSiege and implements underlying algorithms. That assumption was proven wrong, and they
don’t use any algorithms. It is still unclear how they do their calculations (just like CyberSiege) and
create risk calculations.
3.4 Insurance
Cyber insurance has become more prominent after implementation of GDPR (Global Data
Protection Regulation) in May 2018. Data breaches are a fact of life and basically only way to
mitigate the after-effects is transfer of risk by purchasing cyber insurance (Latham & Watkins,
2014)
Cyber insurance is the transfer of financial risk associated with any IT incidents to a
third party. It is more than a traditional business interruption and crime insurances
(although the line is still vague) by covering liability issues, property loss and theft,
data damage, loss of income from an outage and computer failures, or website
defacements (Meland, Tondel and Solhaug, 2015).
In some percpective customer is actually is gaining an ally as insurance companies want to limit the
payouts and can assist customers with in-depht knowledge if CSP security measures and also
provide general advice in securing customers infrastructure. Currently, the cyber insurance market
is not well developed (X Zhao, et al., 2009). There are only a small number of insurance companies
offering cyber insurance products, and thus they are likely to make positive profits.
Especially smaller businesses notoriously have issues implementing (and
documenting) security policies and best practices that would ultimately avail them to
better premiums. Even if on-site policies are implemented, then cyber
security policies are still missing standardized form, content, and vocabulary (Meland
et al, 2015). Cyber insurance policies cover both 1st and 3rd party losses suffered due
to a breach, but the scope of coverage is increasingly refined and can cover a variety of
risk scenarios depending on the insurance type (Latham et al, 2014). Insurance
company must review and audit the customers security solutions beforehand,
otherwise it could be like insuring a house, that is already on fire.
Insurance companies provide risk management and post-breach services - including loss-
prevention measures and remediation tools.
They are lacking a functioning security model that is easy and fast to implement and
also includes the financial side, which I’m proposing in this thesis.
There are multiple complicated ways to calculate cyber security premiums. Martinelli
and Yautsiukhin (2016) offer a simpler method, but in this thesis I will concentrate on
a simple probability theory - Probable Annual Losses=ALmax/mR.
The issue I’m facing is that I can’t be exactly sure, how the actual breach probability
and premiums are calculated in insurance companies as that is well kept secret. I can
only assume that insurance premiums are calculated based on historical breach data -
probability of occurrence and financial loss.
64
Record numbers of data breaches and potentially very high fines from GDPR (Global
Data Protection Regulation) have driven large organizations to increase spending on
security at twice the rate of other information technology during the past several
years, according to Gartner, IDC (Independent Directors Council) and others that
predict growth of between 4.7 percent and 9.9 percent during the next five to seven
years. (Filkins, 2016).
It is quite complicated to prove/assume how much the loss would be and that they
directly resulted from a cyber-attack as attackers are trying to remove the evidence
that the attack ever occurred.
Predicting risks is very hard as we are lacking information for retrospective analysis,
and it presents a challenge. The data simply does not exist to develop the models to
calculate risk and set rates for predictable losses and exposure.
Measuring cyber risk requires understanding how ALL the business assets are impacted
by a cyber-attack. Assets must be prioritized. It is quite hard to estimate sufficient
spending’s on IT security and there my reference model will be extremely helpful.
Zhao et al (2009) states that employment of a cyber insurance can somewhat resolve
the overinvestment issue by reducing the investment, when the underinvestment
issue becomes more severe. Even if the positive externality is more problematic since
it will cause higher security risks (less IT security investment and higher total risk),
cyber insurance cannot solve this problem. The following figure illustrates how the
adoption of a cyber insurance can affects companies’ information security
investments.
Figure 1. 6– Effect of adoption of Cyber Insurance on the level of IT security investment (Filks, 2016).
For a company to get cyber insurance, they are required to conduct a full financial
audit and full information technology audit. Visibility into the risk exposure in euros
and cents provides the cyber insurance companies competitive advantages that allow
65
them to realize good cyber security drivers. Like stated by Skroupa (2017) - risk
metrics demonstrate how much cyber insurance is really needed.
For a company, acquiring a cyber insurance is a lengthy process internally and could
involve almost every department of the business.
As the cyber-attacks have increased exponentially during the late popularity of
working from home due to corona virus epidemic, a lot od cyber insurance firms have
started to implement harsher regulation to their policies. This could mean that
shifting companies’ cyber-risk to insurers may be coming to an end. For example,
global insurance carrier AXA has stopped covering ransomware reimbursements as
part of their cyber insurance offering in France – other countries will follow (Lemon,
2021). The severity of the ransomware attacks was also proven by AXA-s Asian offices
itself being targeted a week after their announcement about ransomware.
In the United States cyber insurance premiums increased by 22% in 2020 – to almost
$3 billion. But profits for cyber insurance also narrowed - direct loss ratio (the fraction
of policy revenues paid out for claims) rose to 73% (Lemon, 2021).
3.5 Graded Security Reference Model
GSRM (Graded Security Reference Model) is based on 4 basic ideas:
1.
Structured Approach to Computer Security – Tomas Olovsson (1992)
2.
CyberProtect – security model
3.
IT as a Business Process & System Reliability (Availability) Theory
4.
Graded Security Approach – Risk Response Strategies (Accept, Avoid, transfer, Mitigate)
Structured Approach to Computer Security and
System Reliability (Availability) Theory & IT as
Business Process is derived from Olovsson business model:
People-Processes- Technology/Governance.
Figure 3. 32 – Trusted Information Sharing Network (TISN, 2020)
For it to be more suitable to IT field, it has been modified to People-Hardware-
Software/Governance.
66
Figure 3. 33 – TISN model modified from IT (TISN, 2020).
Minimal Expected Total Cost = Security Costs (Capex + Opex) + expected Security Losses.
Capex – Capital Expenditure
Opex - Operating Expenditure
Figure 3. 34 – Typical dependency of losses and security expenses of security level (Kivimaa, 2017).
In the above figure 3.23 we can see how to interpret the graphs produced by the model.
Implementer can see a broad overview on the graph based on cost and security level. Implementer
will select the expenses (cost) that their budget will allow for and will see the corresponding
security level to that allocated amount of money. It is possible to zoom in on the graph for more
closer view, but it is recommended to use the java console as there is visible all the security levels,
costs and efficiency percentage for the financial bracket selected by the implementor of the
model.
In GSRM the IT Security activities are (presented) supporting-parallel to IT activities (People,
Software, Hardware and Governance) – so called multilevel security, as seen below in Figure 3.32.
67
Figure 3. 35 – Serial and parallel IT activities. (Kivimaa, 2017).
CyberProtect is information security educational tool/interactive game, created by U.S. Military
Academy. CyberProtect provided
concept
of using E (effectivness) grading as Low, Medium, High
security rankings. It provided a suitable concept of actual effectiveness ratios for certain
information security domains / measure-groups / security activities areas.
I have concluded that effectiveness of the security measures can be interpreted as
security level.
From experimentation a generalisation can be made – 0.9 is quite low effectiveness but is secure
enough for smaller companies; 0.97-0.98 is safe enough for medium sized enterprises and starting
from 0.995 is suitable effectiveness/security level for banks, insurance companies and of course
CSP-s (Cloud Service Providers).
In GSR graph structure, relevant measure groups at the edges of the graph, connecting the circular
nodes and represented as red boxes. The nodes (serial) are fully reliable (E=1). The green boxes,
connected to the relevant measure groups, represent the supporting security measures. To
achieve fully redundant security activities the principle is:” as long as not all of the supporting
system components fail, the entire system is safe” (Kivimaa, 2017).
Figure 3. 36 – CyberProtect CyberProtect, 2011)
68
Figure 3. 37– Security level priorities
Above Figure 3.34 will be created by the client IT security team. It will indicate on which level their
specific security measures are based on expert opinion from the security team. I have divided the
levels into four different categories:
•
Adequate
•
Not adequate
•
Needs to be achieved in near future
•
Must be achieved ASAP
This type of security level priorities table is extremely useful to IT staff and perhaps even more
suitable for the stakeholders. Stakeholders can easily look at the overall table without going
to details and see how much adequate and critical sections are there. This will help the IT security
department to justify extra finance required to improve the security posture of the company.
The security measures on the table are exactly in the same order as security measures on the list
on
the left side of the model’s main screen.
Security team can correlate the Current MG Levels to required MG Levels from the model for next
year to the table and it makes extremely easy to present to the board.
Current MG Levels: [1, 1, 1, 2, 2, 1, 0, 1, 1, 2, 1, 1, 2, 1, 2, 2, 1, 1, 1, 2, 2, 2, 1, 1, 1, 1, 0, 1, 1, 1, 1, 2]
Required MG Levels: [1, 1, 1, 2, 2, 1, 0, 1, 1, 2, 1, 1, 2, 1, 2, 2, 1, 1, 1, 2, 2, 2, 1, 1, 1, 1, 0, 1, 1, 1, 1, 2]
It is quite clear to them if the Current MG Levels have much redder than the Required MG Level for
next year – there is strong case to increase the security budget.
69
70
Figure 3. 38 – Graded Security Model University security model in CoCoViLa
Figure 3. 39 – Graded Security models graphical outcome example (Kivimaa, 2017
71
4. CHAPTER – UNIVERSITY ANALYSIS AND EVALUATION
4.1 University on-prem standing
All security measures presented here are expert opinion from university IT and IT Security staff.
We concluded that expert opinion is in a good about +-20% of total truth. We also agreed that we
can consider the Effectiveness of their security measures as Security Confidence (Security level).
An Information Security Expert is a smart person working in the field of Information Security, who
has the relevant education and who has successfully worked as an Information Security Specialist
or in IT Information Security Management for minimum of 5-10 years.
Figure 4. 1 - Information Technology structure in a university (university data protection document).
University has divided their primary information security measures into 32 security activity areas:
1.
IT Governance
- IT quality - fiduciary & security management.
- IT Sec Internal and External Audit.
- C&BCM (Crisis and Business Continuity Management).
72
2.
IT Management
-
IT Sec - Strategy (what-why/how/who), Cloud, PDCA (Plan-Do-Check-Act) and OODA (Observe-
Orient-Decide-Act).
-
IT/Cloud Asset Management and SLA's (Service Level Agreement).
-
SW Development - taking Cloud specifics into consideration.
-
Optimal IT and IT Sec Costs.
-
IT Systems Recovery Plan.
3.
IT Risk & Problem Management (ITR&PM)
- Problems/Incidents Management and Analyze.
- External Regulations.
- Compliance to Internal Principles.
- Audit Capability.
4.
Security Documentation
- IT Sec Strategy (what/why/how/who) - Mobile and Cloud strategy.
- IT Asset Management and SLAs.
- IT Roadmap - vision, action plan- how, who.
- Possession procedures- Info/SW/ITS (Information Technology Security)-HW administration and
selecting person responsible.
5.
IT Human Resource Management
6.
Personnel Workplace Equipment
7. Personnel Workplace Equipment -
- Mobile, BYOD (Bring your own device), no training needed – money saving.
8.
"People Awareness & Training
- End-Users ITSec Training.
- Management ITSec Training.
- HW (servers & network) experts/admins ITSec Training – added 10% IT and IT Security Opex.
- SW developers/admins ITSec Training.
9.
Physical Security
- Environment, Documents and Lab Equipment Physical Security.
- Perimeter and People things Physical Security.
- IT Equipment Physical Security.
- Key-Persons Physical Security.
10.
Servers Room (SR)
- (On-premise 90%, 10% Cloud)
Including costs for:
- SR building cost (amort ~50 a?).
- Power.
- UPS (Uninterruptible power supply), Generator.
- Cooling.
- Fire extinguishing system (gas).
- Physical security.
- EMP (Electromagnetic pulse)/EMI (Electromagnetic interference) defence.
73
11.
IT Systems SW
- Self-developed Software.
- Suitable for Cloud and cloud specific.
12.
IT Systems SW
- Purchased Software (collaboration and remote access) – SaaS (Software as a Service), PaaS
(Platform as a Service) (Office 365 incl. email, Moodle).
- Support is purchased according to specific system requirements
13. IT Systems SW
-
ÕIS, Navi and web, Doc administration - small developments themselves, larger
-
Outsourced SW development (incl. 3rd parties support) – testing etc.
14.
INFO
- C and A IT, I business information handlers
- Information Accuracy, Completeness, Validity, And Authenticity, Traceability, Accessibility.
15. IT Systems Servers
16.
Network
- Three networks - Ethernet, Wi-Fi, Public Internet
- speed De Facto 1 Gbit/s
17.
Access Rights Management
- 1. who and 2. How - Ethernet, Remote Access, Wi-Fi, Internet
- PWS -PCs, mobiles, BYOD
- IT Systems
- Authentication – internal user-password, external - ID-card
- Admin rights management
18. Network Access Control
- LAN/Internet
19.
PC Security
- PCs Secure Configuration
- PC Upgrades and Patches
20.
Mobiles Security
- Two profiles - user and guest, WiFi and Internet
- Mobile Devices Secure Configuration
21.
Servers Security (including IaaS servers)
- Secure Configuration
- Upgrades and Patches
22.
"Network security
- Four Networks - Ethernet, Wi-Fi, Remote Access, Internet
- DMZ, FW, IDS/IPS
- Upgrades and Patches
74
23.
Software Security
- SW testing and SW Security-testing
- Upgrades and Patches
- Suitable for cloud
24.
Malware Handling
-
Analysis and Solutions
25.
Encryption
- Information exchange policies and procedures
26.
Data Backup and Restoration
27.
Data Archiving and Recovery
- info/SW
- logs
1. Not needed – archives on paper
2. Digital archive (ensuring Availability)
3. Deleting archived information from real-time systems - to prevent performance degradation of
real-time systems
28.
Audit Trail & Monitoring
- Security Situation Reports – no attacks, attack and what breached, security incident
- How long the logs are retained?
29.
HelpDesk
30.
IT Security Awareness
- Vulnerabilities Testing
- Penetration Testing
- Forensics
31.
Business Continuity and Crisis Management
32.
IT Systems Recovery
Below is the extract of data from the university that they allowed to be used for this thesis.
75
Figure 4. 2 - Current IT and IT Sec Activities. Levels achieved and to be achieved: color-coded (current research
Closer
view).
Above figure 4.2 is a guideline created by the IT security staff, but it will be a broad overview (without
going into detailed security measures) for the stakeholders. They do not care about detailed security
measures, but this table will provide them an overview of the current state of the security measures –
mainly how much red is on the table. That is a good argument for an IT Security budget increase.
76
Figure 4. 3.– Example of Current IT and IT Sec Activities. Levels achieved and to be achieved: color-coded
•
Blue figures are current and not adequate security measures.
•
Green is current and considered adequate.
•
Yellow ones are levels to be achieved in the near future.
•
Red are levels that has to be achieves as soon as possible
Figure 4. 4– Redundancy Coefficient expert opinions example
Interpretation of the figures above on Figure. 4.4. -
Supporting activities in IT security are typically improving just one aspect of the supported relevant
component (for example, relevant Software and supporting Logging/Monitoring). In such cases we do
not have full redundancy and we must introduce the Redundancy Coefficient (RC) like shown in Figure
4.5.
It ensures that we can separately consider the effectiveness of Relevant and Supporting measures and
the level of support that the Supporting areas provide to the Relevant areas (Kivimaa, 2013).
Rc Level1. Not Needed (the IT Sec would appreciate it) = 0
Rc Level2. Needed (the IT Sec would appreciate it) = 0,2
Rc Level3. Important (the ITSec does not want to be without it) = 0,5
Rc Level4. Mandatory (the IT Sec cannot do without it) = 0,8
77
Figure 4. 5- Current IT Security Activities areas, levels achieved and to be achieved: color-coded
78
Figure 4. 6- Capex and Opex value example for Reference Activities levels 0 a
nd 1 (current reserch closer view)
Figure 4.6 shows just a small part of the entire Opex (Operational expense) and Capex (Capital
expense) list – in this case training part, education, licenses, support, business strips etc. It shows in
detail how many hours has been planned for certain type of training and the exact cost for it. This is
just small part of the entire budget for IT Security team. Capex expenses are mostly for the hardware
and Opex are for employees’ salaries, training cost, software licenses, utilities etc.
79
Link to Excel file for Figures 4.2 – 4.6 to see them in full -
https://drive.google.com/drive/folders/1rdeTBA_siYXgbfU_Yb3F7Rs2sAs9xx0r?usp=sharing
4.2 Implementation
In the university all the security areas have been assessed – from hardware to software. Financial
spending on security areas have been added to the reference model.
Existing (Initial Level Requirement - iLvReq) and required security area levels (Initial Level Situation
- iLvSit) have been specified in the model. Corresponding existing security levels and required
levels can be seen next to the security areas in the model (Figure 4.7 and Figure 4.8).
Figure 4. 5 - Security levels and required levels (Kivimaa, 2017)
Figure 4. 6 - Security levels and required levels modification (Kivimaa, 2017)
80
The required level has been intentionally left same as initial level as then the models algorithm
provides all the possible variation.
Figure 4. 7 – Full university reference model overvi
ew (current research closer view) 81
Figure 4. 8 - Minimal and Maximal Budget + maximum Annual Losses
Above on Figure 4.10 we can see that the minimal budget is set to 3,084,100 euros and maximum
budget is set to 6,000,000 euros. We can also see that the maximum annual losses are set to
10,000,000 euros. The calculations is done for the year 1 which in many cases can also include
buying hardware but not in university’s case.
4.3 Evaluation
Because Capex spending has been done before our valuation the valuation starts from current IT
security standing. Current security situation is as follows –
Initializing Evolutionary Algorithm ... Budget = 3084.1 ... done HETKESEIS
[1, 1, 1, 2, 2, 1, 0, 1, 1, 2, 1, 1, 2, 1, 2, 2, 1, 1, 1, 2, 2, 2, 1, 1, 1, 1, 0, 1, 1, 1, 1, 2]
0.8957114189554748
I have added relevant level ”1” to budget as there are expenses included when starting from
square one (computers, servers, software etc.).
Current MG Levels: [1, 1, 1, 2, 2, 1, 0, 1, 1, 2, 1, 1, 2, 1, 2, 2, 1, 1, 1, 2, 2, 2, 1, 1, 1, 1, 0, 1, 1, 1, 1, 2]
Required MG Levels: [1, 1, 1, 2, 2, 1, 0, 1, 1, 2, 1, 1, 2, 1, 2, 2, 1, 1, 1, 2, 2, 2, 1, 1, 1, 1, 0, 1, 1, 1, 1, 2]
82
We can see from Figures 4.11 that the optimal budget is around 3,275 (3,275,000 euros) – after
that the dL/dB is constantly below 1. If the figure is below 1 then it means that you are spending
more on defence than the value of the protected asset.
Exp Total Costs = IT Costs + Exp IT Losses
Optimum ja buget--- summary is main tomark
Figure 4. 9 - Magnified Exp Total Costs = IT Costs + Exp IT Losses
83
Above in Figures 4.12 and 4.13 we can see that the losses do not diminish significantly after
3274,1, so the previous reasonable spending of 3275 is reasonable. Exact optimum is B=3274,1.
Figure 4. 10 – Magnified Total Cost, Efficiency and Budget
TC = f(B)
TC = f(E)
L =ALE (1-E)
We can see that optimal total cost to achieve 0.971 efficiency is 3275 like also proven by previous
calculation screenshots. The expert opinion for ALE of the university security specialist is 10 million
euros. Optimal efficiency is E=0,971.
Figure 4. 11 – Effectiveness and Mitigation Rate
84
We can see above that optimal mitigation rate is around 33,934 mR = 33,934. Optimal would
decrease the losses 34 times. Maximum mitigation rate is 850. Much of losses are decreased but
that very minimal effect on the effectiveness (of the security measures) and significant increase on
the budget.
We can see on Figure 4.13 that efficiency reaches almost 1 around 3275 which falls into our
optimal security areas range.
The results were viewed by the IT security experts in the university and compared to last year’s
statistics and were deemed very realistic and the model was accepted. They have acknowledged
that their security infrastructure had flaws, that were discovered by the model’s implementation
(not sufficient mobile phone security for example). At this point their security budget is 3.08
million euros per year (like seen on Figures 4.16 and 4.17) – now they know to have security
Efficiency of 0.97, they need additional 195,000 euros.
Maximum security profile cost and effectiveness is –
Initializing Evolutionary Algorithm ... Budget = 5994.1 ... done
[3, 3, 3, 2, 3, 2, 2, 2, 2, 2, 3, 2, 3, 2, 3, 3, 3, 3, 3, 3, 3, 2, 2, 3, 2, 2, 2, 3, 3, 3, 2, 3]
0.9988011614715445
Optimal is –
Initializing Evolutionary Algorithm ... Budget = 3274.1 ... done
[1, 2, 1, 2, 2, 1, 1, 1, 1, 2, 1, 1, 2, 2, 2, 2, 2, 1, 2, 2, 2, 2, 1, 1, 1, 2, 1, 2, 1, 1, 2, 2]
0.9705308844814413
Above we see the optimal security profile for our security areas and can see that the effectiveness
is 0.97 - 0.98 which is suitable for a medium sized business - like university.
Like we can see the reference model suggest the increase the security level by 1 level in the
following security areas:
•
IT Management
•
Mobile Security
•
On-prem IT Servers
•
IT Risk and Problem Management
•
Security Documentation and IT Strategy + Asset Management
•
Awareness training
•
Data backup and Restoration
•
Logging-Monitoring
•
IT Security Awareness
•
IT System Recovery
Current State -
[1, 1, 1, 2, 2, 1, 0, 1, 1, 2, 1, 1, 2, 1, 2, 2, 1, 1, 1, 2, 2, 2, 1, 1, 1, 1, 0, 1, 1, 1, 1, 2]
Budget= 3084,1 Efficiency= 0.8957
85
Optimal State –
[ 1, 2, 1, 2, 2, 1, 1, 1, 1, 2, 1, 1, 2, 2, 2, 2, 2, 1, 2, 2, 2, 2, 1, 1, 1, 2, 1, 2, 1, 1, 2, 2]
Budget= 3274.1
Effectiveness= 0.9705
5. CHAPTER – CSP ANALYSIS JA EVALUATION
5.1 CSP Security measures
Control automation is a way for CSP to reduce human intervention in recurring processes
comprising the control environment. It is effective information security control that manages risks.
It seeks to proactively minimize potential inconsistencies in process execution.
Through control automation many process deviations are eliminated. This increases levels of
assurance that a control will be applied as intended.
Examples of automated controls include (Amazon, 2020):
• Governance and Oversight: Policy versioning and approval.
• Personnel Management: Automated training delivery, rapid employee
Termination
• Development and Configuration Management: Code deployment pipelines,
code scanning, code backup, integrated deployment testing.
• Identity and Access Management: Automated segregation of duties, access
reviews, permissions management.
• Monitoring and Logging: Automated log collection and correlation, alarming.
• Physical Security: Automated processes related to AWS data centers, including
hardware management, data center security training, access alarming, and physical access
management.
• Scanning and Patch Management: Automated vulnerability scanning, patch
management, and deployment.
The incomprehensive list of CSP Security measures (Amazon,2020):
Physical and Environmental Security
Most data centers secure and innovative architecture. Data centers are housed in facilities that are
not branded, so they are hard to recognize. Physical access is strictly controlled at the perimeter
and at building entrance points by security guards. They are utilizing video surveillance,
motion detection systems, motion activated lighting and other electronic means.
Staff must pass two-factor authentication a minimum of two times to access
data center floors.
When a member of staff no longer has a business need for for access - access is immediately
revoked. All physical access is logged and audited.
86
Fire Detection and Suppression
Automatic fire detection and suppression equipment has been installed. It utilizes smoke detection
sensors in all rooms. Areas are protected by either wet-pipe, double interlocked pre-action, or
gaseous sprinkle systems.
Power
The power systems are fully redundant and maintainable without impact to operations, 24 hours a
day, and seven days a week. Uninterruptible Power Supply (UPS) units provide back-up power in
the event of an electrical failure for critical and essential servers. Generators provide back-up
power for all other services and facilities.
Climate and Temperature
Climate control is maintaining a constant temperature for server-rooms.
Temperature control systems monitor and control temperature and humidity at
appropriate levels.
Management
Electrical, mechanical, and life support systems and equipment are constantly monitored -
any issues are immediately identified. Preventative actions can be taken immediately.
Storage Device Decommissioning
Storage device, that has reached the end of life, will be decommissioned.
Techniques detailed in NIST 800-88 (“Guidelines for Media Sanitization”) will be used.
Business Continuity Management
Infrastructure has a high level of availability and provides a resilient IT architecture. Systems has
been designed to tolerate system or hardware failures with minimal impact.
Availability
Uninterruptable power supply (UPS) and onsite backup generation facilities are in place - they are
each powered via separate power grids from independent utilities provider to reduce single points
of failure.
Multiple locations (multiple data centers) provide the ability to remain operational in the face of
most failures - including natural disasters or any system failures.
Incident Response
Making use of industry-standard diagnostic procedures to resolve business-impacting events. Staff
provides 24x7x365 coverage to detect incidents and to manage the impact and resolution.
Executive Review
Internal Audit reviews services resiliency plans and performs security Audits.
87
Network Security
Network has been architected to allow you to select the level of security and resiliency appropriate
for your workload. Network infrastructure that is carefully monitored and managed.
Network Architecture
Network devices (firewall, switches, routers and other devices) are in place to monitor
and control communications at the external boundary of the network. Internal
boundaries within the network are similarly monitored.
Rule sets, access control lists (ACL), traffic flow policies and various configurations are used to
protect
information system services.
Secure Access Points
Strategically placed and limited number of access points to the cloud to are placed for enhance
monitoring of inbound and outbound communications and network traffic.
Network devices are dedicated for managing interfacing communications with Internet service
providers (ISPs). There is a redundant connection to more than one communication service at each
Internet-facing network. Each of the connections have dedicated network devices.
Transmission Protection
You can connect to an access point via HTTP or HTTPS using Secure Sockets
Layer (SSL), preventing eavesdropping, tampering, and message forgery.
For additional layers of network security Virtual Private Cloud (VPC) is used - it provides a private
subnet within the cloud, and the ability to use an IPsec Virtual Private Network (VPN) device to
provide an encrypted tunnel between the VPC and your data center.
Security
Segregation
Logically, the production network is segregated from the corporate network by set of network
security / segregation devices. Administrators who must access cloud components must request
access. All requests are reviewed and approved by the service owner.
Personnel then connect through a bastion host that restricts access to network devices and other
cloud components, logging all activity for security review. Bastion hosts access requires SSH public-
key authentication from all user accounts on the host.
Fault-Tolerant Design
Infrastructure must have a high level of availability and provide the capability to deploy a resilient
IT architecture. It must endure system or hardware failures with minimal customer impact.
It is achieved by using clusters in various places in the globe. Core applications are deployed
in an N+1 configuration - in the event of a data center failure, there is sufficient capacity to enable
traffic to be load-balanced to the remaining clusters.
88
Data Centers are physically separated and are in lower risk areas.
Uninterruptable power supply (UPS) and onsite backup are utilized, and they are each fed via
different grids from independent utilities (power, Internet etc.).
They must remain resilient to most failure scenarios, including natural disasters or system failures.
Network Monitoring and Protection
Variety of automated monitoring systems are used to provide a high-level overview of service
performance and availability. Tools used are designed to detect unusual or unauthorized activities.
Tools monitor server and network usage, port scans, application usage, and intrusion attempts.
Alarms are set to automatically notify responsible employees when early warning thresholds are
crossed.
Documentation is maintained on every incident or issue.
Access
As network is segregated, it requires a separate set of credentials for logical access. Network relies
on user IDs, passwords, and Kerberos authentication. Production network requires SSH public-key
authentication through a bastion host.
Account Review and Audit
Accounts are reviewed every 90 days. Access is automatically revoked when an
Employee’s contract is terminated. Windows and UNIX accounts are disabled and permission
management system removes the user from all systems.
Background Checks
Formal policies and procedures, as permitted by law, are part of pre- employment screening
practices for employees. Future employees criminal record and educational background will be
verified.
Credentials Policy
Credentials policy with required configurations, expiration intervals and forced passwords changes
(complexity) every 90 days are enforced.
Secure Design Principles
The AWS development process follows secure software development best practices,
which include formal design reviews by the AWS Security Team, threat modeling, and
completion of a risk assessment. Static code analysis tools are run as a part of the
standard build process, and all deployed software undergoes recurring penetration
testing performed by carefully selected industry experts. Our security risk assessment
reviews begin during the design phase and the engagement lasts through launch to
ongoing operations.
Change Management
Routine, emergency, and configuration changes to existing AWS infrastructure are
authorized, logged, tested, approved, and documented in accordance with industry
89
norms for similar systems. Updates to the AWS infrastructure are done to minimize any
impact on the customer and their use of the services. AWS will communicate with
customers, either via email, or through the AWS Service Health Dashboard when
service use is likely to be adversely affected.
Software
Systematic approach to managing change so that changes to customer impacting services are
thoroughly reviewed, tested, approved, and well-communicated.
Change management process is designed to avoid service disruptions.
Changes are implemented in 3 steps:
• Reviewed – Peer reviews.
• Tested – Changes are tested to help ensure they work as intended and do not impact any other
systems.
• Approved – All changes must be authorized.
Deployments are tested on a single system and closely monitored so impacts can be evaluated.
Multiple metrics are used to measure the health of the service.
Changes are scheduled during regular change windows. Emergency changes are done when they
are necessary.
There are also multiple extra security measures:
•
2-factor remote access VPN login.
•
Zero trust design – even employees in the office need to use VPN agent to access internal
resources.
•
Access to internal resources based on Active Directory group membership.
•
Separation of hardware (DMZ switch vs core switch, Hypervisor server vs backup server).
•
Separation of duties (VMware admin and backup admin are not the same person)
•
Access and system log monitoring.
•
Traffic between datacentres is encrypted with IPSec.
•
Backup copy is off island.
•
Data at rest is encrypted for customers who order this service.
•
Recurring pen tests.
•
Data separation is managed with vSAN.
•
VMware separates one customer’s data from another customer.
5.2 Implementation
I gathered all security measures implemented by the CSP and entered them into CoCoViLa graded
security reference model.
As I was not able to get the financial information (it would have taken too long and required
basically entire company’s involvement), I used much higher presumed security levels as university
and thus also much higher financial spending and potential losses.
Came out that in case of the smaller CSP (a fraction of the size of Amazon AWS, IBM, Alibaba
Cloud, Google and Microsoft Azure) the security measures taken on the infrastructure level differ
minimally. The difference in the model, compared to university, was removing Archiving Security
Measure, and adding SOD (Separation of Duties).
90
The main security measures are implemented through software – Cloud Provider Program. That is
convenient way to make use of all available VMware products under one contract. Service
Providers must report their monthly usage of products to VCPP Commerce Portal.
Below is a list of most implemented software solutions by CSP. At this point implementing
separate software solutions to the reference model was not practical.
Figure 5. 1 – Programs used from VMware Cloud Provider Program (Amazon, 2020)
91
Figure 5. 2 - Full CSP reference model overview
92
Figure 5. 3 – Security levels and next potential steps to increase security
Blue figures are current and not adequate security measures.
•
Green is current and considered adequate.
•
Yellow ones are levels to be achieved in the near future.
•
Red are levels that must be achieves as soon as possible.
93
Figure 5. 4 - Redundancy Coefficient figures for CSP
94
95
Figure 5. 5 - IT and IT Sec Activities
Figure 5. 6 – Minimal and Maximal Budget + maximum Annual Losses
96
Above on Figure 5.8 we can see that the minimal budget is set to 5,000,000 euros and maximum
budget is set to 7,000,000 euros. We can also see that the maximum annual losses are set to
100,000,000 euros.
5.3 Evaluation
CSP stated that they are on the level 2 on all security measures. 100 million potential ALE.
Current MG Levels: [2, 2, 2, 2, 2, 2, 2, 2, 2, 2, 2, 2, 2, 2, 2, 2, 2, 2, 2, 2, 2, 2, 2, 2, 2, 2, 2, 2, 2, 2, 2, 2]
Required MG Levels: [2, 2, 2, 2, 2, 2, 2, 2, 2, 2, 2, 2, 2, 2, 2, 2, 2, 2, 2, 2, 2, 2, 2, 2, 2, 2, 2, 2, 2, 2, 2, 2]
Current level - Initializing Evolutionary Algorithm ... Budget = 4515.0 ... done
[2, 2, 2, 2, 2, 2, 2, 2, 2, 2, 2, 2, 2, 2, 2, 2, 2, 2, 2, 2, 2, 2, 2, 2, 2, 2, 2, 2, 2, 2, 2, 2]
0.9867695509634031
Initializing Evolutionary Algorithm ... Budget = 4775.0 ... done
[3, 3, 3, 2, 3, 2, 2, 2, 2, 2, 2, 2, 2, 2, 2, 2, 2, 3, 2, 2, 2, 2, 2, 2, 2, 2, 2, 2, 2, 2, 2, 2]
0.9946874982236078
Optimal budget for this CSP is 4775.0
With the optimal budget we get
E (Efficiency) of 0.9946
The very interesting part here to note is that the recommended security level suggested to
increase the level of security on IT Governance, IT Management, Human Resource Management
and PC Security. It is logical that if Governance and Management are on bad level – all other
security areas cannot function effectively. If HR Department hires untrustworthy employees, that
again is a threat to companies’ security. PC Security - it is obvious that every computer should be
protected with antivirus, VPN, back-ups and encryption.
It has to be also noted that from customer point of view CSP-s provide us only one number for CIA
– availability. For customer to be able to make calculated choices on CSP security we also need
confidentiality and integrity efficiency figures.
97
Figure 5. 7 – Efficiency and mitigation rate
We can see on Figure 5.9 that optimal mitigation rate is around 180 mR = 180. Maximum
mitigation rate is 250 but that very minimal effect on the effectiveness (of the security measures)
and significant increase on the budget. We can see that effectiveness reaches 0.9943 at the range
of 4700 budget.
Figure 5. 8 - Total Cost, Losses and Budget and Efficiency
98
Figure 5. 9– Close-up of Total Cost, Losses and Budget and Efficiency
TC = f(B)
TC = f(E)
L =ALE (1-E)
We can see that optimal total cost to achieve 0.9945 efficiency is 4775,000 like also proven by
previous calculation screenshots. The expert opinion for ALE of the CSP is potentially 10 times
higher than universities, so 100 million euros.
Figure 5. 10 – Expected Total Cost = IT Cost + Expected IT Losses
99
Figure 5. 5 – Close-up of Expected Total Cost = IT Cost + Expected IT Losses
Above in Figures 5.10 and 5.11 we can see that the losses don’t diminish significantly after 4770, so
the previous reasonable spending of 4770 is reasonable.
Figure 5. 6 – Maximum Annual Loss Expectancy
100
We can see that from Figure 5.15 that the optimal budget is around 4750 after that the dL/dB is
constantly below 1 – meaning budget is higher than the potential financial loss.
That means that it is not financially reasonable to spend 200 euros to save data that is evaluated at
100 euros.
Budget = 4775
Efficiency =0,9946
6. CHAPTER – SUMMARY OF FINDINGS
Data was collected using Delphi Method like explained in detail in section 2.3 Data
Gathering.
It was impossible to obtain specific cost / efficiency information for the CSP. The
maximum that proved feasible was the comparison of the list of CSP information
security activities and their levels with the University's GSRM/GSES (Graded Security
Reference Model, Graded Security Expert System) model. By placing the resulting
changes in the University model, I obtained the first, very approximate, CSP models -
the CSP information security profile and the corresponding CIA security / safety
effectiveness.
Using the university model, that took over 500 man-hours to implement, as a
template for the CSP – we generated a realistic model in under 20 hours. Adding
financial information entries to the model, we can state that the model can be
implemented in around 50 hours. That proved to me, that the model is re-usable as a
template and model gets only better with more customers implementing it. Although
the result is approximate, it also indicates a possible way to obtain a more accurate
result. This, of course, requires greater co-operation with the CSP (i.e. not just based
on the knowledge / information of one employee).
Graph-based, graded security reference model was developed, which is suitable for
information security ranking, based on following ideas:
•
A Structured Approach to Computer Security.
•
Uses of effectiveness ratios for certain information security activities area levels.
•
IT as Business Process & System Reliability (Availability) Theory - based on the business
process model “People-Process-Technology/Governance” which was modified to People-
Software-Hardware/Governance”.
•
IT Security activities are supporting-parallel to IT – multilevel security.
To describe IT and IT Security as a process, there was two basic ideas:
•
If all relevant activities are at a good level, the entire system will be in good level.
•
Parallel supporting activities to relevant (serial) activities.
101
The research aim was:
• To develop a reference model using quantitative approach to calculate security
levels/efficiency, mitigation rates and optimal spending’s.
• To develop a reference model to support system IT Security team and business side to
make reasoned and optimal decisions about investments to IT security with the amount of
work which is also acceptable also to small and medium-sized companies.
• Model is sufficiently simple - information collection, optimization and analysis tasks
require 1-2 months of work instead of the detailed risk analysis, that requires 1-2 years
(like implementing ISKE/GSTool).
• Gaining metrics that are suitable for making information security decisions.
The development of the model based on quantitative approach was achieved as the experts
provided qualitative data (except the financial controller) and output was qualitative - model gives
concrete mRate, effectiveness, optimal budget, security levels etc. figures.
The first years model takes the longest – learning how and what data to gather and how to
implement it into the model. Data gathering took 440 man-hours and model implementation took
around 200 hours. For the next year we can assume that time will cut by half. The model
correlated with the expert opinion in most part and it was deemed to be very accurate by the
university security experts, that have combined security experience of 80 years.
The output of the model (the graphs and java console output) was presented to the finance
department and some members of the board in the university, and they found that information to
be easily understandable. Combined with the current IT security activities areas levels achieved
and to be achieved table (4 levels), they found the justifications for the increase of the budget for
the following year to be amply justified.
This Graded Security Reference Model is intended give benefits in the form of:
• Allows calculation of the max security confidence/efficiency levels, total IT risk/losses and
mitigation rates for any given budget
• Provides clear results in the form of graphs that can be included in executive reports and
are easily understandable.
• Provides in java a full list of most optimal security measures to any given budget.
Following actions were of this project was completed:
•
Graphical IT security reference model was created.
•
All security area activities were collected from the university.
•
All the financial IT security and IT spending information was collected from the university.
•
Limited security measures were collected from the CSP but no financial information was
retrieved
from the CSP.
•
Very limited information was received from cyber insurance provider how premiums are
calculated.
•
Security measures for CSP were 1 level higher than universities – efficiency
minimum of 0.99….
•
Universities IT security team agreed with my findings fully and agreed that the model can
be implemented in any company and on CSP side - that it would give them more
102
confidence to move certain parts of their data centre to the cloud.
•
University IT security team agreed that because of GDPR, they also should investigate
finding cyber insurance provider, but it is extremely difficult in Estonia.
I can say that the aim of this research was partially achieved. It is lacking on detailed information
from the
CSP side and Insurance agency side. It has been proved that the model is suitable for any company
and thus also would be suitable for a CSP. The four security levels proved to be sufficient (0-4) but
it does require and experts within the company who can clearly define on which level their security
posture is and what needs
to be done to increase the security levels. It was proven that expert opinions on redundancy
coefficient are important in calculating the overall security levels and it also requires specific
security expertise. The detailed financial input from the business side (unless IT department has an
independent yearly budget) is essential to have accurate optimal budget output using evolutionary
algorithm.
Main aim to make the model easy to compile and easy for non-IT people to understand was
achieved. The
model can be compiled without having any programming skills and can be assembled not-unlike a
LEGO piece.
The provided setup and cost options are easily understandable to everyone in Java console and
graphical
outputs make the wider picture easily viewable and understandable.
I have discovered that it is very hard to gain detailed information from companies (as collecting it
takes a
long time and requires expertise) and I do hope that if the model would become commercial
product, it would provide more data from different companies for comparison and perhaps would
provide an opportunity to
bring external expert to the project.
I can state that the model is deemed accurate by the university IT specialist team – assuming the
security measures, redundancy coefficient and budget data is accurate. We realised that model
does require quite
high IT skills, so it was perfect for the university and also for CSP but smaller companies probably
don’t have
the expertise. University security team considered the model accurate based on the The good part
of the
model is that it is easily modifiable, so perhaps even smaller companies IT staff could play around
with it
and try to find the correct balance.
With the university security team and the person responsible for the IT budget we worked for 6
months gathering data to input to the model. All five people dedicated 2 hours per week to the
task (40 hours a month). They spent altogether 240 hours and I spent around 300 hours
implementing data into the model.
The university’s IT budget is 3,084,100 euro and the models input matched the IT teams security
levels predictions pretty accurately – some security measures levels were swapped but all and all it
was identical.
Their security efficiency was deemed to be 0.895%.
Initializing Evolutionary Algorithm ... Budget = 3084.1 ... done
103
[1, 1, 1, 2, 2, 1, 0, 1, 1, 2, 1, 1, 2, 1, 2, 2, 1, 1, 1, 2, 2, 2, 1, 1, 1, 1, 0, 1, 1, 1, 1, 2]
0.8957114189554748
The maximum-security posture would require the budget to be almost six million euros and would
provide security efficiency of 0.998%. That is almost double the current budget and not required
by the university.
Maximum security profile cost and effectiveness is –
Initializing Evolutionary Algorithm ... Budget = 5994.1 ... done
[3, 3, 3, 2, 3, 2, 2, 2, 2, 2, 3, 2, 3, 2, 3, 3, 3, 3, 3, 3, 3, 2, 2, 3, 2, 2, 2, 3, 3, 3, 2, 3]
0.9988011614715445
I found out that the optimal security requirement for the university would be 0.97% and the
budget to achieve that level would be 3,274100 euros.
Optimal is –
Initializing Evolutionary Algorithm ... Budget = 3274.1 ... done
[1, 2, 1, 2, 2, 1, 1, 1, 1, 2, 1, 1, 2, 2, 2, 2, 2, 1, 2, 2, 2, 2, 1, 1, 1, 2, 1, 2, 1, 1, 2, 2]
0.9705308844814413
To reach the optimal level university would need to upgrade the security level to one on the
following security measures/activities:
•
IT Management
•
Mobile Security
•
On-prem IT Servers
•
IT Risk and Problem Management
•
Security Documentation and IT Strategy + Asset Management
•
Awareness training
•
Data backup and Restoration
•
Logging-Monitoring
•
IT Security Awareness
•
IT System Recovery
As I was unable to acquire the financial data from the CSP then we used the same model as for the
university with addition of Separation of Duties security measure and removing the Archiving and
Restoration
as that is handled by the customer. The main security measures on top of the university security
measures are implemented through VMware Cloud Software Platform.
Talking to CSP information security officer we agreed that all their security measures are at least
on level 2 and their potential losses are most likely 100 times higher. That information was used in
the CSP grades security reference model.
From there we have their current budget of 4.5 million euros and efficiency of 0.986%
Current level - Initializing Evolutionary Algorithm ... Budget = 4515.0 ... done
[2, 2, 2, 2, 2, 2, 2, 2, 2, 2, 2, 2, 2, 2, 2, 2, 2, 2, 2, 2, 2, 2, 2, 2, 2, 2, 2, 2, 2, 2, 2, 2]
104
0.9867695509634031
According to the model, that was deemed accurate by the university IT security team, their
optimal budget
should be 4,775000 euros and efficiency should be 0.9946%.
Initializing Evolutionary Algorithm ... Budget = 4775.0 ... done
[3, 3, 3, 2, 3, 2, 2, 2, 2, 2, 2, 2, 2, 2, 2, 2, 2, 3, 2, 2, 2, 2, 2, 2, 2, 2, 2, 2, 2, 2, 2, 2]
0.9946874982236078
To reach the optimal level CSP would need to upgrade the security level to three on the following
security measures/activities:
•
IT Governance
•
IT Management
•
Human Resource Management
•
PC Security
This research proved that the model is viable and if CSP-s would use the model to provide their
customers with at least efficiency information it would enable the customers to compare service
providers and increase trust in CSP-s. It also would enable CSP-s to provide services with different
security postures, so even smaller companies with lower requirements for security could afford
their services.
If both – customer and CSP – would provide their security effectiveness figures, confirmed by a 3rd
party, it could potentially make acquiring cyber insurance faster and more transparent.
University security team spent over 500 hours to implement the GSRM model but using their
created expert opinion model as a template for next year – the implementation time will be cut
tenfold.
7. CHAPTER – FUTURE
7.1 Research Limitations
Research has the following limitations and require further research:
•
The calculation of an alternative security profiles (very close to the calculated security profile)
should be included in the model. That requires reference model implementation in various
sized companies.
•
Security variations that differ from the calculated one by only 2-3% should be researched in
more detail.
Since the expert assessments have an error assumption of ± 20%.
•
Lack of CSP financial information has made most of the CSP calculations hypothetical.
VMware cloud provider platform detailed security measures should be added to the model,
but I was unable to attain that information from CSP.
105
7.2 Future Directions of Research
• The probability of attacks should be included, but I do not have that information available. I
assume that unprotected assets will be attacked. This merits further research.
• Losses from security incidents should be included. This needs the co-operation of insurance
companies and business side of companies.
• CSP model should be created adding additional security goals (non-repudiation, mission
criticality etc.) and financial information. That requires the assistance of a CSP, which is very hard
to gain.
• Include the hardware expected life cycle into the model - every five years a new investment may
be required for an activity and that year is likely different for different security activities and
financial investments.
• Gathering data from various experts regarding Parallel Coefficient.
• The documentation for the model should be created, so the model could be implemented
without the creator of the model.
I feel that the most important next step would be creating documentation. Simple manual which
explains security classes, measure groups, nodes, edges, super classes, optimizers, losses matrix
table, dependency matrix table etc. has been created. That documentation needs to be updated
and is approximately 40-50 pages long. To add methodology would take at least another 50 pages
and data gathering information another 50 pages, so I feel that there should be a separate entity
to a model creator to create the documentation and to update it regularly as the model evolves.
106
REFERENCES
•
27001 Academy. (2021). ISO 27001 checklist: 16 steps for the implementation.
[Online] Available at:
https://advisera.com/27001academy/knowledgebase/iso-
27001-implementation-checklist/ [Accessed 9 December 2020].
•
Ahmed, N. M. (2017). ’Measuring Cloud Security Risk by Mean Failure Cost’.
Computational Intelligence (SSCI) IEEE Symposium Series, Athens, Greece, 13
February 2017, pp. 39-45. [Online] Available at:
https://www.semanticscholar.org/paper/Measuring-cloud-security-risk-by-Mean-Failure-
Cost-Ahmed/8050b8a98f8a6d9167740fe3ad9e4e8af2882a7a [Accessed 21 December
2020].
•
Amazon. (2020). Amazon Web Services: Overview of Security Processes.
[Online] Available at:
https://d0.awsstatic.com/whitepapers/aws-security-whitepaper.pdf
[Accessed 6 March 2021].
•
Benabied, S. et al. (2015). A Cloud Security Framework Based on Trust Model
and Mobile Agent. [Online] Available at:
https://arxiv.org/ftp/arxiv/papers/2001/2001.09090.pdf [Accessed 6 December 2020].
•
Bergdahl, M. et al (2007). Handbook on Data Quality Assessment Methods and Tools.
[Online] Available at:
https://ec.europa.eu/eurostat/documents/64157/4373903/05-
Handbook-on-data-quality-assessment-methods-and-tools.pdf/c8bbb146-4d59-4a69-
b7c4-218c43952214 [Accessed 6 March 2021].
•
BSI (Federal Office for Information Security) (2004) The GSTOOL Manual. [Online] Available
at:
https://www.bsi.bund.de/SharedDocs/Downloads/EN/BSI/GSTOOL/gstoolmanual_pdf.pdf
?__blob=publicationFile [Accessed 6 June 2021].
•
Cleary, Y. (2021). Data Gathering and Analysis. [Online] Available at:
https://www.researchgate.net/publication/352532818_Data_Gathering_and_Analysis.
[Accessed 18 November 2021].
•
CFI. (2021). SMART Goal - Specific, Measurable, Attainable, Realistic, Timely. [Online]
Available at
: https://corporatefinanceinstitute.com/resources/knowledge/other/smart-
goal/ [Accessed 11 January 2021].
•
Cherdantseva, Y. and Hilton J. (2013). “A Reference Model of Information Assurance &
Security”. [Online] Available at
: http://users.cs.cf.ac.uk/Y.V.Cherdantseva/RMIAS.pdf
[Accessed 6 April 2021].
•
Cone, B.D. et al. (2007). A videogame for cyber security training and awareness, case.
[Online] Available at:
https://www.academia.edu/8707118/A%20%20video%20%20%20game%20f%20or%20cy
ber%20security%20training%20and%20awareness?auto%20=%20download [Accessed 6
December 2020].
107
•
CSCC (2015) Security for Cloud Computing Ten Steps to Ensure Success Version 2.0 [Online]
Available at:
https://www.omg.org/cloud/deliverables/CSCC-Security-for-Cloud-
Computing-10-Steps-to-Ensure-Success.pdf [Accessed 11 December 2020].
•
CyberCIEGE (2021). [Online] Available at:
https://nps.edu/web/c3o/cyberciege [Accessed
20 December 2020].
•
CyberCIEGE. (2013). CyberCIEGE Scenario Development Tool User’s Guide. [Online]
Available at
: https://nps.edu/documents/107523844/117287768/SDT.pdf/2b555b1a-
56bb-4f37-9e1b-4c52afbffff3?t=1541174271000 [Accessed 20 December 2020].
•
CyberProtect. (2011). FISSEA 2011 Role-Based-Training Winner - CyberProtect, Interactive
Training Exercise, Verison 2.0 [Online] Available at:
https://csrc.nist.gov/presentations/2011/fissea-2011-role-based-training-winner-
cyberprot [Accessed 20 December 2020].
•
Filkins, B. (2016). Quantifying Risk: Closing the Chasm Between Cybersecurity and Cyber
Insurance [Online] Available at
: https://www.sans.org/reading-
room/whitepapers/leadership/quantifying-risk-closing-chasm-cybersecurity-cyber-
insurance-36770 [Accessed 1 May 2021].
•
Friedrich-Baasner, Gregor & Fischer, Marcus & Winkelmann, Axel. (2018). Cloud
Computing in SMEs: A Qualitative Approach to Identify and Evaluate Influential Factors.
[Online] Available at:
https://www.researchgate.net/publication/322853820_Cloud_Computing_in_SMEs_A_Qu
alitative_Approach_to_Identify_and_Evaluate_Influential_Factors [Accessed 1 December
2020].
•
Gartner (2017) Gartner Says Worldwide Public Cloud Services Market to Grow 18 Percent
in 2017 [Online] Available at
: http://www.gartner.com/newsroom/id/3616417 [Accessed 2
December 2020].
•
Herner R., A., Salatore T., Jinsuu Park, & Sudha Ram. (2004). Design Science in Information
Science.
•
Hong, J. et al. (2017). A survey on the usability and practical applications of Graphical
Security Models. [Online] Available at:
https://www.sciencedirect.com/science/article/pii/S1574013716301083 [Accessed 15
November 2020].
•
Hsu, C. et al. (2018). The Impact of ISO 27001 Certification on Firm Performance. [Online]
Available at
: https://ieeexplore.ieee.org/abstract/document/7427787 [Accessed 2 April
2021].
•
Kequin, L (2020). On the profits of competing cloud service providers: A game theoretic
approach. [Online] Available at:
https://www.sciencedirect.com/science/article/pii/S002200002030101X [Accessed 15
November 2020].
108
•
Kirt, T. (2010). Optimizing IT Security Costs by Evolutionary Algorithms. [Online] Available
at:
https://www.academia.edu/980320/OPTIMIZING_IT_SECURITY_COSTS_BY_EVOLUTIONAR
Y_ALGORITHMS?email_work_card=title [Accessed 15 November 2020].
•
Kivimaa, J. (2013) A cost optimization model for IT security. PhD in Busi- ness
Administration thesis. Tallinn: Estonian Business School. [Online] Available at:
https://issuu.com/acpil/docs/kivimaa - dissertation june 2014 2 and
http://www.digar.ee/arhiiv/et/download/120067 [Accessed 15 November 2020].
•
Kivimaa, K (2017) How to increase SME/SMB trust in Cloud providers? Available at:
https://www.academia.edu/35275967/How_to_increase_SME_SMB_trust_in_Cloud_provi
ders [Accessed 13 December 2020].
•
Kordy, B. et al. (2016). Probabilistic reasoning with graphical security models. [Online]
Available at
: https://www.sciencedirect.com/science/article/pii/S0020025516000128
[Accessed 15 November 2020].
•
Kotkas, V.et al. (2011) ’CoCoViLa as a multifunctional simulation platform’, SIMUTools ’11
Proceedings of the 4th International ICST Conference on Simulation Tools and Techniques.
Barcelona, Spain, 21-25 March 2011, pp. 198-205. [Online] Available
at:.http://cs.ioc.ee/~pavelg/papers/2011__simutools_cocovila.pdf [Accessed 3 November
2020].
•
Kouns, J. and Minoli, D. (2011) Information Technology Risk Management in Enterprise
Environments: A Review of Industry Practices and a Practical Guide to Risk Management
Teams. John Wiley & Sons.
•
Latham & Watkins (2014). Cyber Insurance: A Last Line of Defense When Technology Fails.
Client Alert Whitepaper, (1675). [Online] Available at:
https://www.jdsupra.com/legalnews/cyber-insurance-a-last-line-of-defense-65858/
[Accessed 11 May 2021].
•
Lemon, R. (2021). Cyber Insurance Firms Start Tapping Out as Ransomware Continues to
Rise. [Online] Available at:
https://www.darkreading.com/risk/cyber-insurance-firms-start-
tapping-out-as-ransomware-continues-to-rise/d/d-
id/1341109?_mc=NL_DR_EDT_DR_weekly_20210527&cid=NL_DR_EDT_DR_weekly_20210
527&elq_mid=104151&elq_cid=34681664 [Accessed 26 May 2021].
•
Martinelli, F. and Yautsiukhin, A. (2016) ’Security by Insurance for Services’. 2016 IEEE
International Conference on Software Quality, Reliability and Security Companion, Vienna,
Austria, 1-3 August. IEEE 2016, ISBN 978-1-5090-3713-1.
•
Meland, P.H., Tondel, I.A. and Solhaug, B. (2015) ’Mitigating Risk with Cyber
Insurance’. IEEE Security & Privacy, 13(6): pp. 38- 43. [Online] Available at:
https://ieeexplore.ieee.org/abstract/document/7349090 [Accessed 11 May 2021].
•
Michael, K. (2012). Security Risk Management: Building an Information Security Risk
Management Program from the Ground Up. [Online] Available at:
109
https://www.academia.edu/22025814/Security_Risk_Management_Building_an_Informat
ion_Security_Risk_Management_Program_from_the_Ground_Up?email_work_card=title
[Accessed 15 November 2020].
•
Maroria, E. (2013). Cost based data security model for organizations. Online] Available at:
https://www.academia.edu/26017195/Cost_based_data_security_model_for_organizatio
ns
[Accessed 04 November 2020].
•
N. I. Ahmad et al (2019). Cloud Service Provider Security Readiness Model: The Malaysian
Perspective. 2019 International Conference on Electrical Engineering and Informatics
(ICEEI), Bandung, Indonesia, 2019, pp. 75-80, doi: 10.1109/ICEEI47359.2019.8988851 .
[Online] Available at:.
https://ieeexplore-ieee-org.proxy.lib.ltu.se/document/8988851
[Accessed 6 November 2020].
•
NIST – National Institute of Standards and Technology. (2015). Cloud Computing Service
Metrics Description Special Publication 500-307. [Online] Available at:
https://nvlpubs.nist.gov/nistpubs/SpecialPublications/NIST.SP.500-307.pdf [Accessed 11
December 2020].
•
Official Journal of the European Union. (2016). General Data Protection Regulation.
[Online] Available at:
https://gdpr-info.eu/ [Accessed 4 December 2020].
•
Olovsson, T. (1992). A Structured Approach to Computer Security. Technical Report
No.122 [Online] Available at: http://publications.lib.chalmers.se/records/fulltext/local
166411.pdf [Accessed 11 December 2020].
•
Ottis, R. (2014). Educational Computer Game for Cyber Security : Game Concept. [Online]
Available at
: https://digikogu.taltech.ee/et/Download/176754aa-58ad-4d06-a878-
a249516ae0cf [Accessed 21 May 2021].
•
RIA. (2017). Implementation manual for the THREE-LEVEL BASELINE SECURITY SYSTEM
ISKE. [Online] Available at:
https://www.ria.ee/sites/default/files/content-
editors/ISKE/iske-implementation-manual.pdf [Accessed 21 February 2021].
•
RIA. (2018). IT risk analysis. [Online] Available at:
https://www.ria.ee/sites/default/files/content-editors/KIIK/riskianaluusi-koostamise-
juhend.doc [Accessed 28 December 2020].
•
RIA. (2021). Three-level IT Baseline Security System ISKE. [Online] Available at:
https://www.ria.ee/en/cyber-security/it-baseline-security-system-iske.html [Accessed 21
February 2021].
•
Riigiteataja
. (2020). Infosüsteemide turvameetmete süsteem. [Online] Available at:
https://www.riigiteataja.ee/akt/13125331?leiaKehtiv [Accessed 21 January 2021].
•
Rizvi, S et al (2020). A fuzzy inference system (FIS) to evaluate the security readiness of
cloud service providers. [Online] Available at:
https://journalofcloudcomputing.springeropen.com/track/pdf/10.1186/s13677-020-110
00192-9.pdf [Accessed 11 December 2020].
•
Roessing von Rolf. (2010). The ISACA Business Model for Information Security: An
Integrative and Innovative Approach. [Online] Available at:
https://www.researchgate.net/publication/253890690_The_ISACA_Business_Model_for_I
nformation_Security_An_Integrative_and_Innovative_Approach [Accessed 19 December
2020].
•
Ross, R. (2008). Managing Enterprise Security Risk with NIST Standards. [Online] Available
at:
https://ieeexplore.ieee.org/abstract/document/4292023 [Accessed 19 February 2021].
•
SANS Institute (2016) Security and Accountability in the Cloud Data Center: A SANS
Survey. [Online] Available at: h https://www.prnewswire.com/news-releases/security-and-
accountability-in-the-cloud-data-center-a-sans-survey-300338111.html Accessed 11
December 2020] [Accessed 19 December 2020].
•
SANS Institute (2016). Security and Accountability in the Cloud Data Center: A SANS
Survey. [Online] Available at
: https://www.prnewswire.com/news-releases/security-and-
accountability-in-the-cloud-data-center-a-sans-survey-300338111.html [Accessed 11 May
2021].
•
Schulze, H. (2017). Cybersecurity Trends Report 2017, case, [Online] Available at:
https://www.cybersecurity-insiders.com/wp-content/uploads/2017/02/Cybersecurity-
Trends-Report-2017.pdf [Accessed 14 May 2021].
•
Shaikh,R. & Modak, M. (2017). Measuring Data Security for a Cloud Computing Service.
[Online] Available at:
https://ieeexplore.ieee.org/stamp/stamp.jsp?tp=&arnumber=8463843&tag=1 [Accessed
25 October 2021].
•
Shim, W. (2010). Independent risk and cyber security : An analysis of security investment
and cyber insurance. [Online] Available at:
https://d.lib.msu.edu/islandora/object/etd:1197/datastream/OBJ/download/Interdepend
ent_risk_and_cyber_security__an_analysis_of_security_investment_and_cyber_insurance
.pdf
[Accessed 15 November 2021].
•
Skroupa, P., C. The Cost Of Cyber Breach – How Much Your Company Should Budget.
[Online] Available at:
https://www.linkedin.com/pulse/cost-cyber-breach-how-much-your-
company-should-budget-skroupa/?trk=public_profile_article_view [Accessed 10 April
2021].
•
Sonnenberg, C., & vom Brocke, J. (2012). Evaluations in the Science of the Artificial -
Reconsidering the Build-Evaluate Pattern in Design Science Research. In K. Peffers, M.
Rothenberger & B. Kuechler (Eds.), Design Science Research in Information Systems.
Advances in Theory and Practice. Proceedings of the 7th DESRIST Conference (Vol. 7286,
pp. 381-397). Las Vegas, NV, USA: Springer Berlin / Heidelberg. [Online] Available at:
https://link.springer.com/chapter/10.1007%2F978-3-642-29863-9_28 [Accessed 20 March
2021].
111
•
TISN. (2020). Trusted Information Sharing Network. [Online] Available at:
https://www.cisc.gov.au/engagement/trusted-information-sharing-network [Accessed 5
April 2021].
•
Torkura, K. et al. (2020). CloudStrike: Chaos Engineering for Security and Resiliency in
Cloud Infrastructure. [Online] Available at:
https://ieeexplore.ieee.org/abstract/document/9133399/authors#authors
•
Whaiduzzaman & Gani, A. (2014). Measuring security for cloud service provider: A Third
Party approach. [Online] Available at:
https://www.researchgate.net/publication/262224177_Measuring_security_for_cloud_se
rvice_provider_A_Third_Party_approach [Accessed 25 October 2021].
•
Zhao, X. et al. (2009). Managing Interdependent Information Security Risks: A Study of
Cyberinsurance, Managed Security Service and Risk Pooling. [Online] Available at:
https://aisel.aisnet.org/cgi/viewcontent.cgi?article=1156&context=icis2009 [Accessed 6
March 2021].
Bibliography
List of Abbreviations
• ALE Annual Loss Expectancy
• AWT Awarness Training
• CA Cellural Automata
• CFO Chief Financial Officer
• CSP Cloud Service Provider
• DLP Data Loss Prevention
• E Efficiency
• ENISA European Union Agency for Network and Information Security
• GDPR General Data Protection Regulation
• GS Graded Security
• GSES Graded Security Expert System
• GSRM Graded Security Reference Model
• HW Hardware
112
• IDC Independent Directors Council
• IDS Intrusion Detection System
• IaaS Infrastructure as a Service
• iLvSit Initial Level Situation
• IPS Intrusion Prevention System
• IS information System
• ISKE Three-level IT baseline system
• ISO International Organization for Standardization
• ITG IT Governance
• ITHRM IT Human Resources Management
• ITSM IT Risk and Monitoring (Software Monitoring)
• LAN Local Area Network
• MC Monte Carlo
• MSC Minimal Cut Set
• NIST National Institute for Standards and Technology, US
• PaaS Platform as a Service
• QoS Quality of Service
• Rc Redundancy coefficient
• ROI Return on Investment
• SaaS Software as a Service
• SLA Service Level Agreement
• SME Small and Medium Enterprise
• SW Software
• VPN Virtual Private Network
• WAN Wide Area Network
113
APPENDIXES
Scheme Loading Manual
CoCoViLa requires Java SE Runtime to run, so first we need to make sure we have the latest
version of Java installed.
Navigate to URL -
https://www.oracle.com/java/technologies/downloads/ and download and
install the latest version applicable to your computers operating system.
CoCoViLa installation is a quite straightforward process - unless 3D graphics will be used, but our
model only uses 2D, so we don’t have to worry about that.
Firstly, navigate to website-
http://cocovila.github.io/ and download the latest release of
CoCoViLa.
Figure 7. 1 - CoCoViLa download.
CoCoViLa package will be in .rar format, so it must be unpacked using either WinRar or a free
software called 7Zip -
http://www.7-zip.org/download.html In the folder there will be 2 .jar files
we need to run the cocovila-0.9.8.12.jar to open the required CoCoViLa Schema Editor interface.
To start the model:
Start CoCoViLa Schema Editor and from upper menu choose:
1. Package – Load and run from just opened window from models application directory
GSES
0.5/packages/GSES v0.5/optimization.xml 114
Figure 7. 2 - Loading the package.
2. File – Load Scheme – (file nme).syn
Figure 7. 3 - Loading the Scheme.
Figure 7. 4 - File selection.
3.
Scheme – Specification – Update from Scheme – Compute all – Compile & Run
Figure 7. 5 - Running the Schema.
Figure 7. 6 – Outcome graphs and java
Figure 7. 7 – Security Measures Properties list
Figure 7. 8 – Properties values (Investment, Maintenance, Effectiveness, Initial and Required Levels etc.)
Figure 7. 9 – Algorithm properties
Figure 7. 10 – Algorithm values (Min and Max Budget, Annual Loss etc.)
Figure 7. 11 - Supporting-Parallel activities properties
Figure 7. 12 - Supporting-Parallel activities values
Expert-level User Manual for GSES/GSRM
Introduction
The most important benefits of GSRM based GSES (Graded Security Expert
System) prototype are that it:
•
Allows the calculation of the maximum-security confidence level for a given budget
•
Allows the calculation of the required budget for a given security confidence level
•
Has an appropriate calculation time (couple minutes)
•
Allows the calculation of the security efficiency and total IT risk
•
Can be implemented in a short timeframe (a few months only)
•
Once implemented in an organisation it can be easily reused in an organization with
similar environment
•
Is very robust with respect to estimation errors on both cost & efficiency levels
•
Permits dependencies between security measures groups
•
Provides clear results in the form of graphs that can be included in executive reports
•
Takes potential losses into account
The implementation of the GSRM in GSES for a specific organisation requires
several tasks to be performed:
Collect and insert to GSRM/GSES expert knowledge about company:
1. Information assets (mainly business IS’s) to protect
2. These IS’s Security goals and Goals levels
3. Identification and description of the security measures groups that are required
to achieve a specific security level
4. Assign cost - and confidence levels to all security measures groups’ security levels
5. Define the security levels for each security measures group, that are mandatory
for achieving the organisation’s security goals
6. Estimate the losses due to residual risk
Insert collected expert knowledge to GSRM/GSES:
1. Create and describe the Measure Group’s blocks based on security areas our IT
Security is based – i.e., create Measure Group’s blocks and describe in their
properties their possible levels cost, effectiveness and currently achieved levels
values
2. Security activities and security goals dependencies into Dependency Matrix
3. Security Annual Loss Expectancies relation between really assured security goals
levels into Losses Matrix
….. and the GSES will do the rest.
Some notes about problems with CoCoViLa/GSES/GSRM find out in first implementations:
•
Never save changes to …. .syn after you have run the application.
•
If you change values in a CoCoViLa/GSES/GSRM fields on screen always press Enter.
•
If you want to create/make changes in your concrete expert solution you have to make
correct changes in three places – in security areas descriptions properties, in
Dependency Graph and in DependencyMatrix table. NB! – in three places.
•
After changes always save the new scheme, close CoCoViLa, restart CoCoViLa/GSES and
check are all changes in GSRM/GSES same as you planned (possible are your and
CoCoViLa’s failures too).
•
If all changes you made are correct then GSRM/GSES starts optimization (it takes 5-10
minutes), if not then in Java Console you see immediately Finished – i.e. user failures
error messages part is not yet developed.
•
to change security goals levels again changes in three places are needed:
1.
SecClass (red box) -> Properties -> viLvlsNbr -> all levels to 3
2.
Delete 4th level lines in DependMatrix.tbl
3.
Delete level “3“line in LossesMatrix.tbl.
•
If you want to use Banking example as starting point and make your own changing it
then main idea is that start with 1-2 changes and after that (if these are successful) make
backup copy from it, and then next change, next backup copy and so on. Possibility to
make mistakes is too big to be successful with all of them at once.
My second change/example was removing SDOC and RISK activities:
1.
Delete these activities boxes
2.
Delete SDOC and RISK edges from graph
3.
Delete SDOC and RISK columns from DependMatrix.tbl.
And forward carefully – one or two changes -> backup -> next couple changes … and so
on!
•
To mark calculated points on curves:
Graph2D -> right mouse-click and Properties -> bUseShapes – true
To have these points concrete values move with pointer to interesting for you point and
in an arised small you can see these values within about 3 sec
•
Don’t forget to insert initial/already achieved security areas levels: in activities areas
Properties is "iLvlSit" - i.e. " initial Level Situation" and there is possible to mark initial
level about currently existing security situation in organization based on your
Dependency Matrix. And optimization starts from these levels.
GSES is SW prototype for GSRM, and CoCoViLa’s latest version is 0.9... – i.e., prototype based on open
source. But at the same time CoCoViLa has a lot of plusses – mainly it is free and makes possible rapid
applications development - visual programming, includes utilities for graphical output interface and ...
Installation Manual
GSRM/GSES (Graded Security Expert System) works normally on computers with all most-used
operating systems – practically tested is Windows, Mac OsX and Linux. Must be installable Java 1.6
and that’s all.
Installation Guide for CoCoViLa
Download CoCoViLa installation package from -
https://cocovila.github.io/
Use WebStart (installs CoCoViLa with all latest changes)
http://www.cs.ioc.ee
For the 3D to work you need to install an additional java package: java 3D extensions which can
be found from the following location -
http://www.oracle.com/technetwork/java/javase/tech/index-jsp-138252.html
Possible problems in Installation if..
•
64-bit versions of operating systems and Java are used - i.e. use 32-bit versions
•
Possible problems even if under 64-bit operating systems emulate 32-bit virtual machines
•
used some Open Java versions (use Sun/Oracle-Java Environment and both from there – Java
and 3D)
•
installed was already some older version of CoCoViLa then problems with WebStart – will do
some limited installation (not Java Console, …)
To start Java console
-
on Windows PC: Control Panel -> Java -> Advanced -> Java console -> Show console.
-
on Linux ja Mac PC’s from command line: javaws -viewer↵ and continue similarly to
previous.
Installation of the GSES
Extract files from „GSES2_...... .rar“ to directory „\....\GSES_.....“ .
Start GSES
Start CoCoViLa Schem Editor and from its upper menu:
1.
Package -> Load -> \....\GSES_....\optimization.xml
2.
File -> Load Scheme -> GSES_.... .syn
3.
Scheme -> Run
But if you made changes in model (and mostly you have) then:
3.
File -> Save Scheme
4.
Scheme -> Specification and first click to „Compute all“ button and then „Compile &
Run“
This is what a standard scheme would look like:
Figure 7. 13 – Schema overview
Results for managers
The application generates graphical outputs on each other, and the user must himself create a good
overall picture on the screen – i.e. distribute outputs appropriately.
•
The most important is of course Total Costs = f(Security Effectiveness), where Total Costs =
Investment Costs + Maintenance Costs + Losses from security incidents
Figure 7. 14 – Total Cost Curve
•
And maybe even more interesting for managers - Total Costs = f(Security Costs), where
Security Costs = Investment Costs + Maintenance Costs
Figure 7. 15 – Total Cost curve
•
For first year the security Effectiveness = f(Investment + Maintenance) – the security level has
been reached as the function of the costs (Investments Costs + Maintenance Costs) and
mitigationRate = f(Investment + Maintenance)
Figure 7. 16 – Effectiveness and mitigation rate curve year 1
•
mitRate = f(IM_1year), mitRate = f(IM_2year)ja mitRate = f(IM_3year) – shown are the
Mitigation Rate’s reliance of Security Costs for three gradual years.
Figure 7. 17 - Effectiveness and mitigation rate curve year 2
Figure 7. 18 - Effectiveness and mitigation rate curve year 3
As example, company, or the IT manager can define the desired security level of this (if
specified are allowable maximal losses – let’s say SE = 500) needed IT security Investment- +
Maintenance Costs are:
-
The first year to achieve SE=500 is needed 0.915 million €,
-
The second year to achieve SE=500 is needed 0.510 million € and
-
The third year to achieve SE=500 is needed 0.390 million €.
•
Optimal security activities levels to achieve the required Mitigation Rate are visible on Java
Console:
Figure 7. 19 – Java Console
As example for first year and for ~ 0.9 million € security costs optimal security activities levels
are:
4, 4, 2, 0, 5, 5, 0, 5, 0, 1, 0, 0, 0, 0, 0, 0, 1, 1, 0, 1, 4, 0, 0, 0, 0, 3, 4, 2, 0, 0, 3, 4, 4, 4
Graph3D
At a moment just example about future nice possibilities, but at a moment just example, needs
some developments to be more informative and readable/understandable.
Figure 7. 20 - #D Graph
Program Structure
The program is structured as follows:
CellularAutomata.java
- Singleton automatic implementing theory.
- Determines if a candidate cut set is a cut set or not.
Edge.java
- Superclass for EdgeR.java and EdgeS.java.
- Refers to the measure groups it represents.
- allows setting comments and display names.
EdgeR.java
- Implements the relevant edges of the graph.
- Contains Strength-Weakness-Neutral feature and FVI value.
- Supports the calculation of the incidence lists.
EdgeS.java
- Implements the supporting edges of the graph.
- Contains redundancy coefficient.
EvoOptAlgo.java
- Singleton containing the evolutionary algorithm).
- Finds the optimum protection profile for one budget point.
- Keeps statistics of the optimization process.
Graph2D.java
- Implements dual Y-axis 2D curves.
- Also allows sums of variables.
Graph3D.java
- Implements 3D curves for multiyear views.
- Also allows sums of variables.
InterPolation.java
- Interpolates losses curve based on straight lines, natural cubic
polynomial splines or natural cubic Bezier splines
- Is also used to interpolate values for Graph3D.java
MeasureGroup.java
- Contains the measure group parameters
MonteCarlo.java
- Generates random candidate cut sets
- Uses CellularAutomata.java to check if the candidate is a cut set
- Determines the MCSs
- Calculates FVI values
Node.java
- Implements the nodes of the graph structure
- Supports the calculation of the adjacency list
- Contains node type parameter (in, out, default)
NodeLabeled.java
- Extends Node.java to allow labels on each node
Optimizer.java
- Provides GSRM maintenance cost, investment cost, losses and
security efficiency functions
- Initializes the GSRM parameters
- Initializes EvoOptAlgo.java
- Launches the optimization
- Collects the results for all budget points
ReliabCalc.java
- Singleton implementing the calculation of the overall efficiency.
SecurityClass.java
- Calculates the limits or extended losses curve and the required
protection profile.
Super.java
- Collects all variables from the scheme
- Creates incidence and adjacency lists
- Initializes CellularAutomata.java
- Initializes MonteCarlo.java
- Initializes ReliabCalc.java
Figure 7. 21 - GSRM toolbar
Only 10 of these classes are used in the scheme editor. The buttons showed in GSRM toolbar above
are used for each class with from the left to the right:
1.
SecurityClass.java
2.
MeasureGroup.java
3.
Node.java
4.
NodeLabeled.java
5.
EdgeR.java
6.
EdgeS.java
7.
Super.java
8.
Optimizer.java
9.
Graph2D.java
10.
Graph3D.java
A separate section explains the properties of each class.
How to use the scheme editor to make schemes and launch programs. For each class the scheme
symbol, properties window and a table explaining the properties are given. If needed additional
remarks are provided as well.
Input of collected expert information to GSRM/GSES
Security Class
Figure 7. 22 - Security Class scheme symbol
Figure 7. 23 - Security Class properties window
The security class performs the losses calculations and determines the required measure group levels.
The scheme symbol’s leftmost port must be connected to the super class scheme symbol’s lower
edge port, its the rightmost port to the lower edge port of the optimizer scheme symbol. If the wrong
types of bindings are created on the scheme, the program execution will fail.
All Boolean values must be written in lowercase.
Variable Name
Description
String ObjectName
Name of the Object Instance (automatically generated)
String[] vsGoals
Security goals are defined here. The first letter of each goal is used to
represent the security class. (e.g. C2I2A2)
int[] viLvlsNbr
Array containing the number of levels per goal
int[] viLvlsReq
Array containing the required levels for each goal. These levels are
used for the security class.
boolean bMonotonous
true = Limited & False = Extended losses curve
boolean bNoLimit
true = no security goals set – false = security goals set
Figure 7. 24 - Security Class properties
It is important that the order of the elements in all arrays corresponds (i.e. the first elements always
corresponds with the first goal, etc.) and that all array lengths are equal.
The security class object uses input data from the expert tables LossesMatrix.tbl and
DependMatrix.tbl. The array lengths and viLvlsNbr values must of course correspond to those given in
the expert tables.
In general bMonotonous must be true.– when Lossed come from Losses.tbl.
With bNoLimit set, different results are usually obtained than with the maximum-security class set.
Contrary to what was assumed in previous GSES version’s simulations, a maximum-security class
doesn’t always imply all measure groups must be at their maximum levels. The measure group
purchased software for example can be implemented at 6 levels (from 0 to 5) but the maximum
required level mentioned in the dependency matrix is only level 4. So, setting the security class to its
maximum values doesn’t allow measure group levels to evolve freely between the current value and
the maximum levels, but between the current value and the required value which can be different.
bNoLimit
allows us to completely remove the security class restriction.
MeasureGroups
Figure 7. 25 - Measure group scheme symbol
Figure 7. 26 - Measure group properties window
Variable Name
Description
String ObjectName
Name of the Object Instance (automatically generated)
String sCode
Default value = “[ABBR]”, contains measure group abbreviation
Is used in the scheme symbol
String sDescription
Default value = “[full name]”, allows a short measure group description
Is used in the scheme symbol
double[] vdInvest
Contains the investment costs for each measure group level
double[] vdEffect
Contains the security efficiencies for each measure group level
double[] vdMaintn
Contains the maintenance costs for each measure group level
int iLvlSit
Contains the current measure group implementation level
Is used in the scheme symbol
Figure 7. 27 - Measure group properties
The measure group contains all measure group related expert data.
All measure group abbreviations must be unique, because they will be used by the edges in the graph
structure to get the correct measure group information.
All array lengths must be equal of course and higher than the maximum value mentioned in the
corresponding row of the expert table DependMatrix.tbl. (The required levels in DependMatrix.tbl
must exist…)
int iLvlReq
is calculated according to the security class parameters and DependMatrix.tbl. The result is
displayed next to the iLvlReq label in the scheme symbol when the program is finished. (And
propagate values has been set of course)
Nodes
Figure 7. 28 - Node scheme symbol
Figure 7. 29 - Node properties window
Variable Name
Description
String ObjectName
Name of the Object Instance (automatically generated)
String sNodeType
Default value = “default”, specifies the type of node
String sLabel
Allows creation of Labels in the graph (class NodeLabeled.java only)
Figure 7. 30 - Node properties
Nodes can have three types: “in”, “out” or “default”.
“in” stands for the source node, “out” for the target node, “default” for the intermediate nodes.
Capitalization of the String is not important.
Figure 7. 31 - Labeled node scheme
symbol
Figure 7. 32 - Labeled node properties window
A labeled node only has one extra variable String sLabel. This NodeLabeled.java class is included to be
able to emphasize parts of the graph structure.
All nodes must be connected to at least one relevant edge. Connections with other types of objects
are possible but not allowed. If the wrong bindings are created on the scheme, the program
execution will fail.
Edges
Figure 7. 33 - : Relevant Edge scheme symbol
Figure 7. 34 - Relevant Edge properties window
Relevant and supporting Edge properties were described previously but for reasons of clarity not all
properties were shown. String sMeasGroupCode
was replaced by the String[] vsMeasGroupCode.
String sDisplay
and sComment have been added.
Variable Name
EdgeS EdgeR Description
String ObjectName
X
X
Name of the Object Instance
String[] vsMeasGroupCode
X
X
Allows access to the cost and efficiency data of
the referenced security measure groups
String sDisplay
X
X
Default value = “[ABBR]”
Is used in the scheme symbol
String sComment
X
X
Is used in the console window to identify edges
instead of ObjectName
String sSWN
X
Default value = “[S,W,N]”, Strong, Weak, Neutral
attribute
Is used in the scheme symbol
double dRedund
X
Redundancy coefficient 𝑅𝑅𝑐𝑐
Is used in the scheme symbol
Figure 7. 35 - Edge properties
In analogy with the BMIS, depending on the position in the graph, measure groups can be considered
less or more effective. That is why String sSWN
is used for relevant edges. A 10% variation is applied in
positive or negative direction to the security efficiency of strong or weak edges. The values of sSWN
can be lowercase or uppercase “S”,”W“ and “N”.
String[]
vsMeasGroupCode
allows a reference to more than one measure group at once. The edge’s
efficiency is considered, being the average value of the referenced measure groups.
String
sComment
should best be unique. This way the console display will be unambiguous.
Please remember that dRedund
should contain a value between 0 and 1.
Figure 7. 36 - Supporting edge scheme symbol
Figure 7. 37 - Supporting Edge properties window
The supporting edges may only be connected to relevant edges. Relevant edges must be connected
on both sides to a different node. Again, if the wrong types of bindings are created on the scheme,
the program execution will fail.
Super Class
Figure 7. 38 - Super class scheme
symbol
Figure 7. 39 - Super Class properties window
All parameters of this class influence the
MonteCarlo MCS search algorithm.
The scheme symbol’s lower edge port must be connected to the leftmost port of the security class
scheme symbol. The right edge port must be connected to the left edge port of the optimizer scheme
symbol. If the wrong types of bindings are created on the scheme, the program execution will fail.
All
Boolean values must be written in lowercase.
Variable Name
Description
String ObjectName
Name of the Object Instance (automatically generated)
boolean bLvlsSit
If true: Uses current measure group efficiencies to simulate edge failures
boolean bLvlsReq
If true: Uses required measure group efficiencies to simulate edge failures
boolean bAvgConfid
If true: Uses same efficiency value to simulate all edge failures
double dAvgConfid
Average efficiency value, used in case bAvgConfid is set to true
boolean bUseSWN
If true: include SWN considerations in determining failure rates
boolean bUseRedund If true: include redundancy values for determining failure rates
Figure 7. 40 - Super class properties
The MCS search algorithm can be launched for two reasons: to find the MCSs and/or to find the
correct criticality and FVI values.
If the only reason is to find the MCSs allowing precise overall security efficiency calculations, only
bAvgConfid
should be set to true. dAvgConfid should be chosen wisely. The topology of the graph
structure influences the dAvgConfid
value. If most of the MCSs appear to be of a lower order, a higher
average efficiency level should be used. This will force the MC random generator the create less failed
edges per trial. To favor the finding of higher order MCSs a lower dAvgConfid must be chosen.
If the correct criticality and FVI values most be found, bLvlsSit
or bLvlsReq should be set to true
depending on the situation you want to model. The MCS search algorithm will then use the efficiency
values from the initial situation or the desired situation (required protection profile) to simulate edge
failures. The FVI values will then reflect these situations.
To obtain even more realistic values, bUseSWN
and bUseRedund can be set to true to include the
supporting measure group and weak, neutral, strong influences on the failure rates.
Optimizer
Figure 7. 41 - Optimizer scheme symbol
Figure 7. 42 - Optimizer properties window
The optimizer class allows the definition of the budget points, the multiyear parameters and the
losses curve interpolation technique.
The scheme symbol’s lower edge port must be connected to the rightmost port of the security class
scheme symbol. The left edge port must be connected to the right edge port of the super class
scheme symbol. The right-hand side ports are the optimization outputs that can be plotted on the 2D
- or 3D graphs.
If the wrong types of bindings are created on the scheme, the program execution will fail.
All
Boolean values must be written in lowercase.
Variable Name
Description
String ObjectName
Name of the Object Instance (automatically generated)
int iMinBudget
Sets the first budget point for which to optimize
int iMaxBudget
Sets the last budget point for which to optimize
int iStep
Sets the interval between two consecutive budget points
int iNrOfYears
Sets the number of years for which to optimize
double dBudgetEvo
Sets the budgetary evolution from year to year
boolean bCubicSpline
If true: use natural cubic polynomial spline for losses curve
boolean bBezierSpline If true: use natural cubic Bezier spline for losses curve
Figure 7. 43 - Optimizer properties
dBudgetEvo set to 0.10 means that the budget will increase each year with 10%. If bCubicSpline
and
bBezierSpline
are both set to false, straight-line interpolation is used.
Graph2D
Figure 7. 44 - 2D graph scheme symbol
Figure 7. 45 - 2D graph properties window
The graph2D symbol is quite self-explanatory. The X-axis port sums the variables connected to it
before plotting. Both Y-axes have 2 ports. The upper port allows to calculate and plot the sum of the
variables connected to it. The lower port plots all variables connected to it separately. If the wrong
types of bindings are created on the scheme, the program execution will fail. All
boolean values must
be written in lowercase.
Variable Name
Description
String ObjectName
Name of the Object Instance (automatically generated)
boolean bUseShapes
If true: uses shapes to mark each really calculated point of the curve
boolean bUseSpline
If true: uses a spline to plot the curves
int iYear
Sets the year for which to plot data
String sTitle
Sets the title of the plot
String sXLabel
Sets the X-axis label
String sY1Label
Sets the Y1-axis label (left-hand side Y axis)
String sY2Label
Sets the Y2-axis label (right-hand side Y axis)
Figure 7. 46 - Graph2D properties
Graph3D
Figure 7. 47 - 3D graph scheme symbol
Figure 7. 48 - 3D graph properties window
The 3D graph allows the 3D representation of variables. The variables connected to the Y- and Z-axis
ports are summed before plotting them. If the wrong types of bindings are created on the scheme,
the program execution will fail. All
Boolean values must be written in lowercase.
Variable Name
Description
String ObjectName
Name of the Object Instance (automatically generated)
String sTitle
Sets the title of the plot
String sYLabel
Sets the Y-axis label
String sZLabel
Sets the Z-axis label
boolean bBezierSpline If true: uses shapes to extend X - and Y axis data points
boolean bCubicSpline
If true: uses a spline to extend X - and Y axis data points
Table 1: Graph3D properties
bBezierSpline
and bCubicSpline are used to create extra intermediate points for the 3D graph. This is
needed to help FreeHep (the 3D renderer) with plotting a detailed 3D curve. With too little data
points the 3D curve is not interpretable.
Losses Matrix Expert Table
The GSRM/GSES uses two expert tables LossesMatrix.tbl and DependMatrix.tbl. DependMatrix.tbl
and LossesMatrix.tbl interpretations are explained respectively.
Figure 7. 49 - CoCoViLa losses matrix
Dependency Matrix Expert Table
The only change that is made in the CoCoViLa implementation of the dependency matrix is that
empty cells are replaced by cells containing −1.
Figure 7. 50 - CoCoViLa dependency matrix
Practical Work - main problems and ideas
iLvSit=1, doesnt consider Investment first level expenses, only maintaining the level
Maintenance if starting from zero, then it needs to be considered, if not a new system then it’s
not required – if new then Invest 1-leveli finances to be added.
1. All graphical displays must be static (check static box in properties window)
2. First Node in graph must have in Properties -> sNodeType „in“, and last Node in graph must
have in Properties -> sNodeType „out“
3. All relevant edges/IT Sec areas must be presented in Dependency Graph.
An example for bigger institutions:
Figure 7. 51 – Dependency graph for big corporations
An example for SMBs (Small-medium business):
Figure 7. 52 – Dependency graph for small and medium companies
4.
In Cost/Effectiveness table –
IT Security Costs = Maintenance Costs + Investment Costs.
Possible simplification is that
Maintenance Costs ≈ 1/2 of Investment Costs.
5.
Insert in Measure Group’s Properties “initial Level Situation” – i.e. insert achieved levels of
security activity levels as starting point for future optimizations (keep in mind that in starting
from non-zero levels you cannot start with initial budget level=0 – at least Maintenance Costs
for these levels are needed).
But again, keep in mind that we are making first test for this option and version with these
levels=0 is very recommended/needed too.
6.
In Graph – relevant edges/security activities areas (“must-be” mainly serial) and supporting
areas (parallel to relevant areas). Banking example is quite logical, I think.
Document Outline
- Abstract
- Acknowledgments
- List of Figures
- 1. CHAPTER - INTRODUCTION
- 1.1 Introduction
- 1.11 Research Question
- 1.12 Research Problem Definition
- 1.13 Research Objective
- 1.14 Design Objective
- 1.15 Assumptions
- 1.16 Benefits of the Research
- 1.17 Limitations
- 1.18 Implementation
- 2. CHAPTER – METHODOLOGY
- 2.1 Methodology
- 2.2 Research Plan
- 2.3 Data Gathering
- 3. CHAPTER – LITERATURE REVIEW
- 3.1 Literature Review
- 3.2 Security Standards and Frameworks
- 3.21 ISO Security Standards
- 3.22 NIST Risk-management framework
- 3.23 ISKE/BIS
- 3.24 Graded Reference model
- 3.3 Existing models
- 3.31 GSTool
- 3.32 CyberProtect
- 3.33 CyberCIEGE
- 3.4 Insurance
- 3.5 Graded Security Reference Model
- 4. CHAPTER – UNIVERSITY ANALYSIS AND EVALUATION
- 4.1 University on-prem standing
- 4.2 Implementation
- 4.3 Evaluation
- 5. CHAPTER – CSP ANALYSIS JA EVALUATION
- 5.1 CSP Security measures
- 5.2 Implementation
- 5.3 Evaluation
- 6. CHAPTER – SUMMARY OF FINDINGS
- 7. CHAPTER – FUTURE
- 7.1 Research Limitations
- 7.2 Future Directions of Research
- REFERENCES
- Bibliography
- APPENDIXES
- Scheme Loading Manual
- Expert-level User Manual for GSES/GSRM
- Introduction
- Installation Manual
- Installation Guide for CoCoViLa
- Installation of the GSES
- Start GSES
- Results for managers
- Program Structure
- Input of collected expert information to GSRM/GSES
- Security Class
- MeasureGroups
- Nodes
- Edges
- Super Class
- Optimizer
- Graph2D
- Graph3D
- Losses Matrix Expert Table
- Dependency Matrix Expert Table
- Practical Work - main problems and ideas


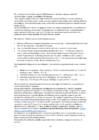
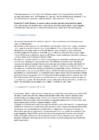
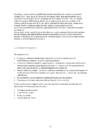
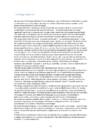
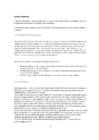
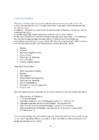
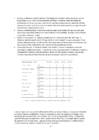
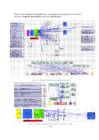

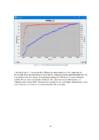
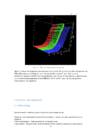
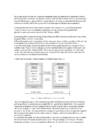
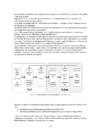
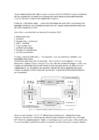
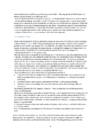
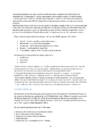
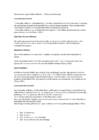
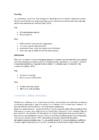
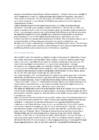
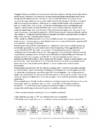
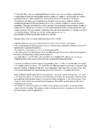
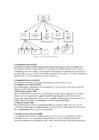
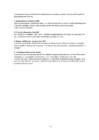
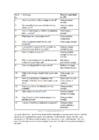
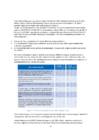
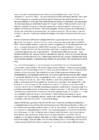
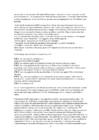
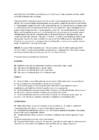
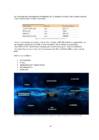
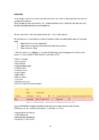
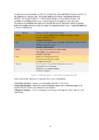
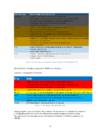
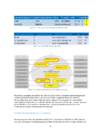
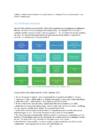

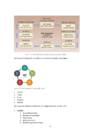
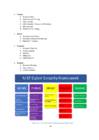
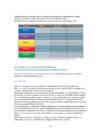
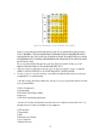
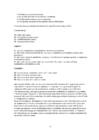
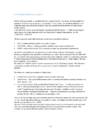
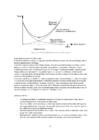
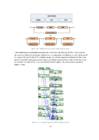
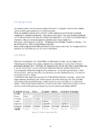
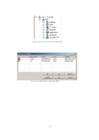
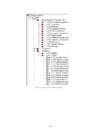
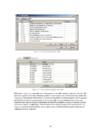
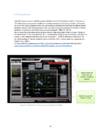
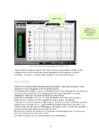

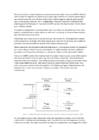
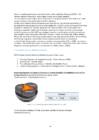
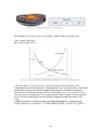
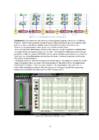
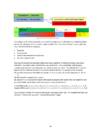
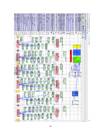
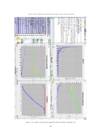
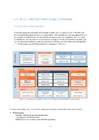
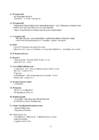
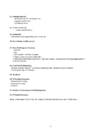
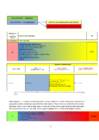
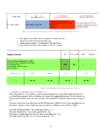
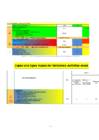
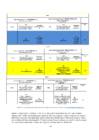
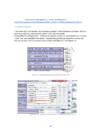
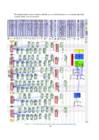
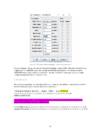
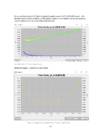
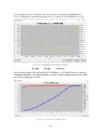
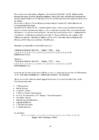
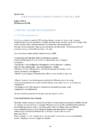
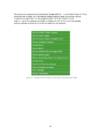
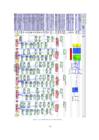
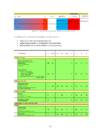
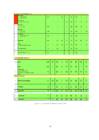
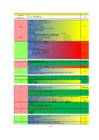
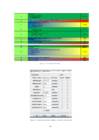
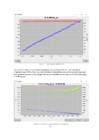
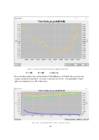
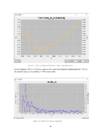
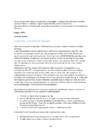
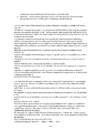
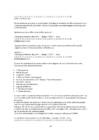
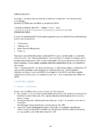
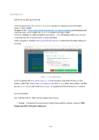
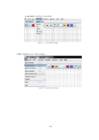
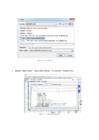
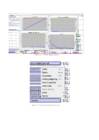
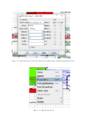
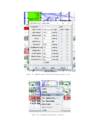
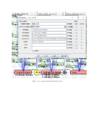
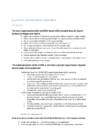
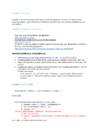
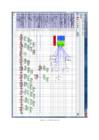
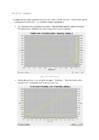
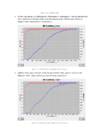
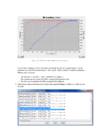
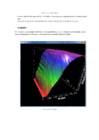
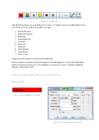
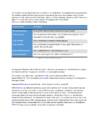
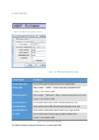
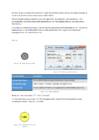
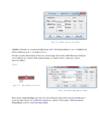
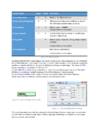
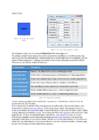
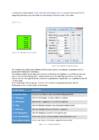
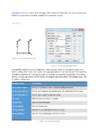
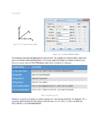
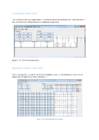
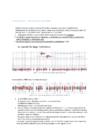


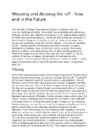
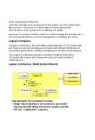
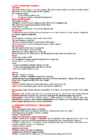
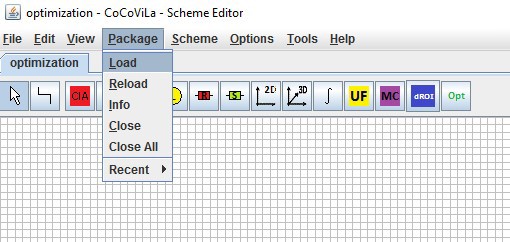
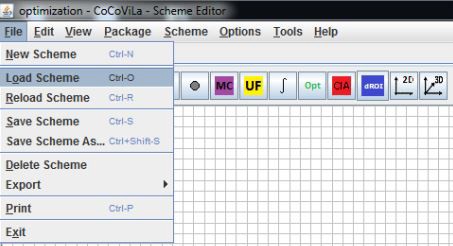
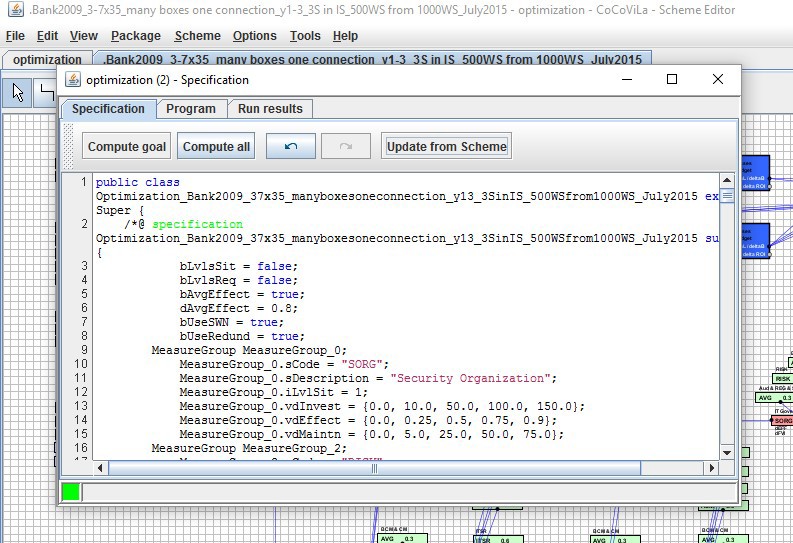
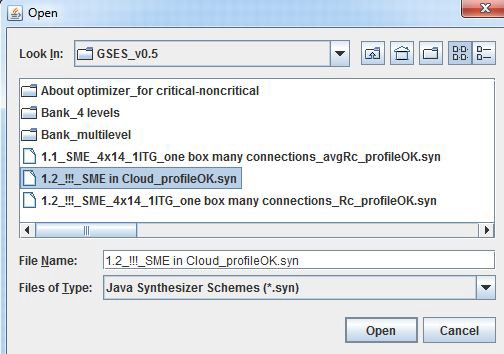
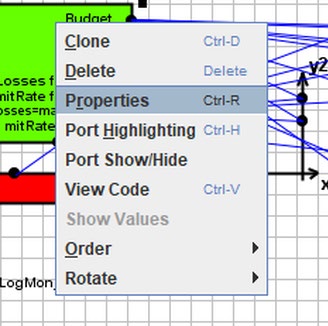
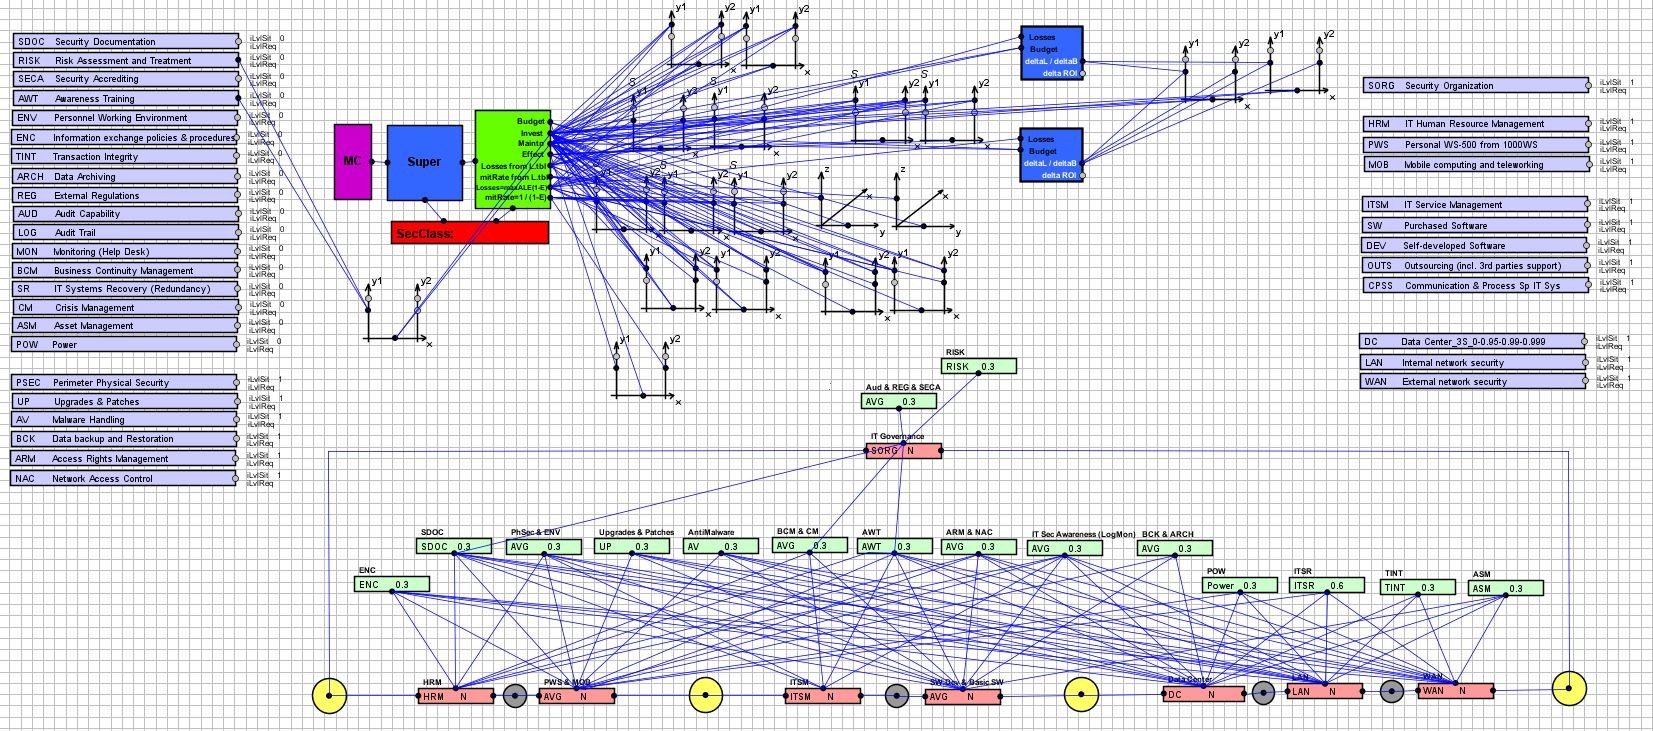
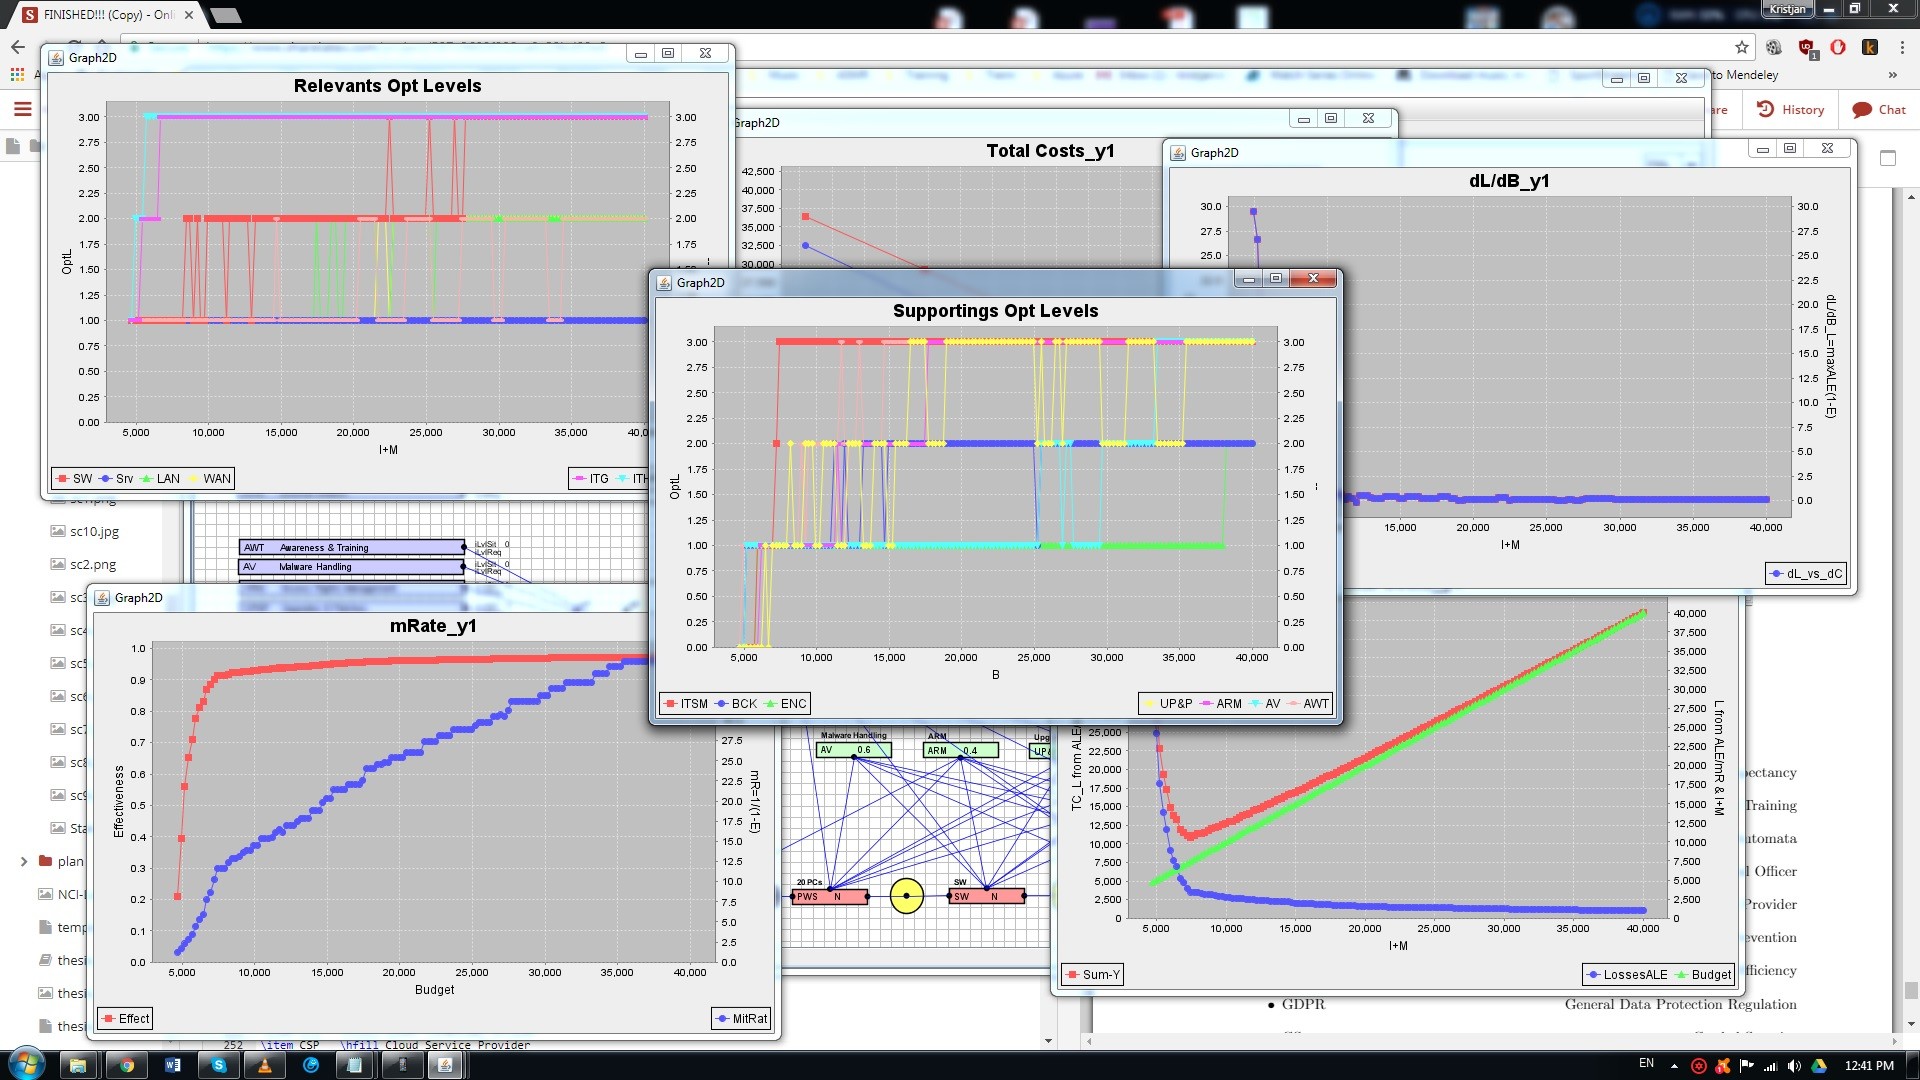


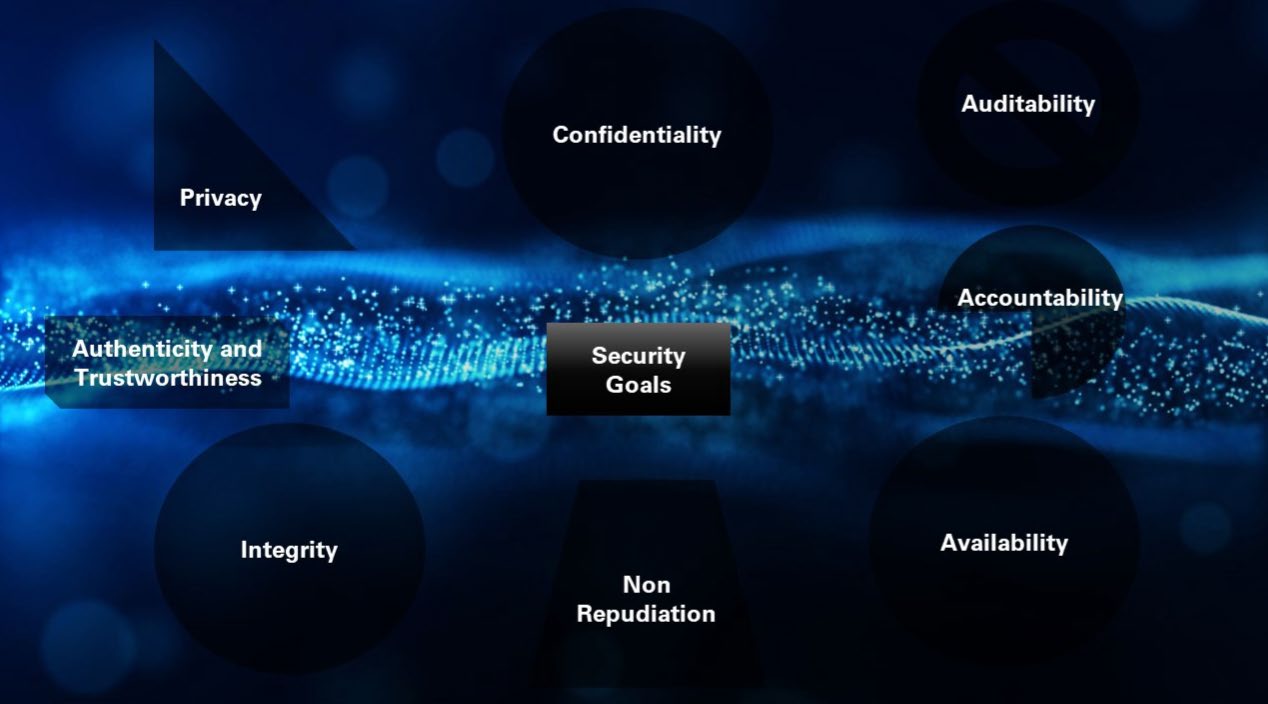
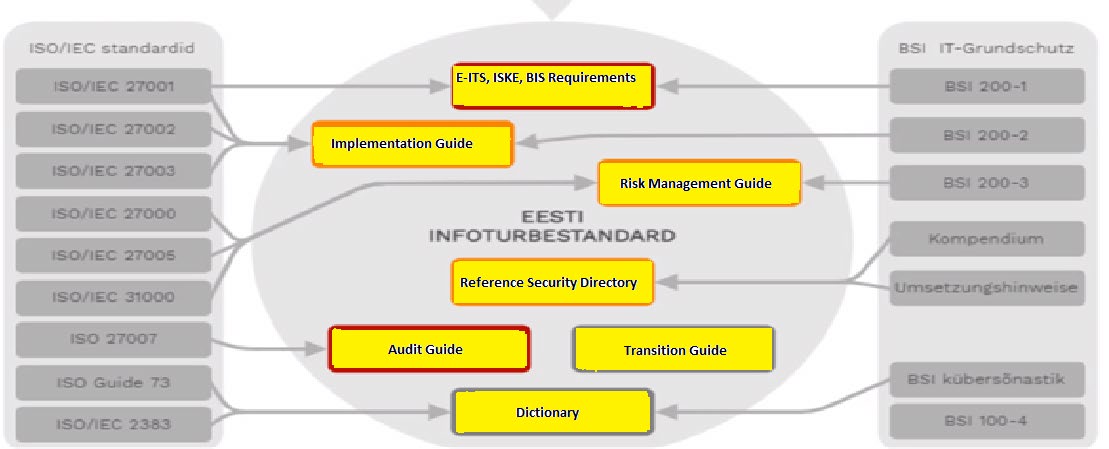
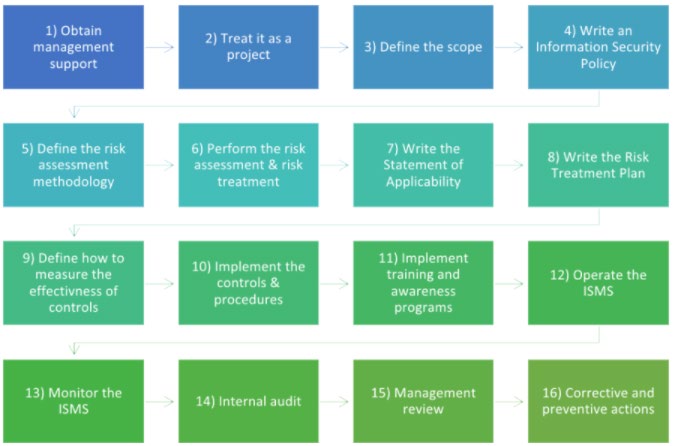
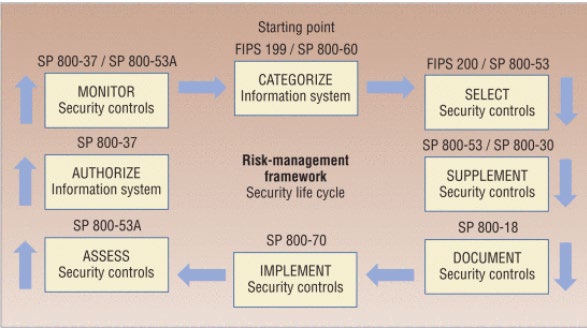
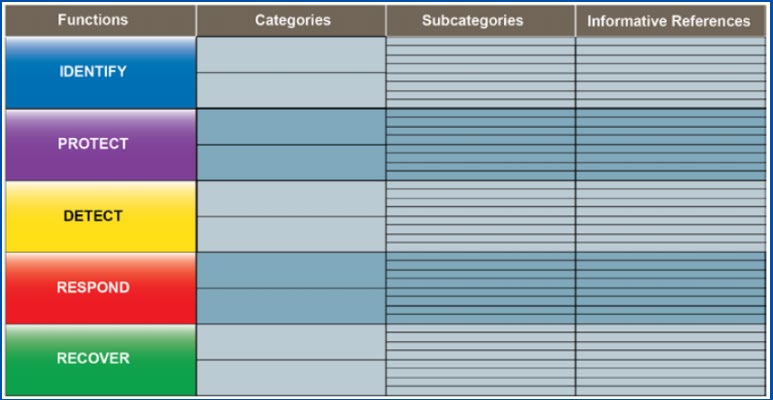
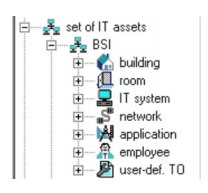
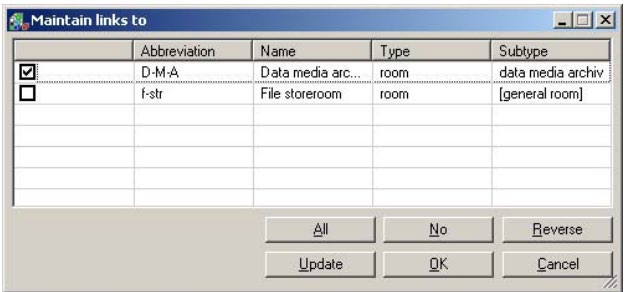
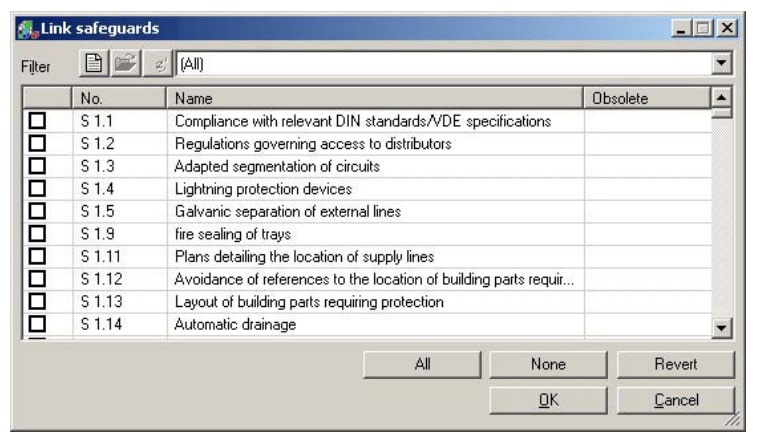

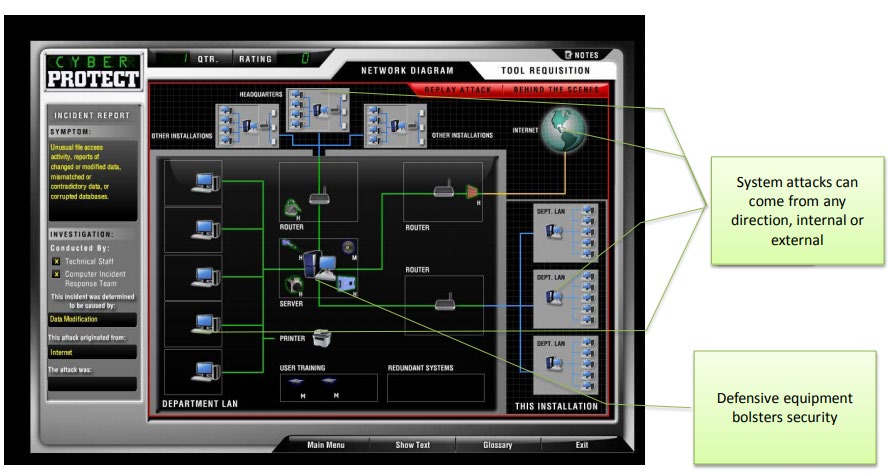
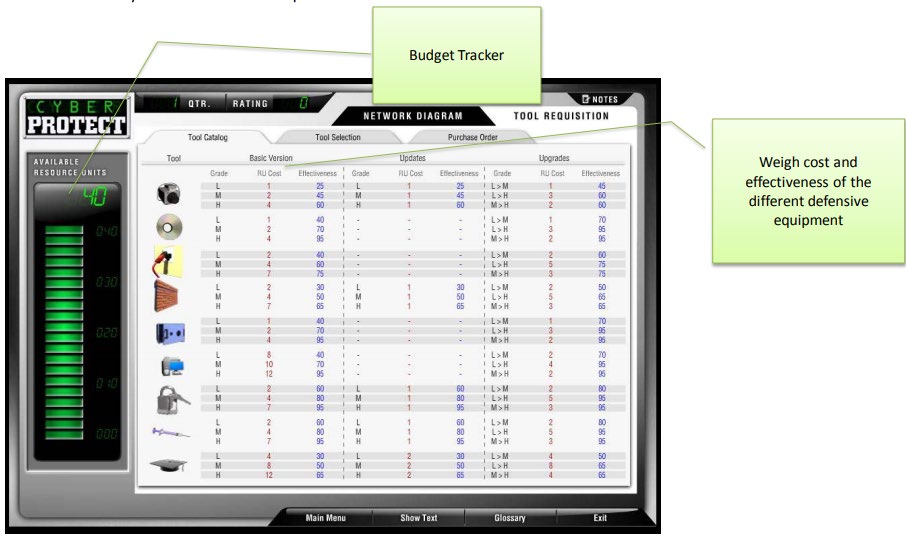
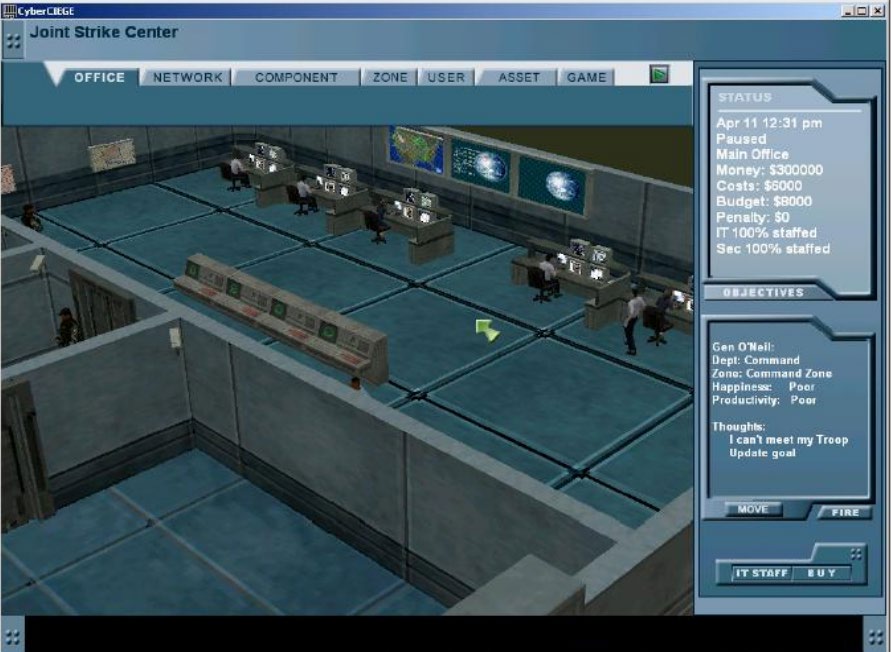
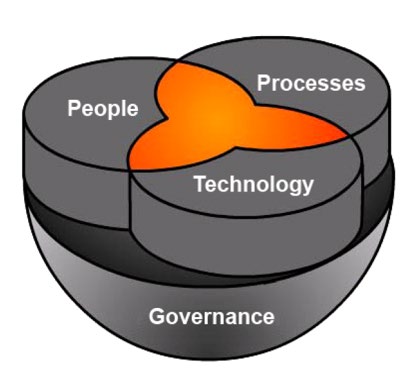
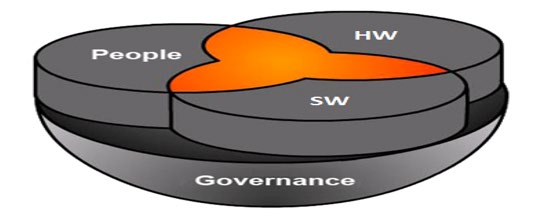
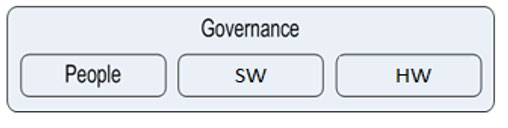
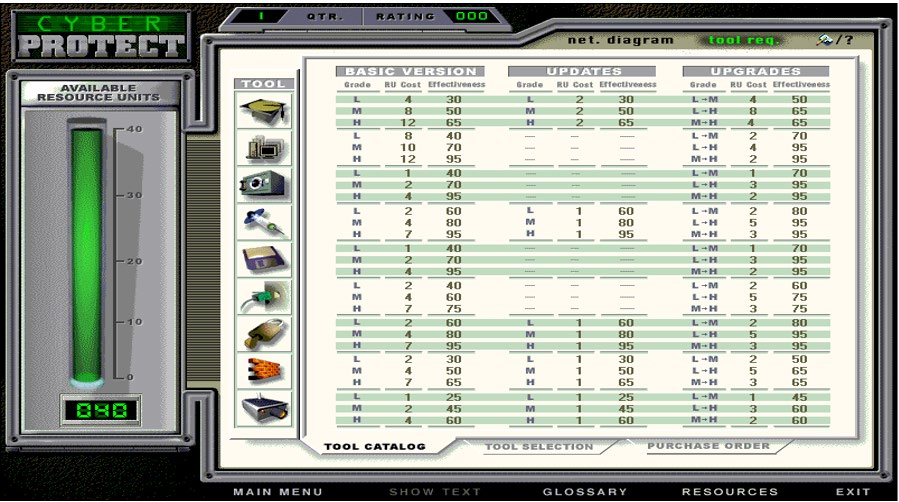
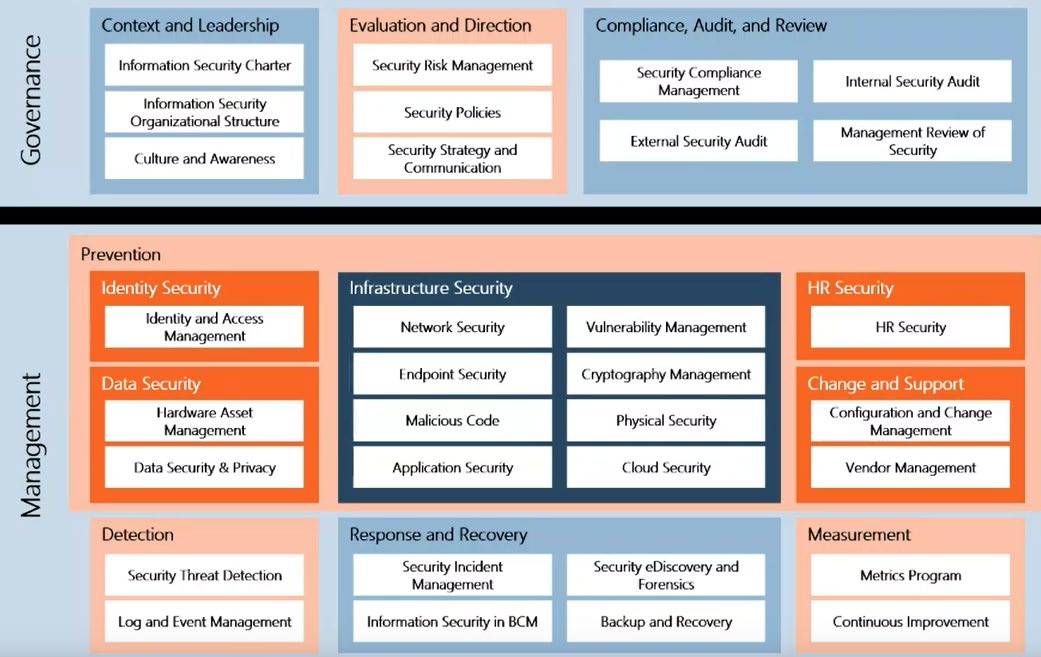
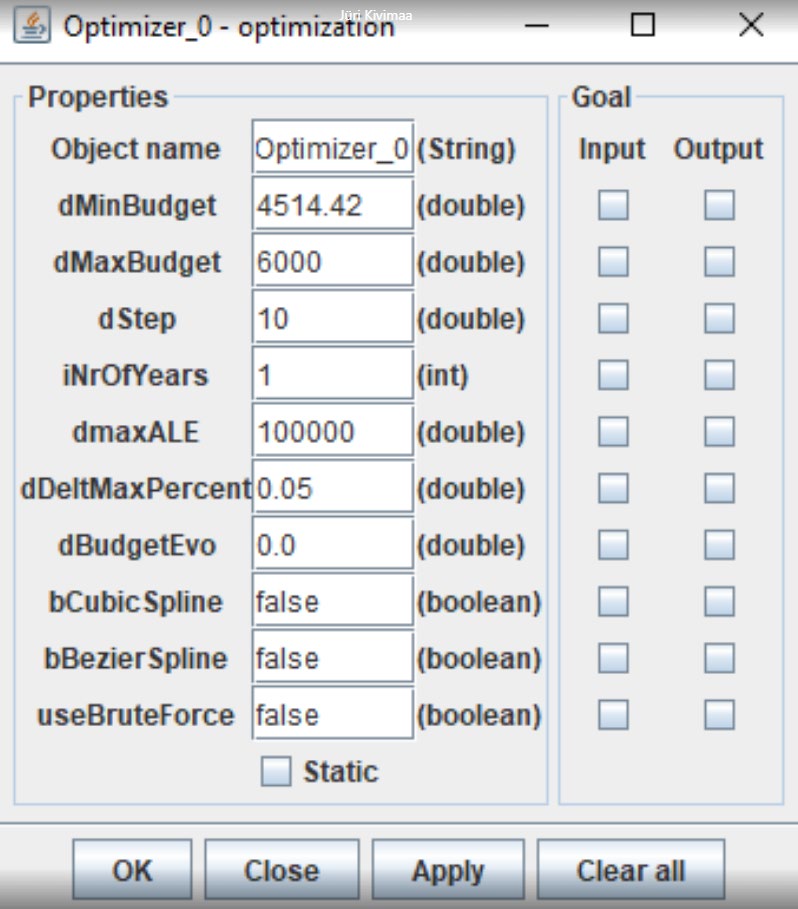
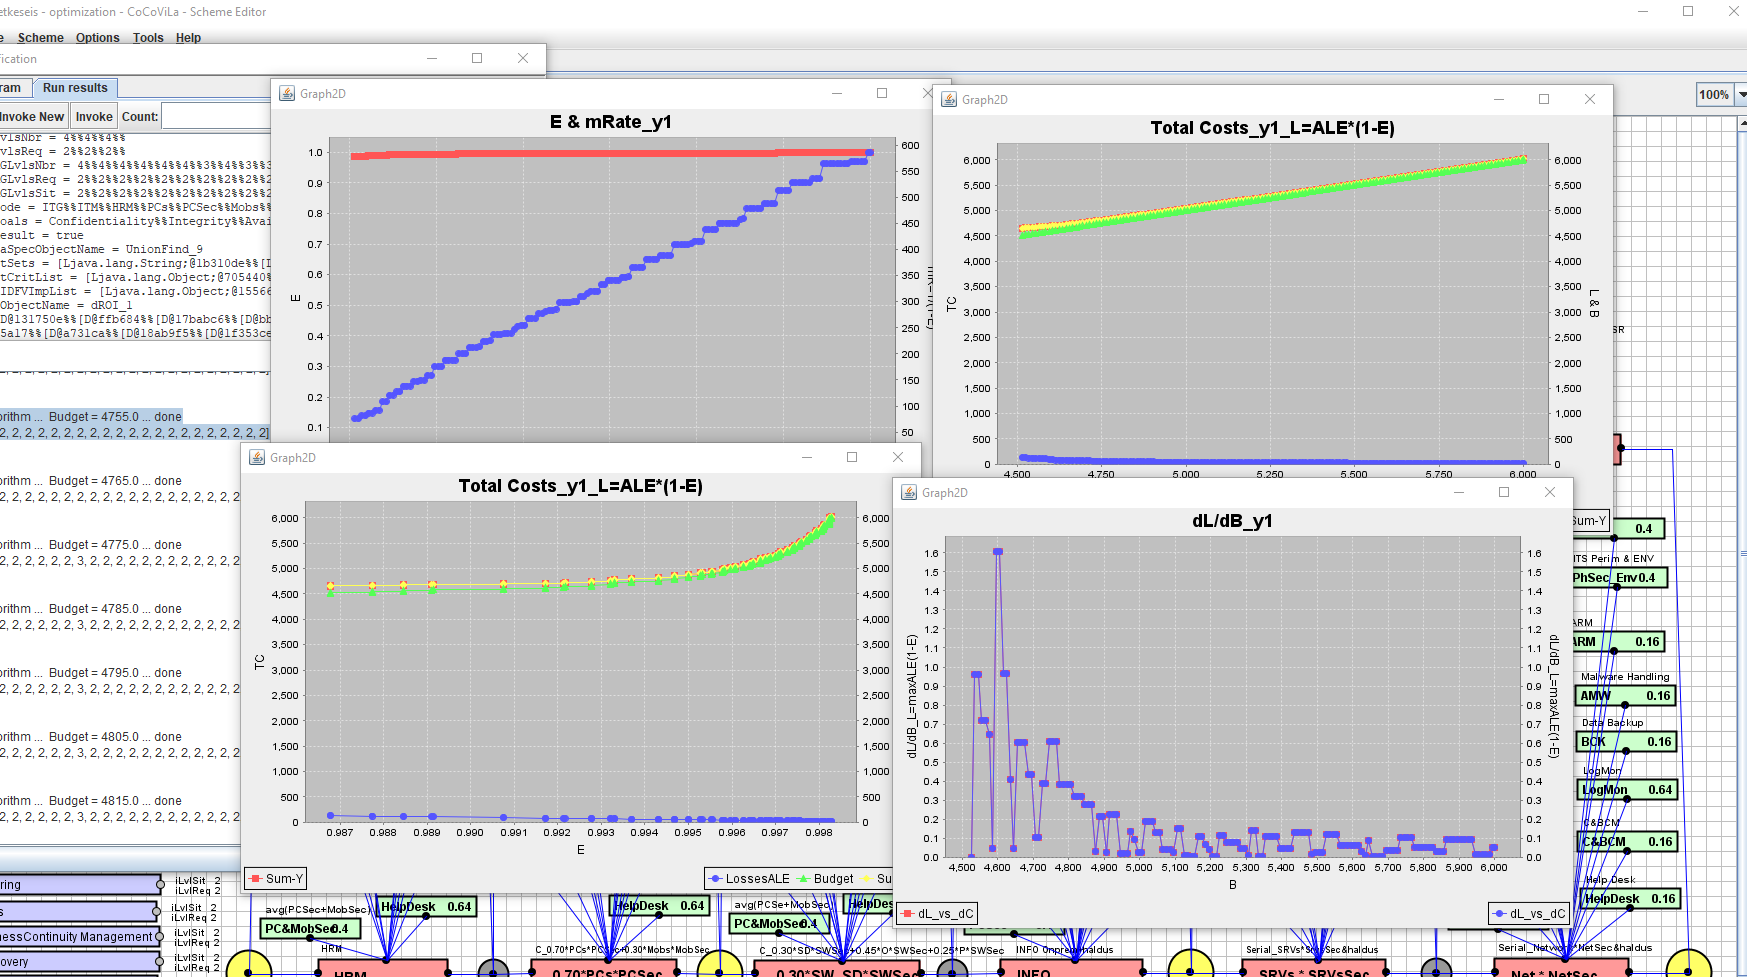
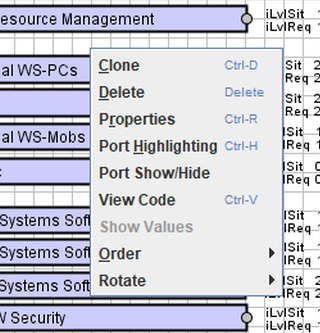
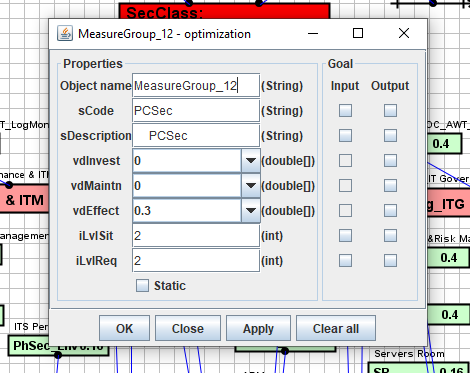
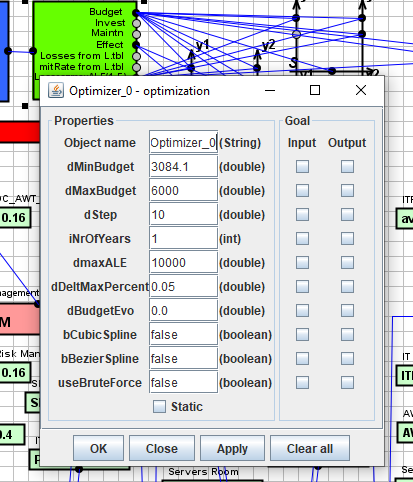
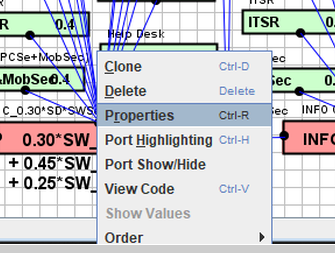
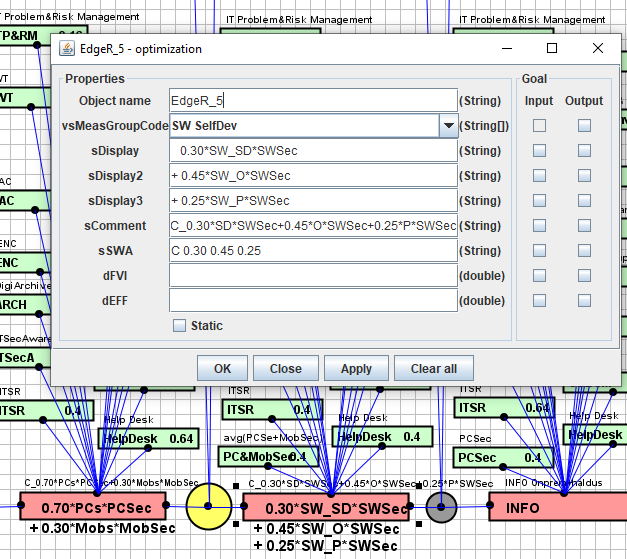
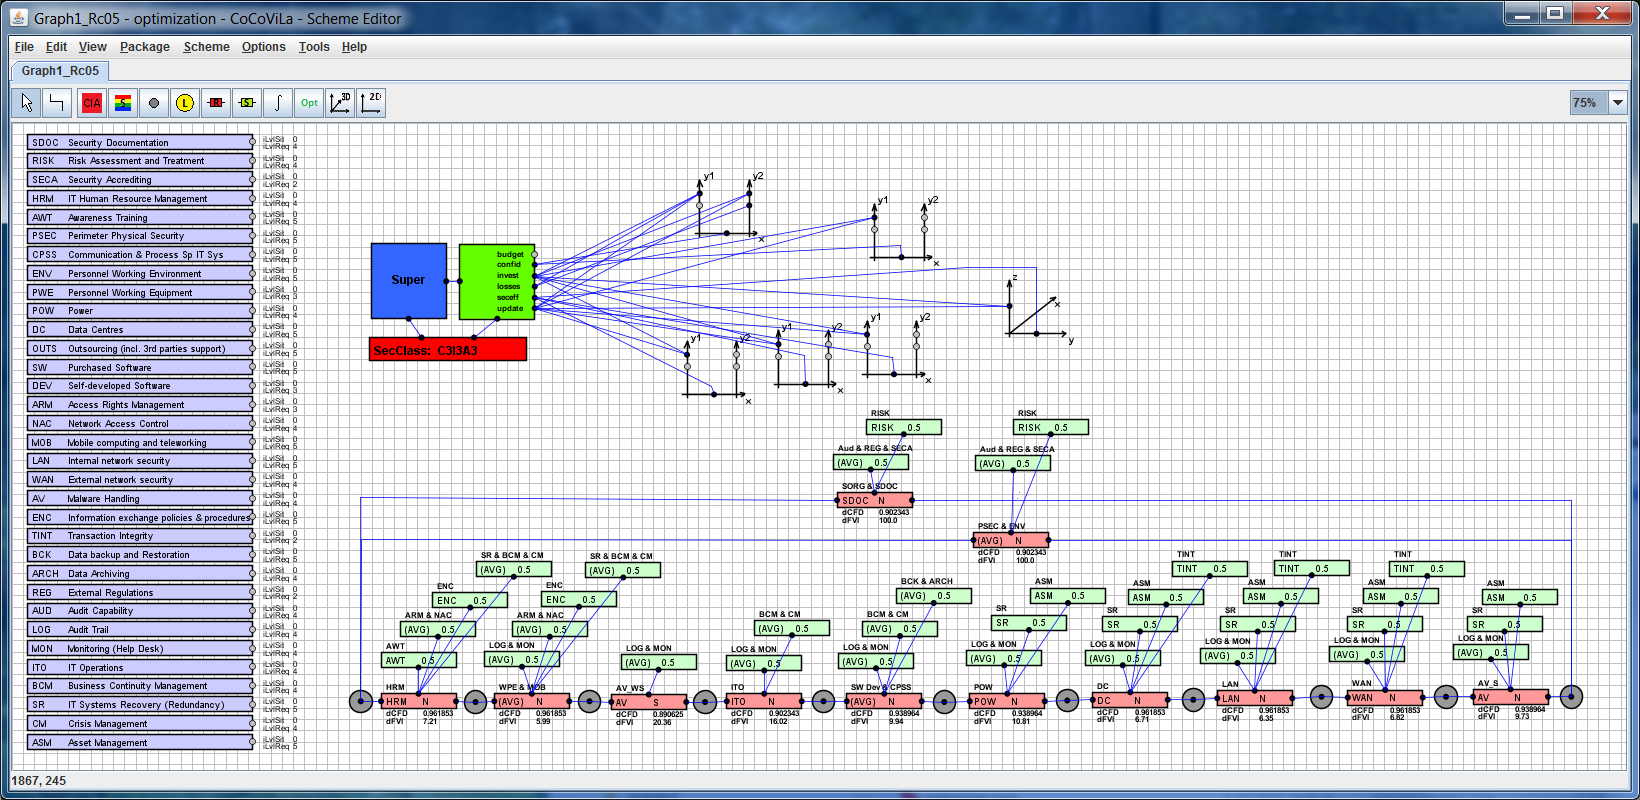
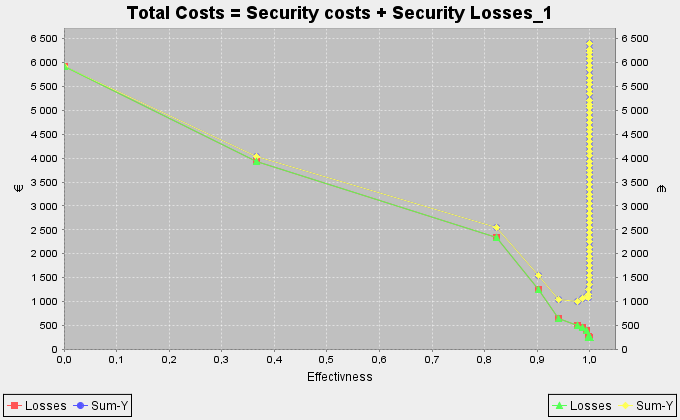
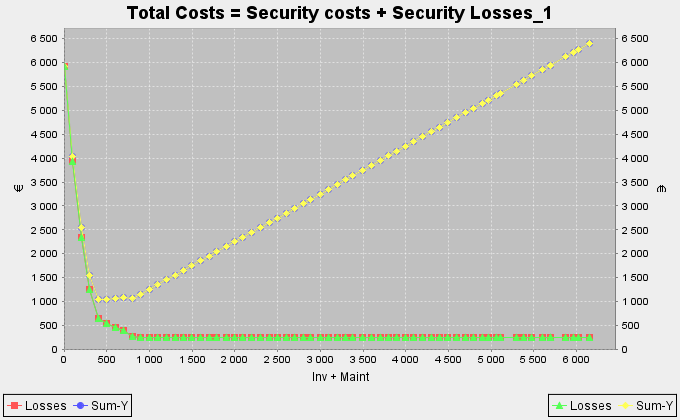
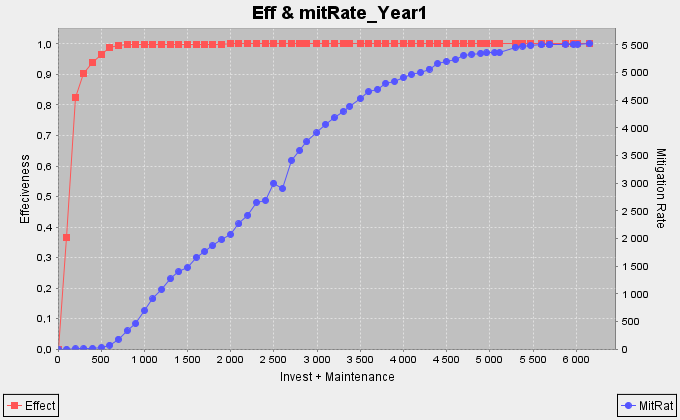
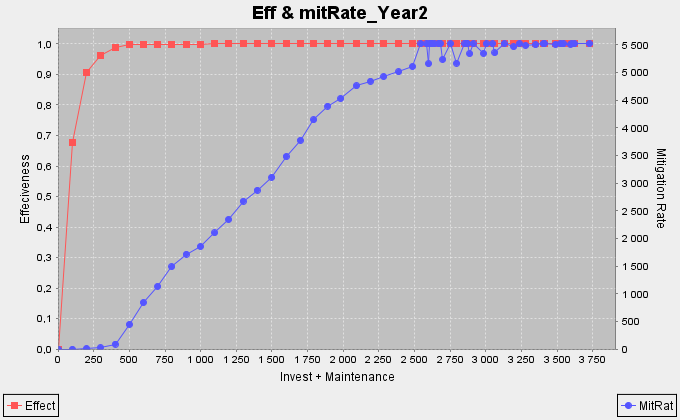
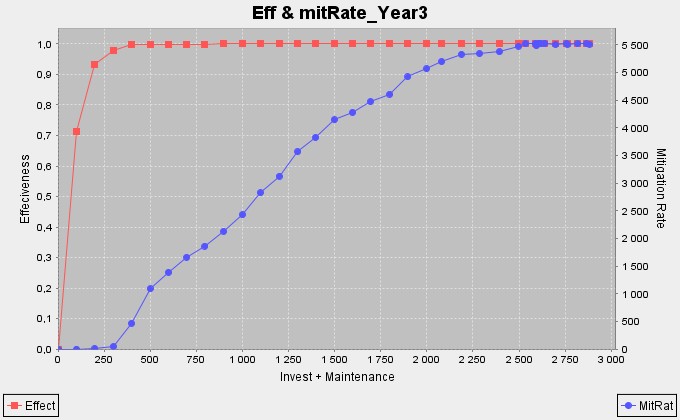
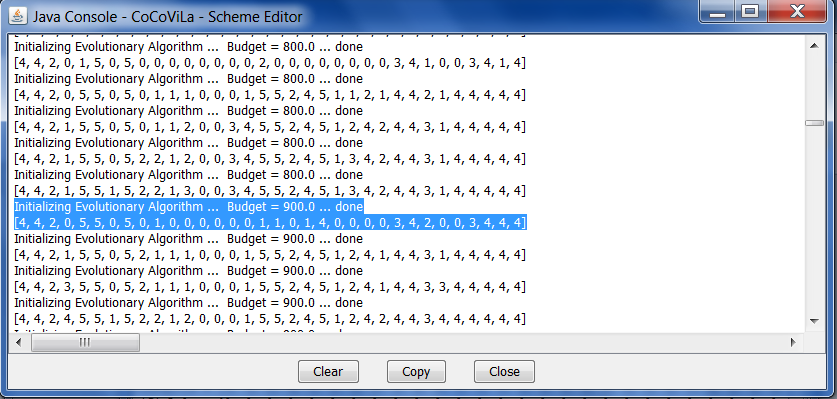
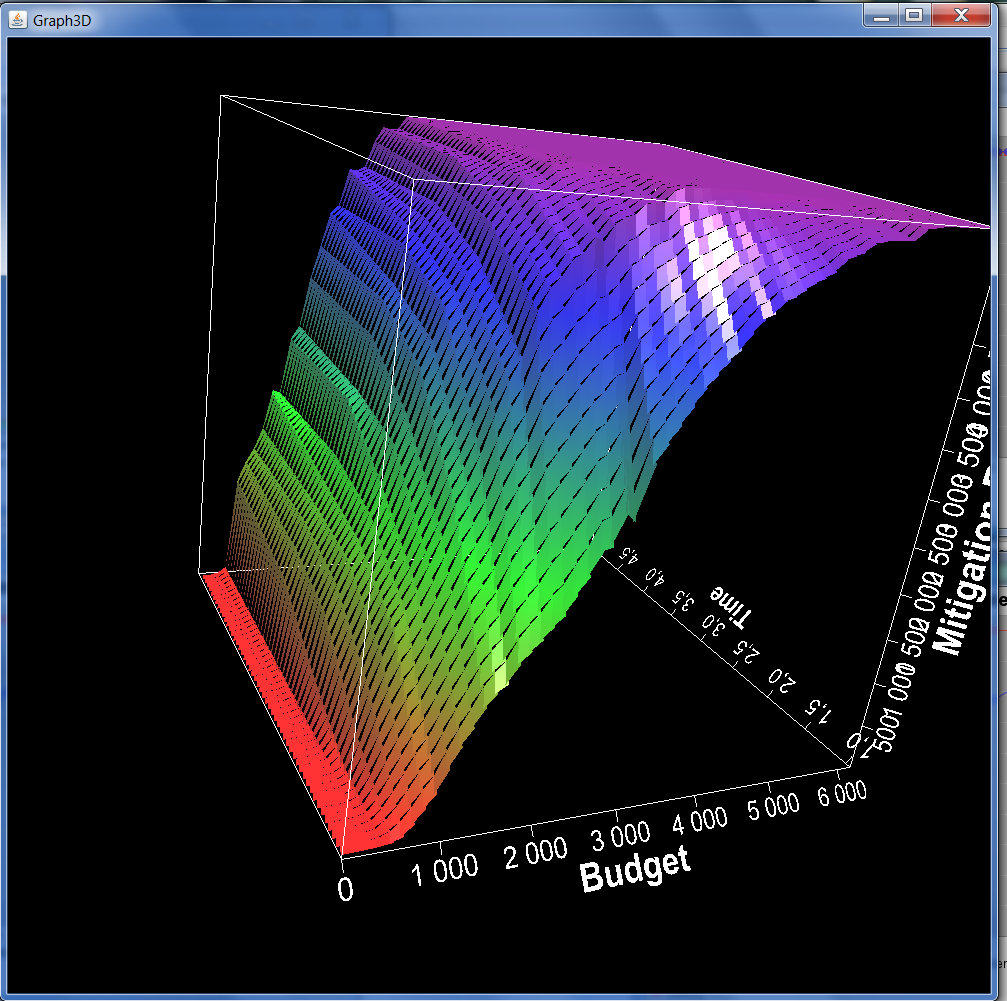
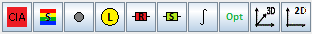

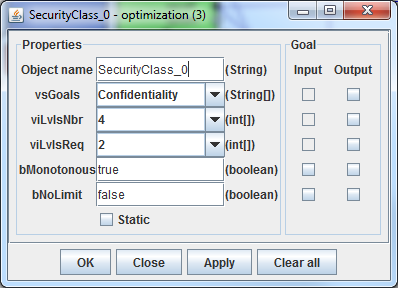

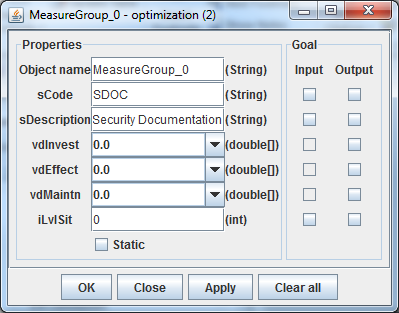

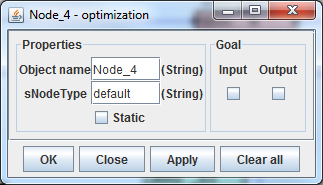
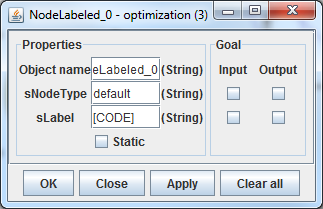
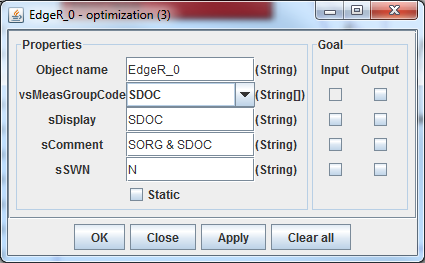
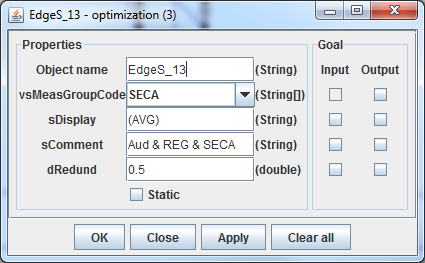
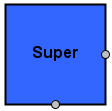
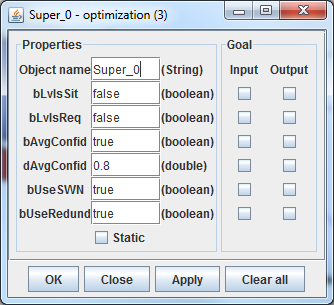
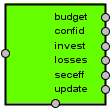
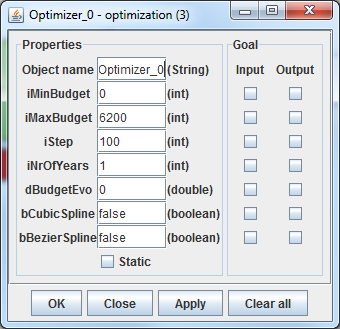
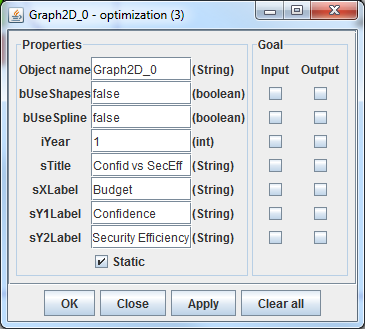
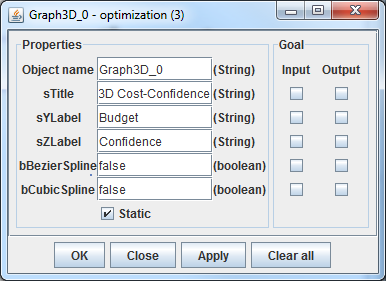
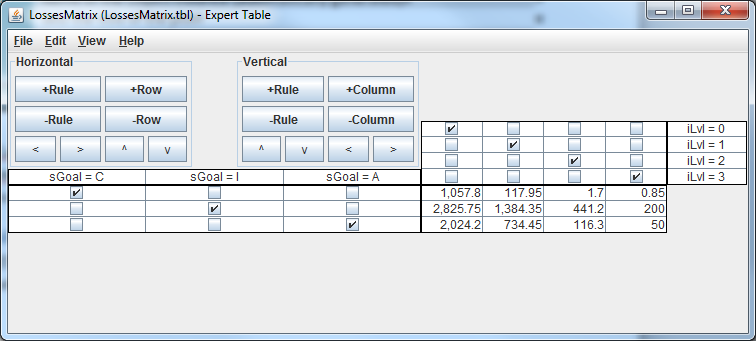
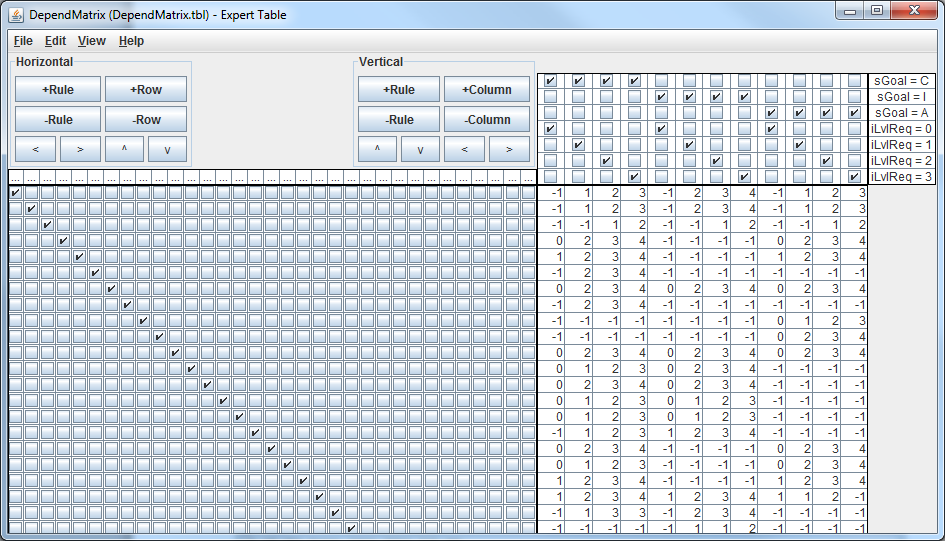
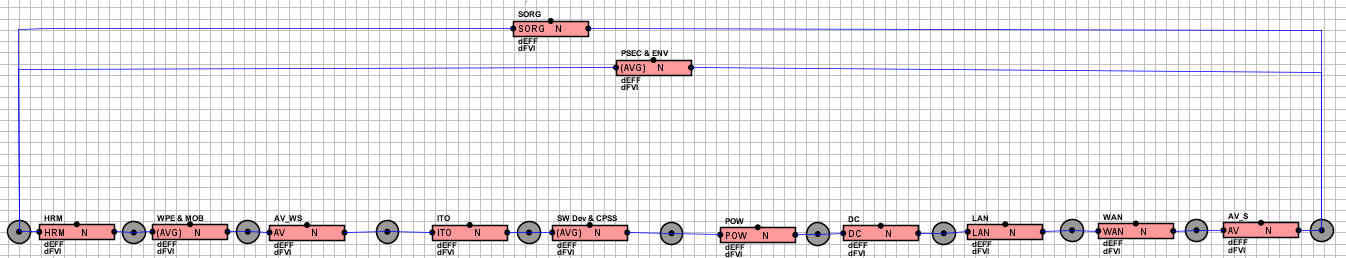

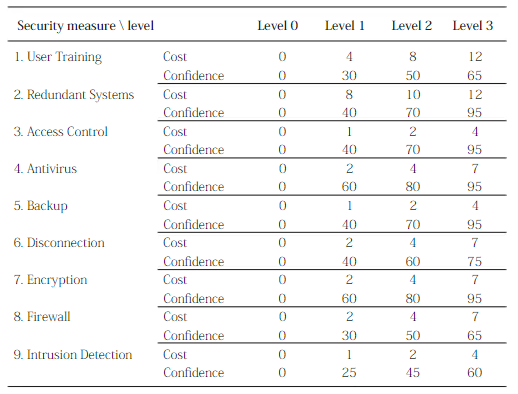
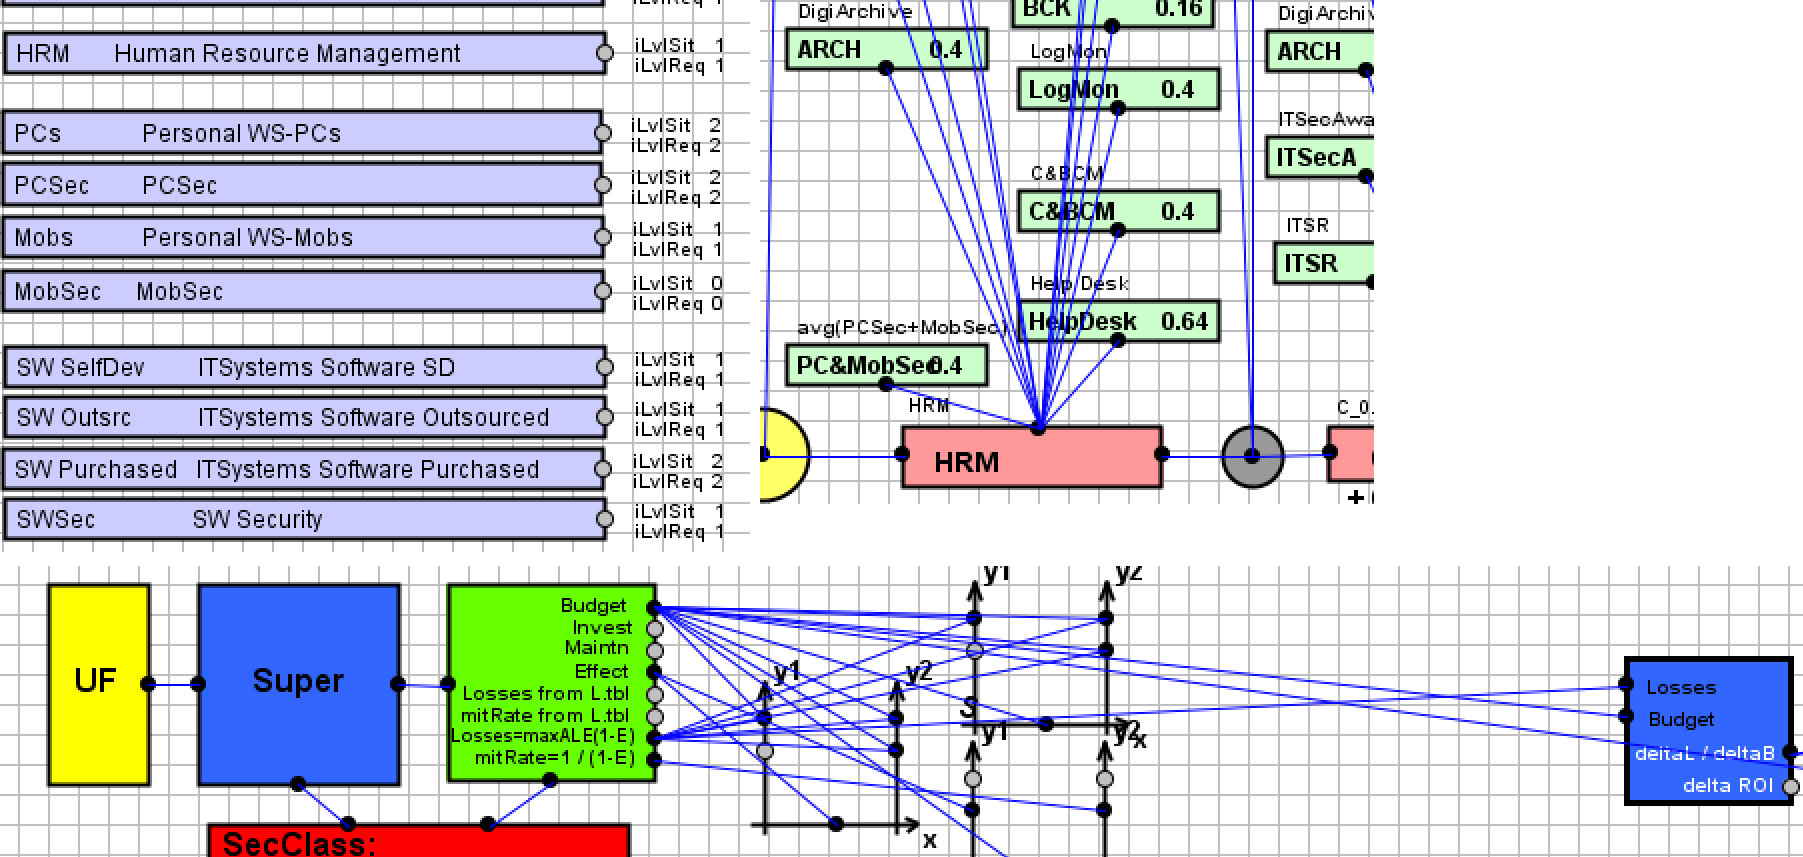
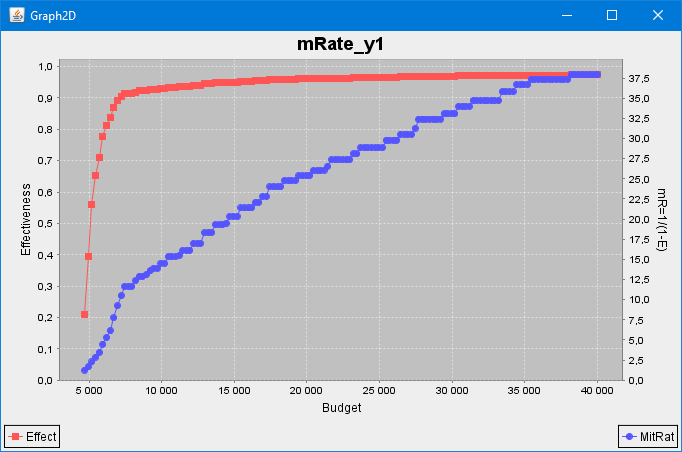
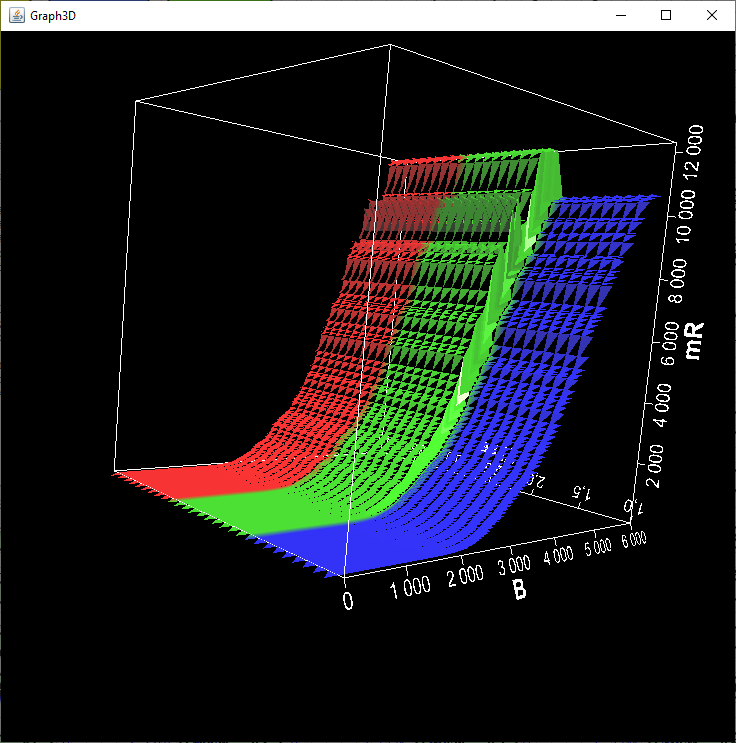
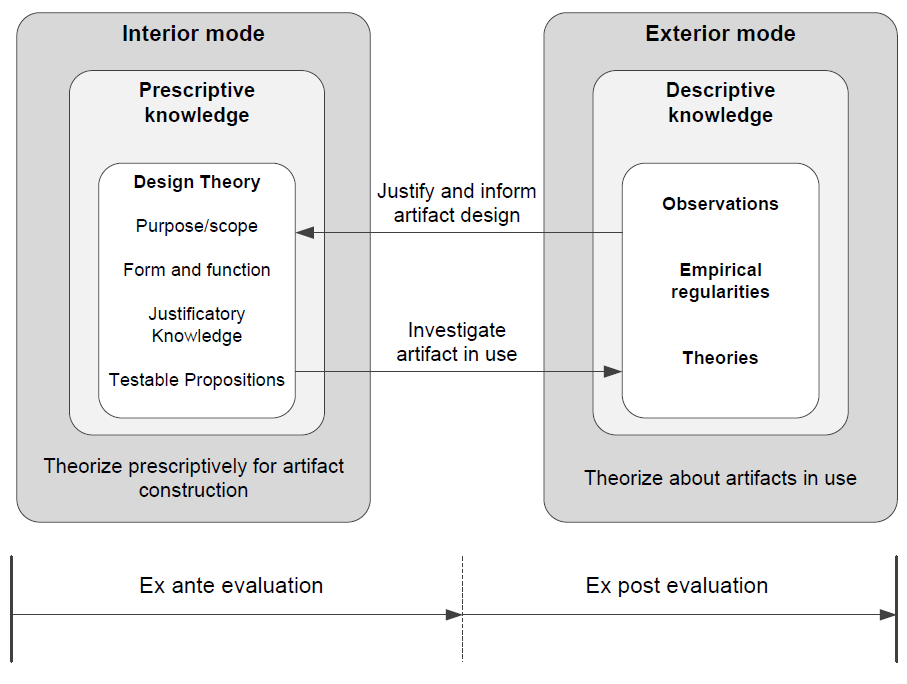
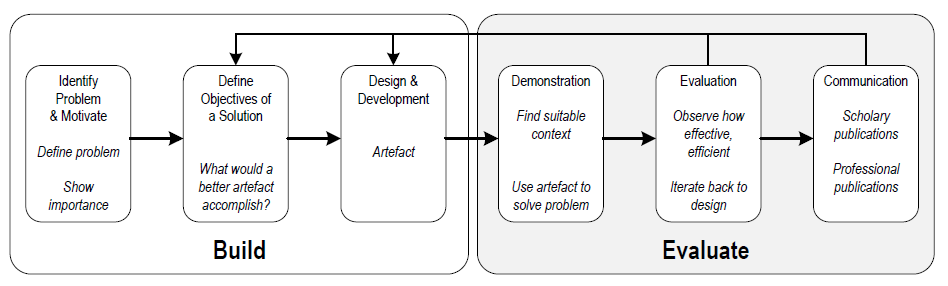
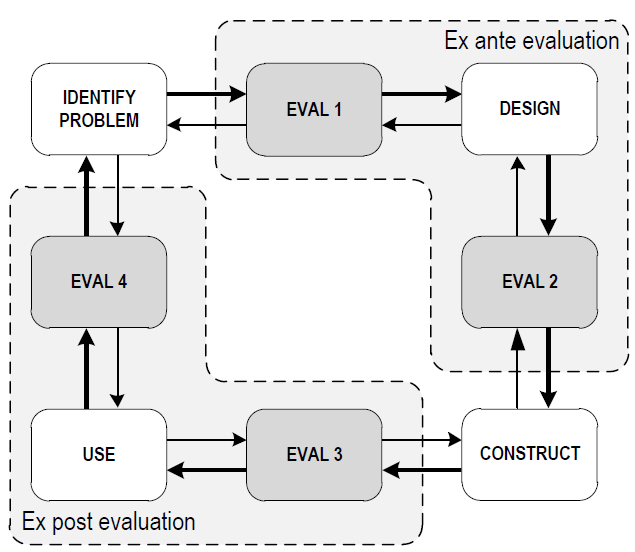
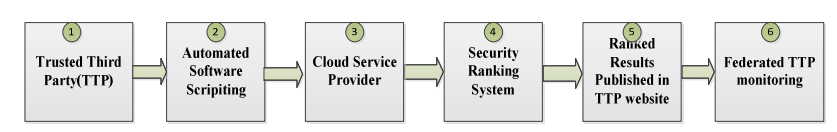
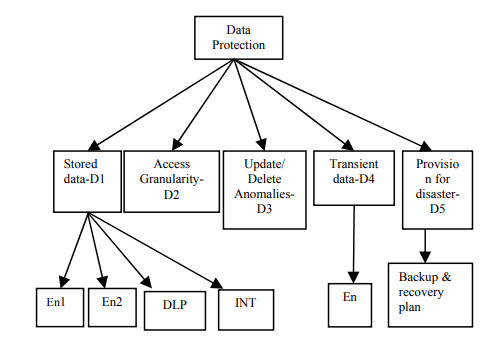
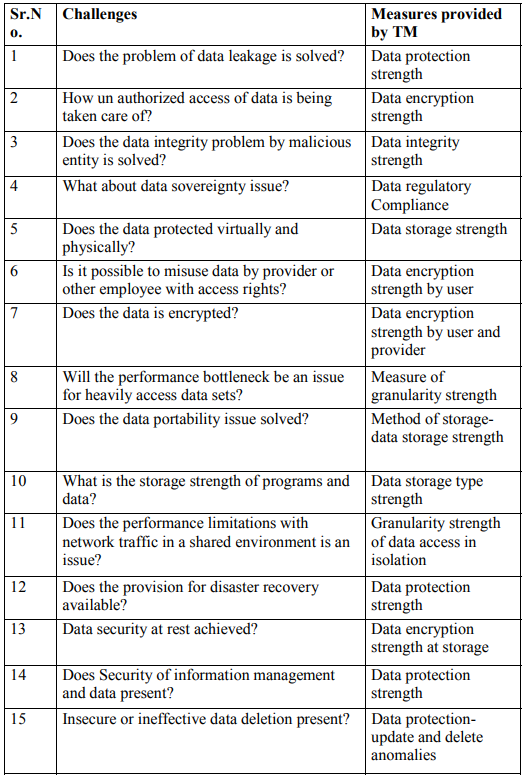
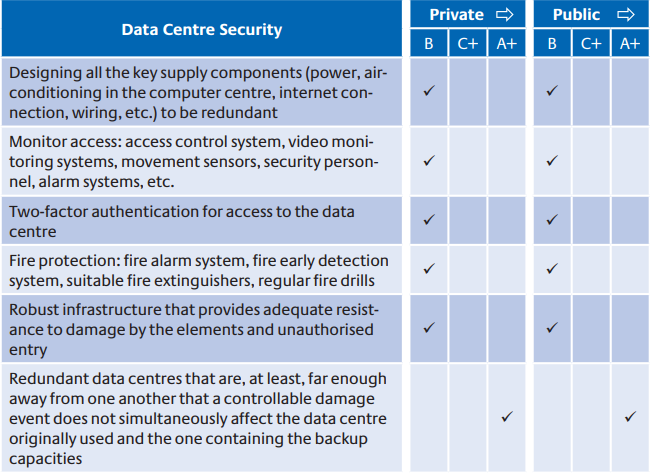
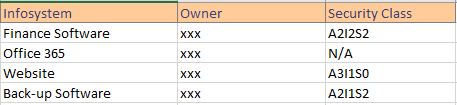

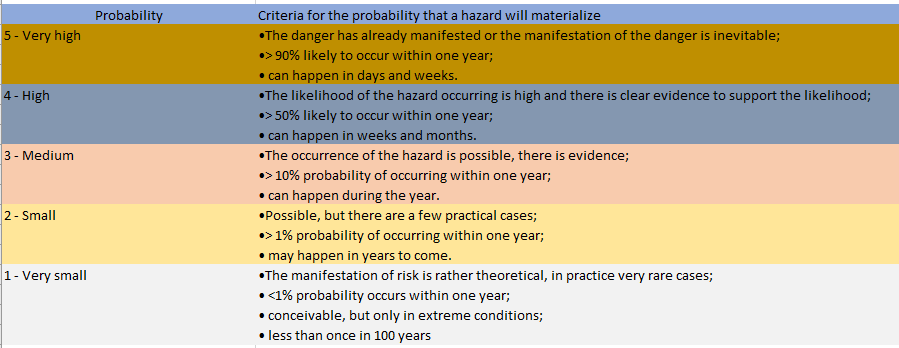
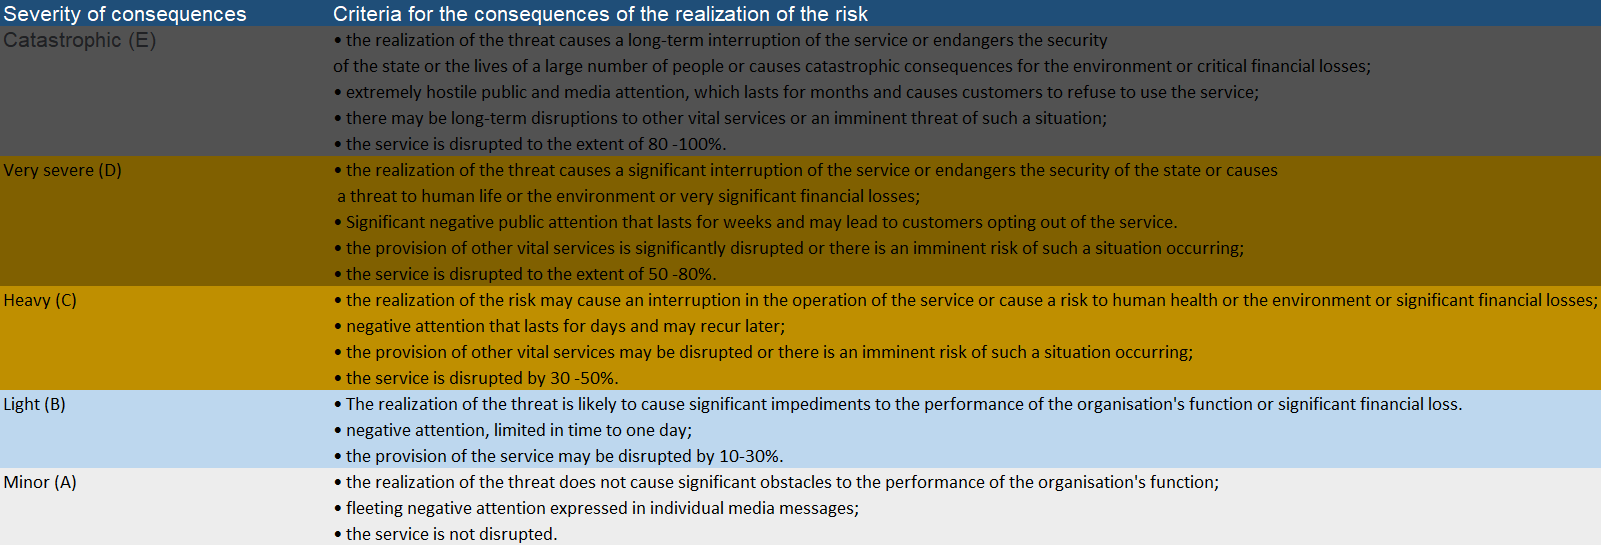
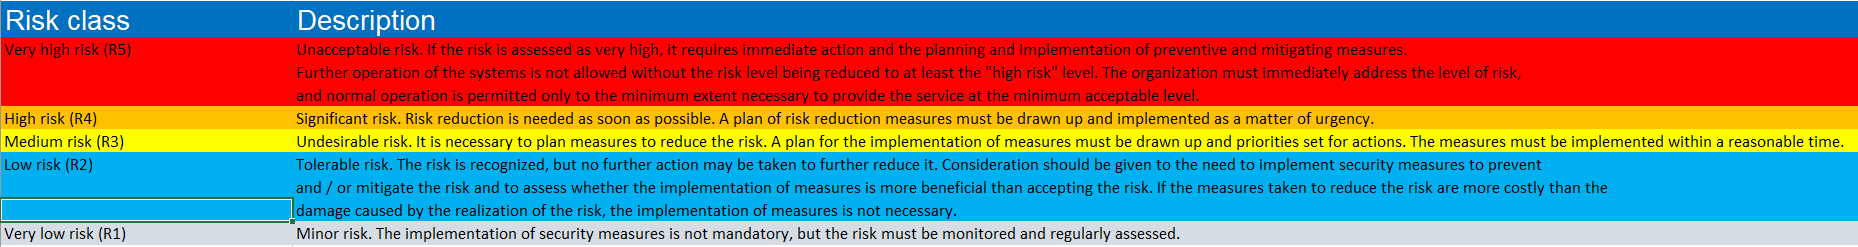


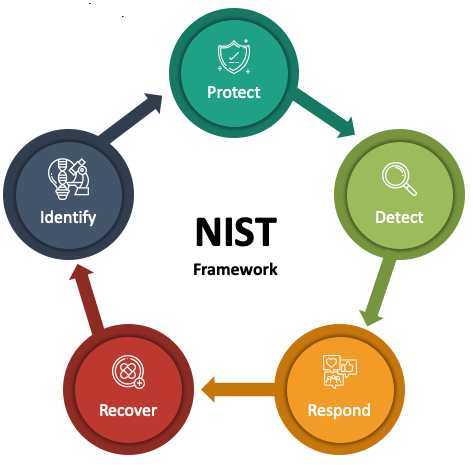
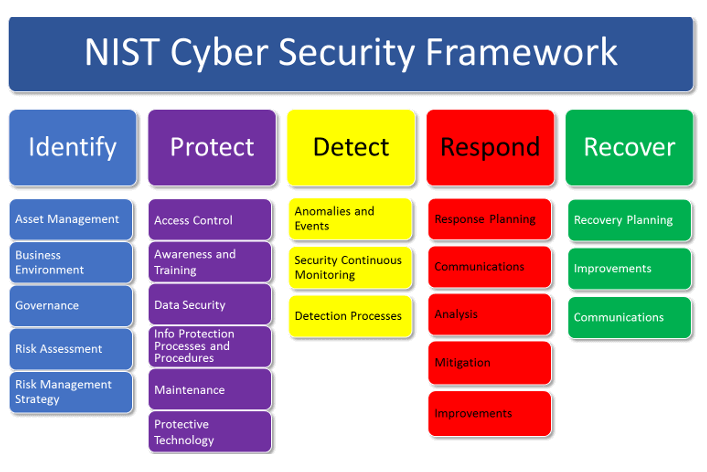
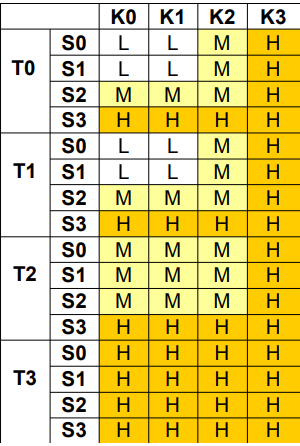
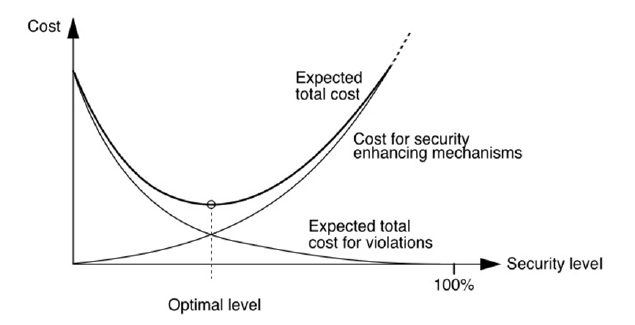
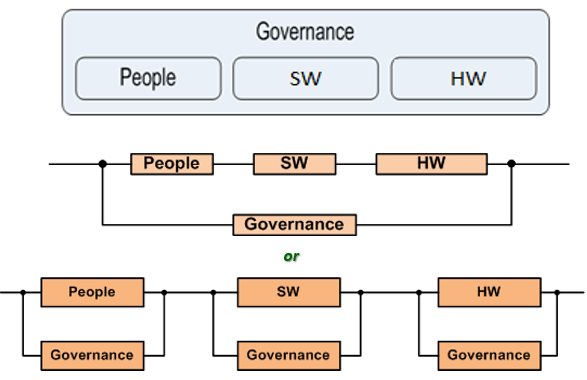
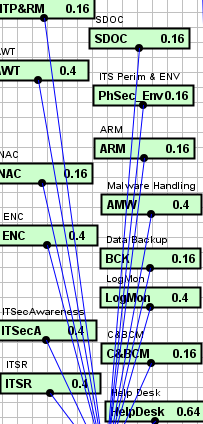
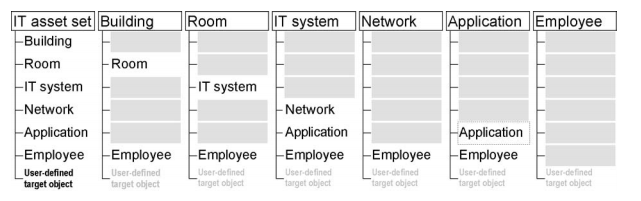
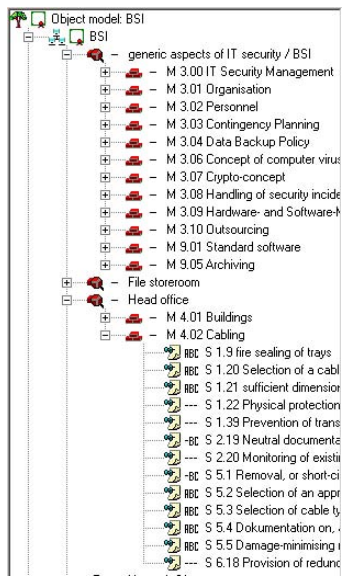
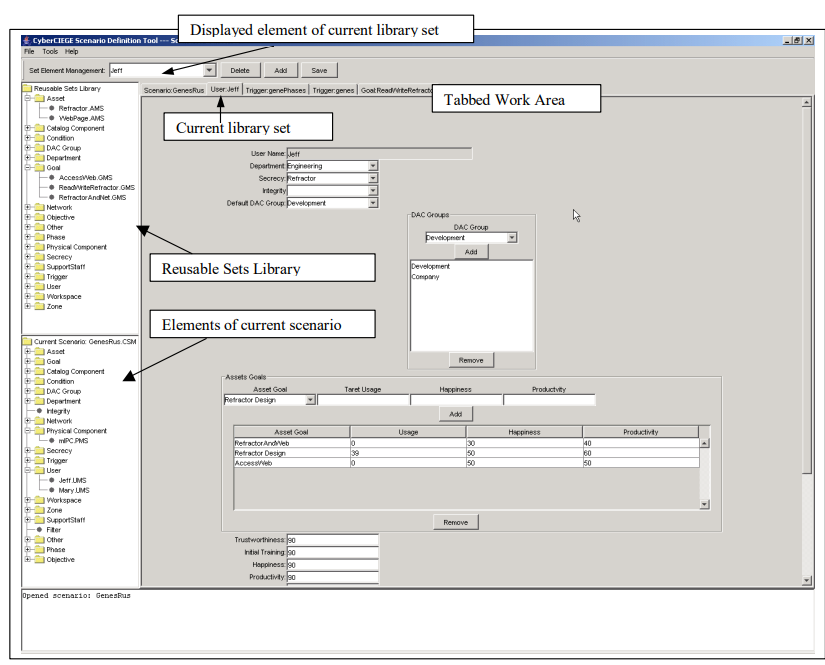
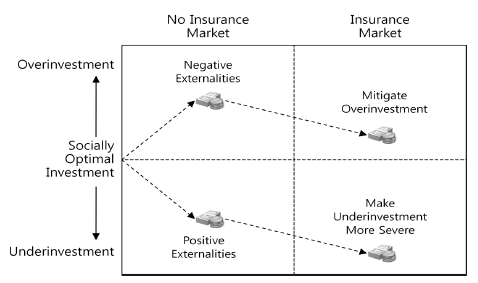
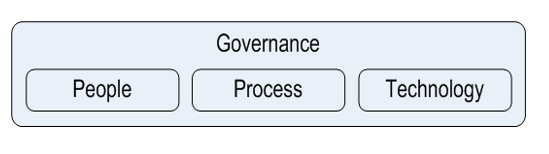
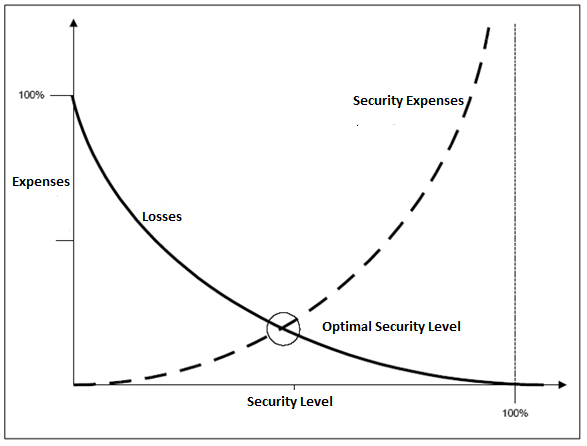
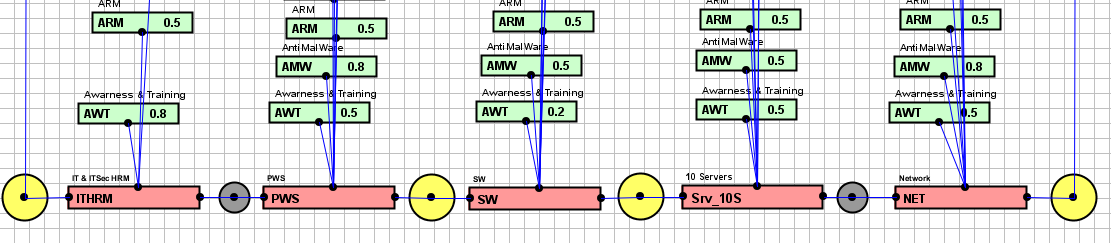
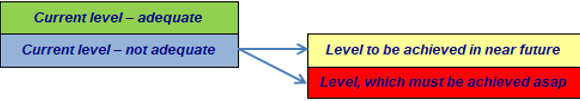
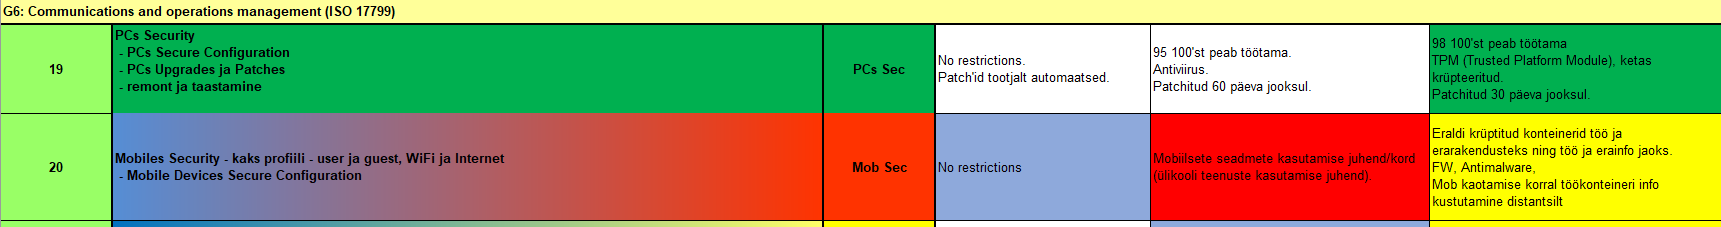
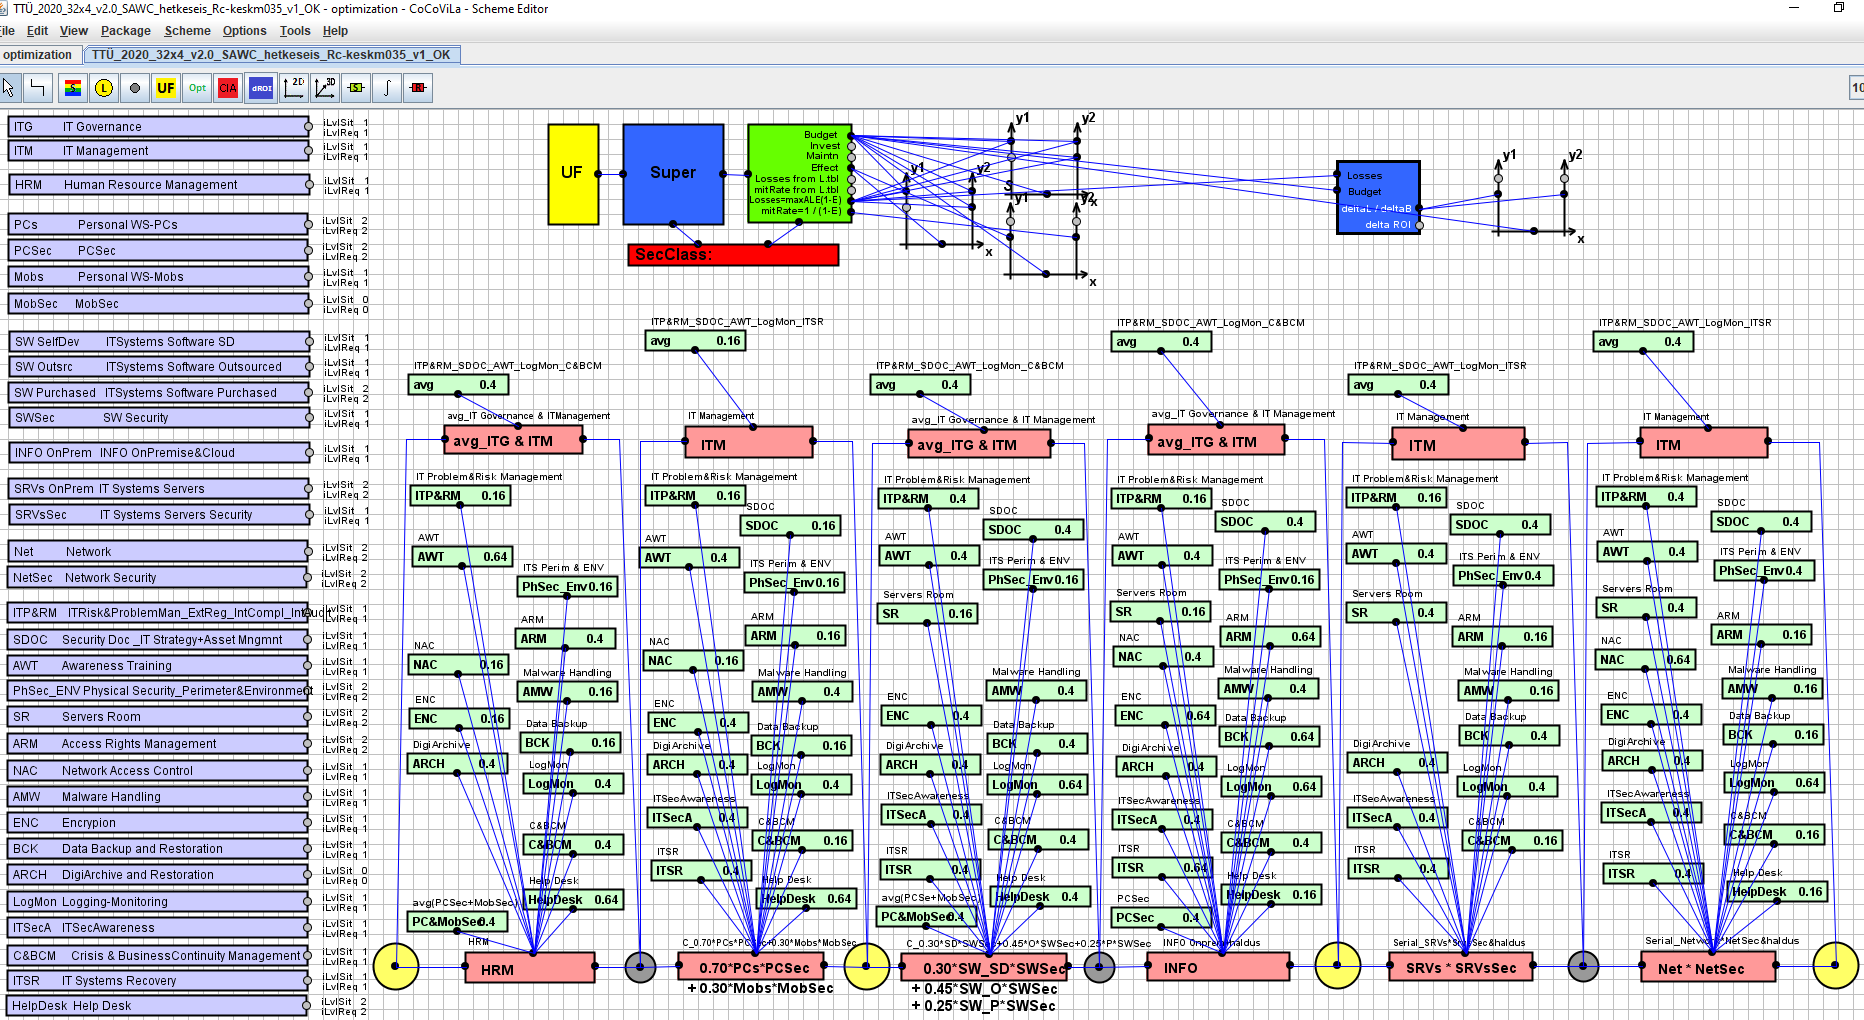
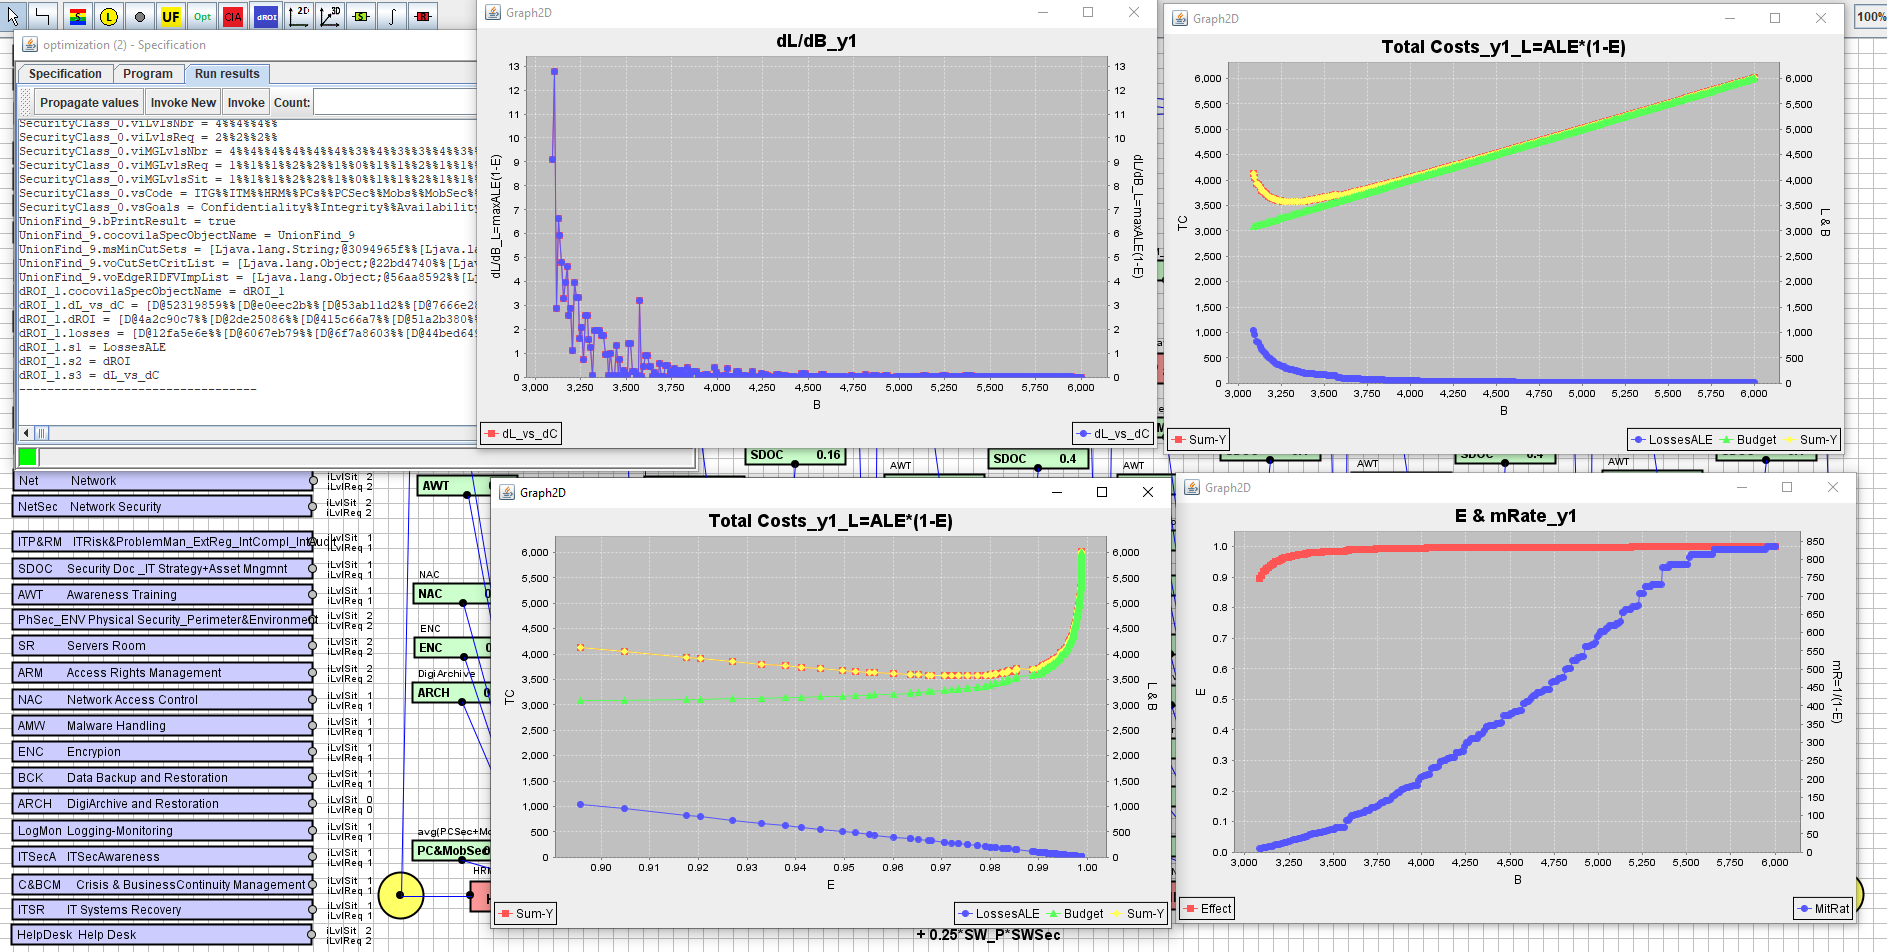
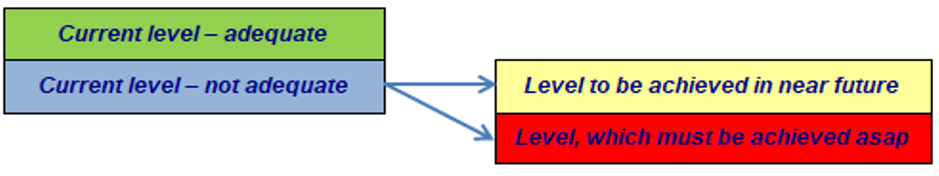
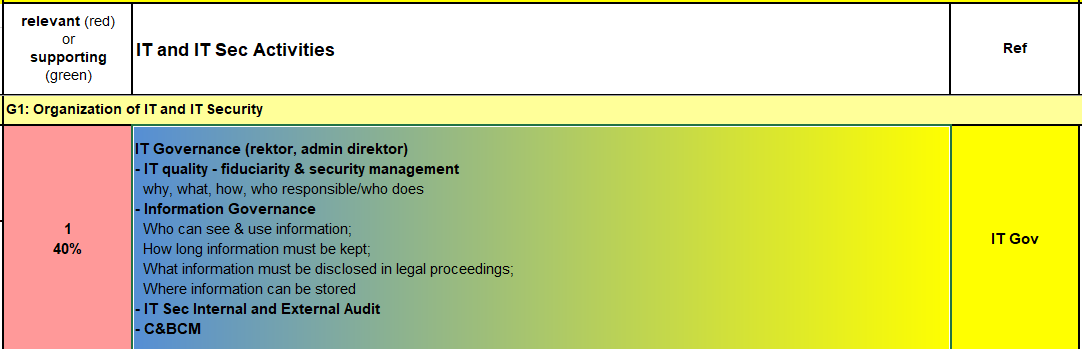
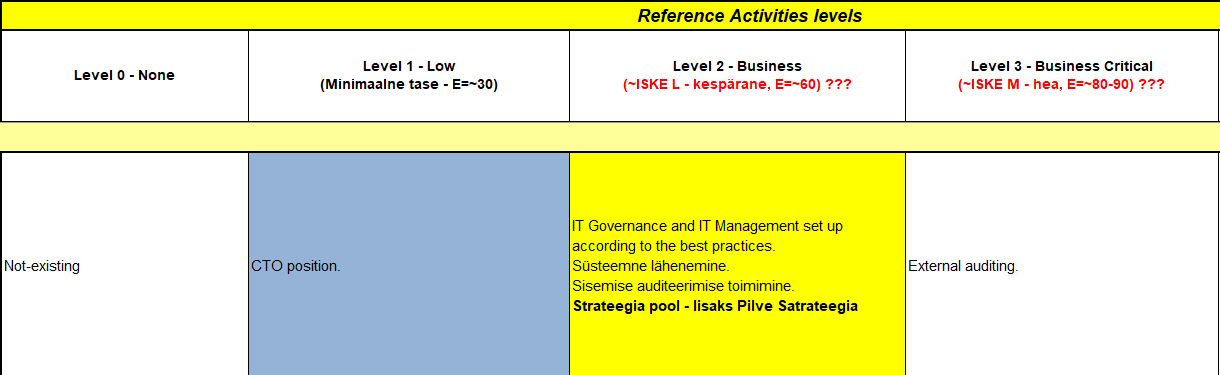
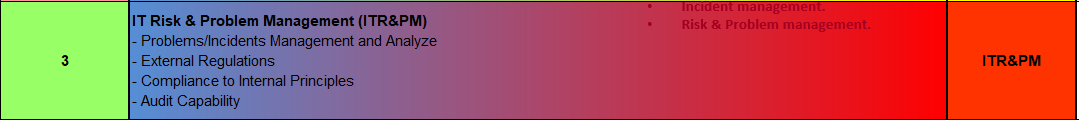
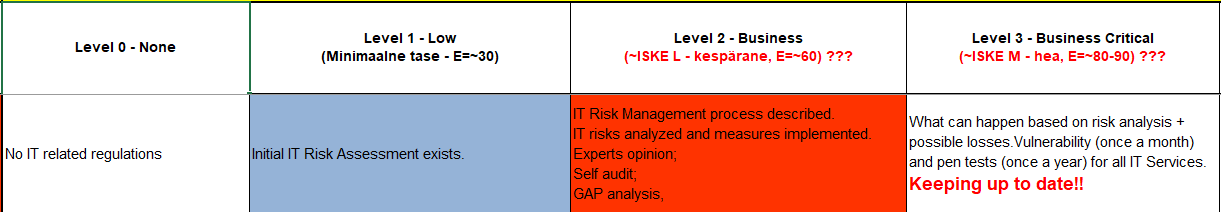
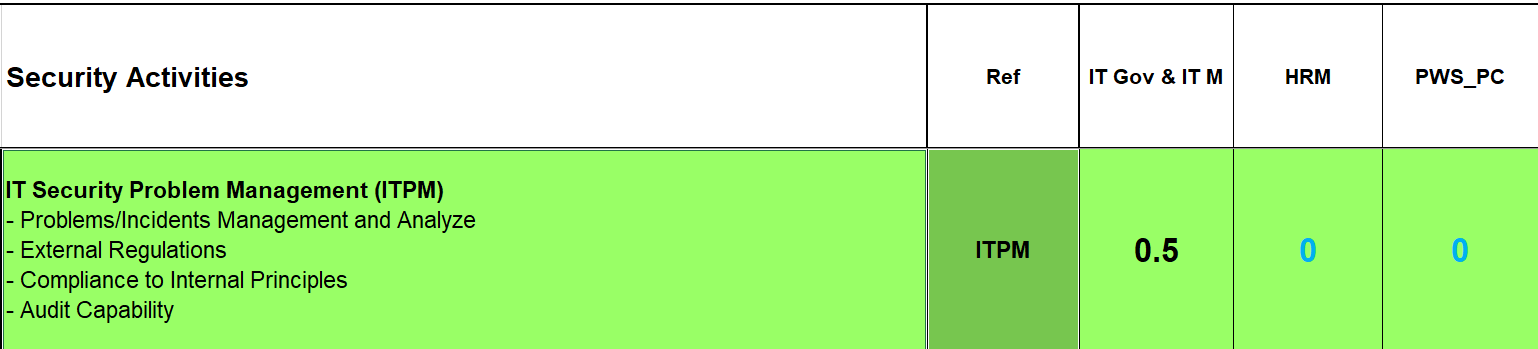
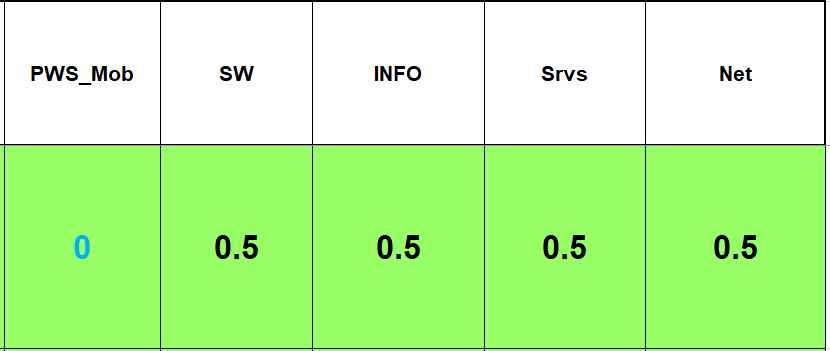
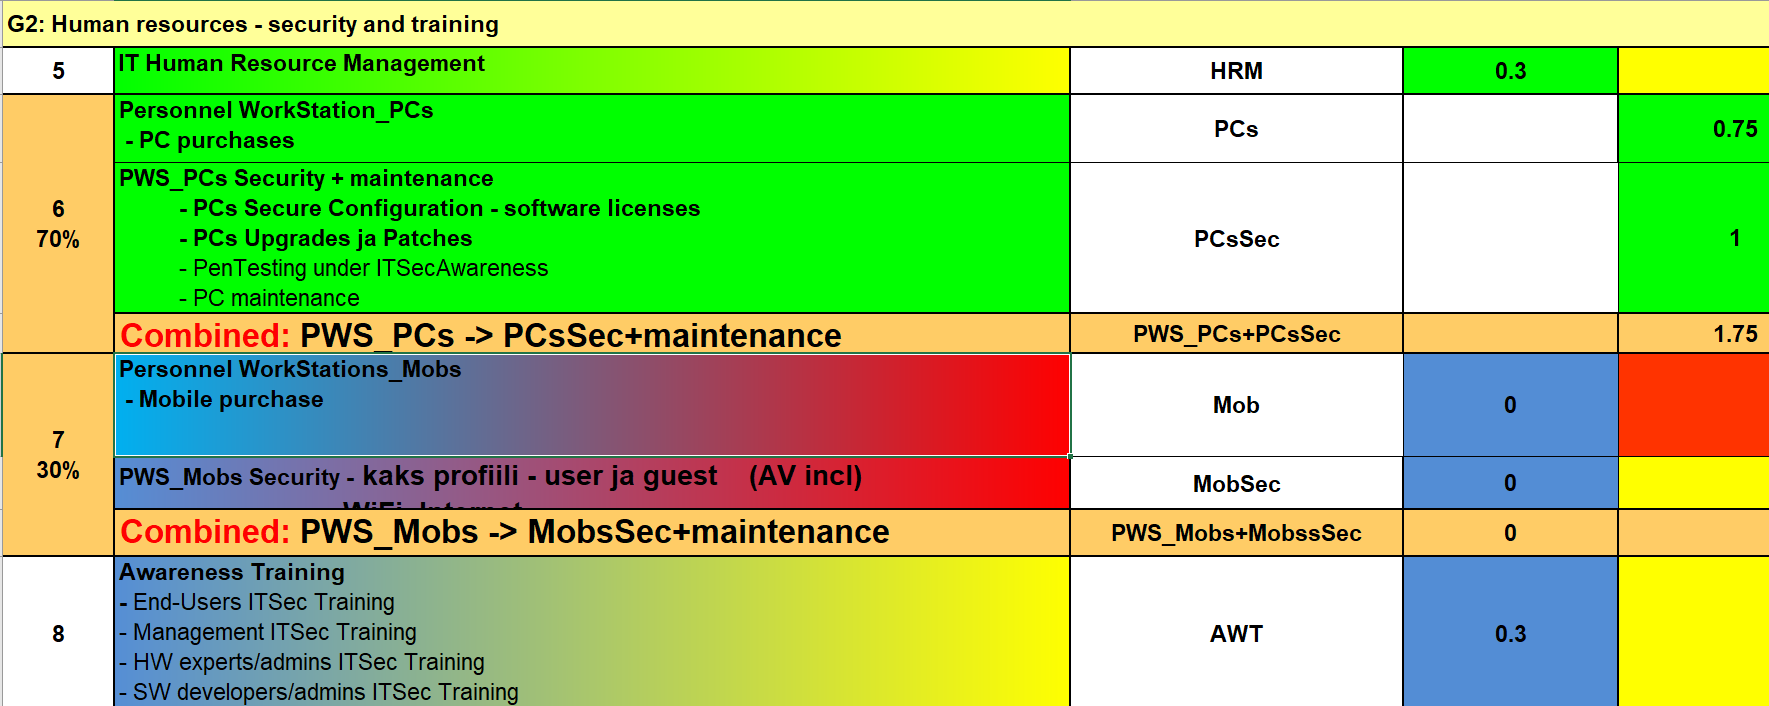

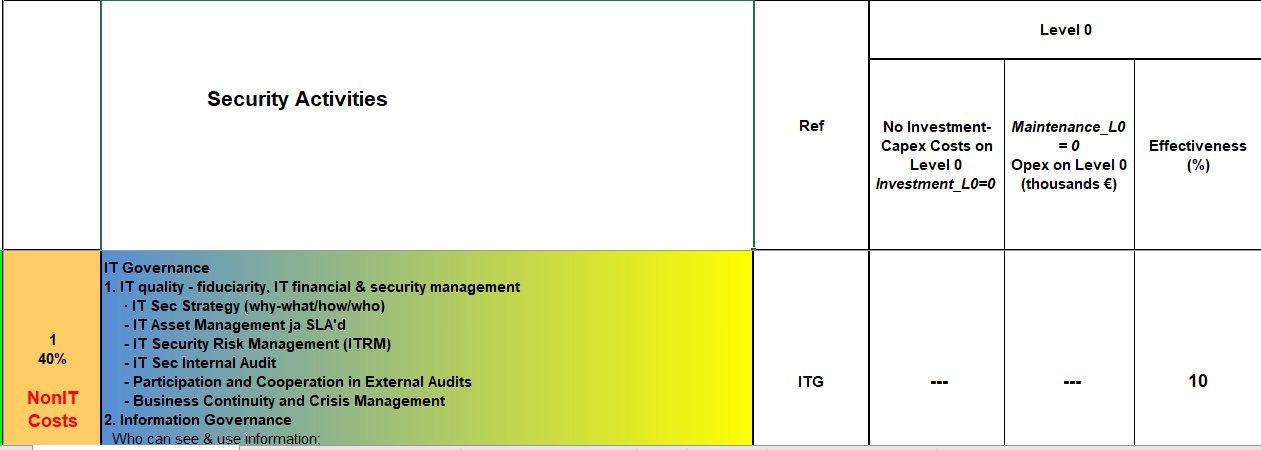
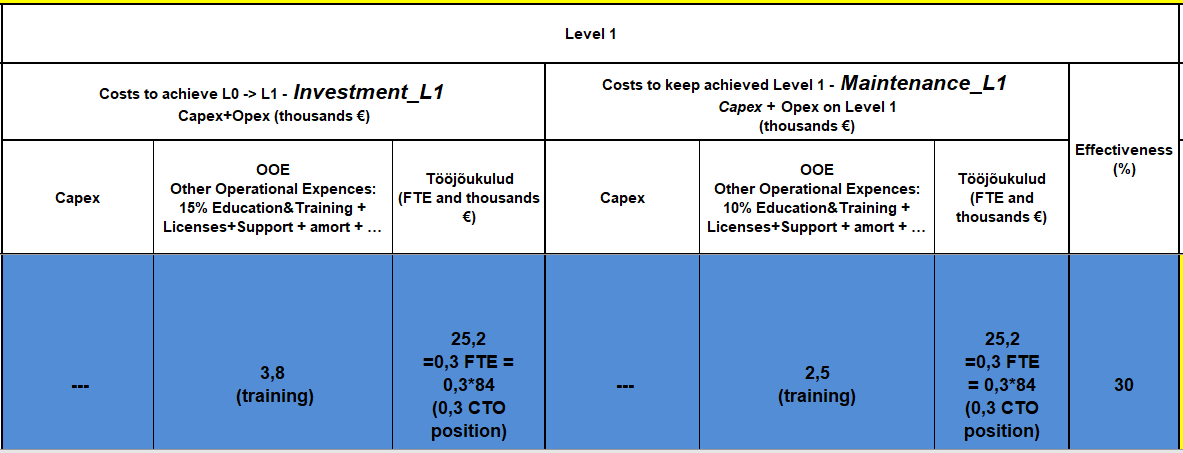
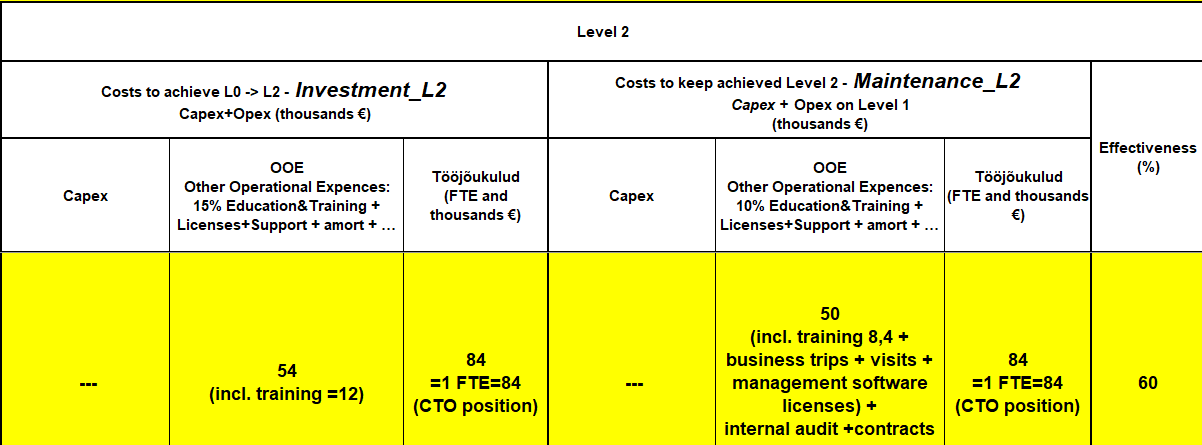
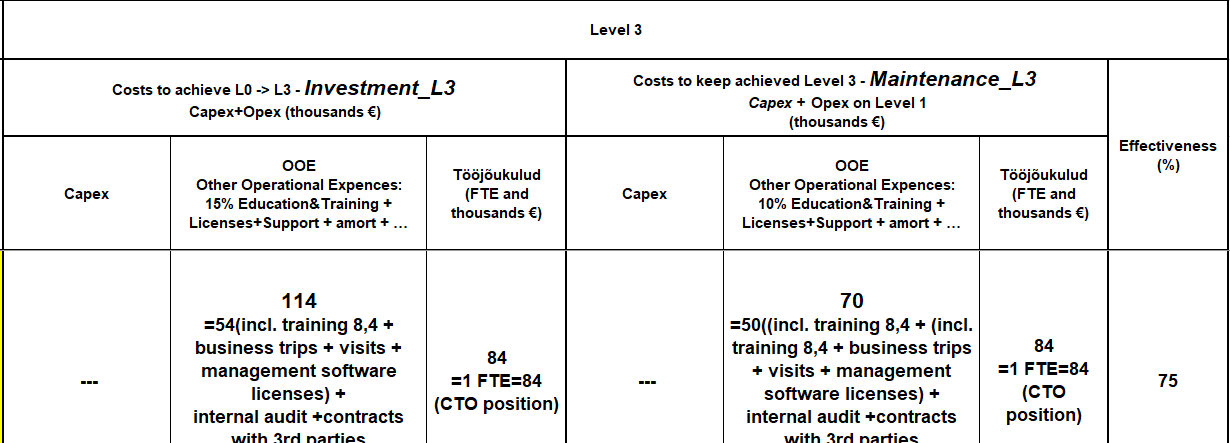
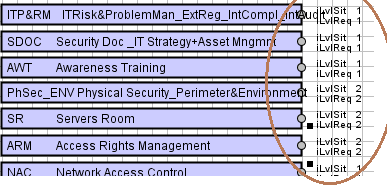
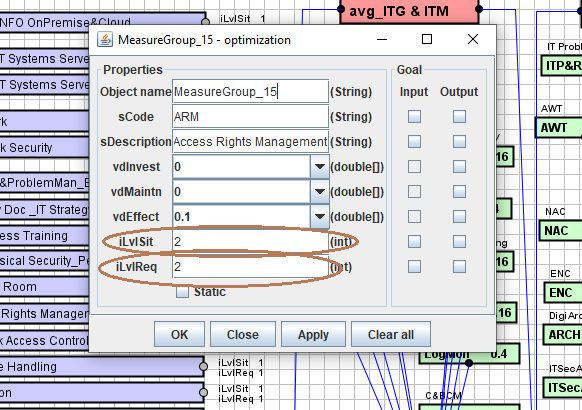
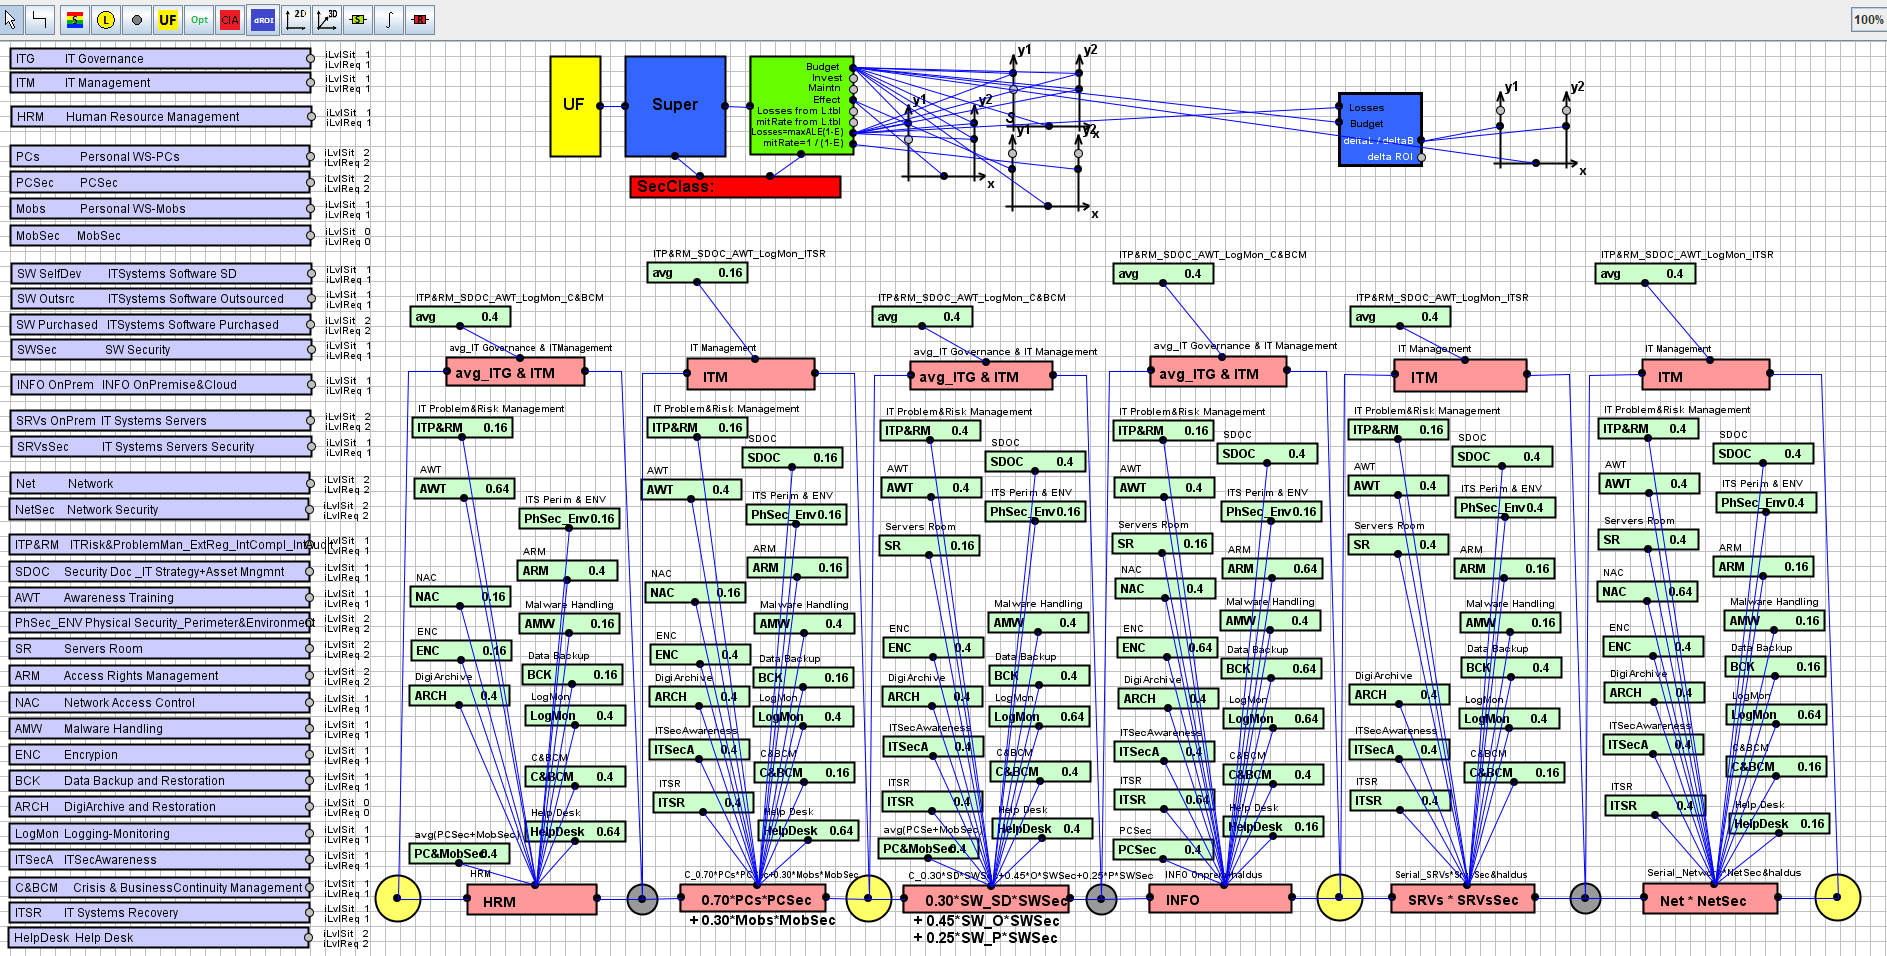
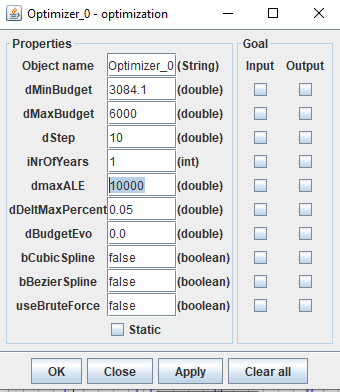
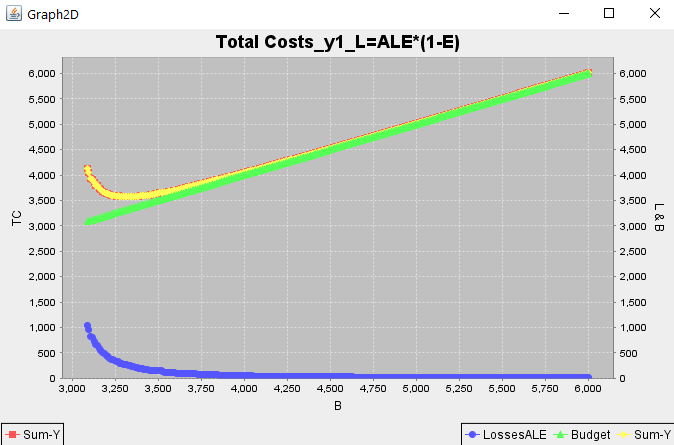
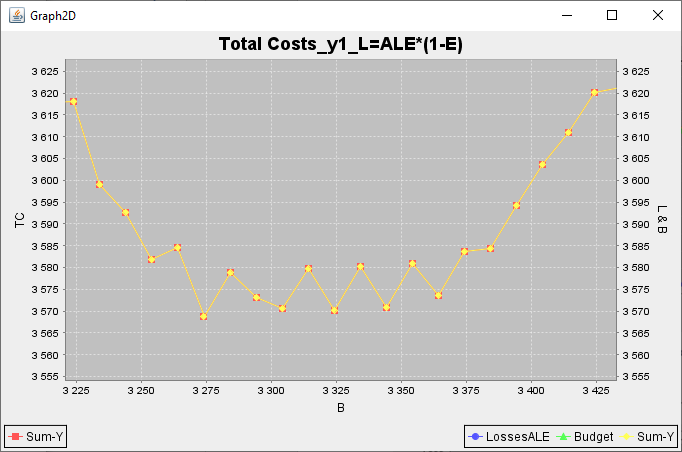
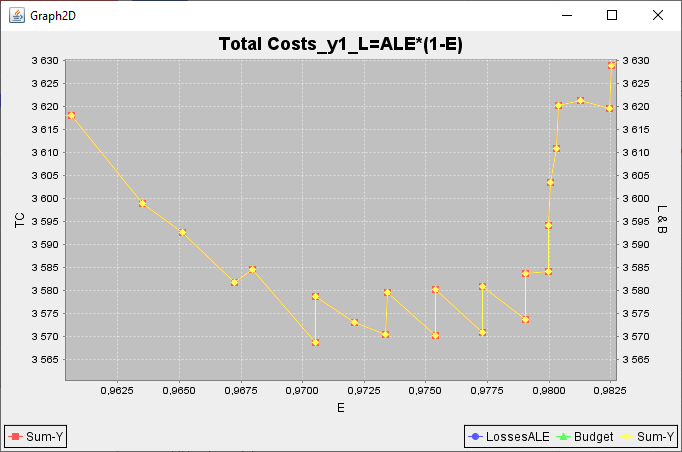
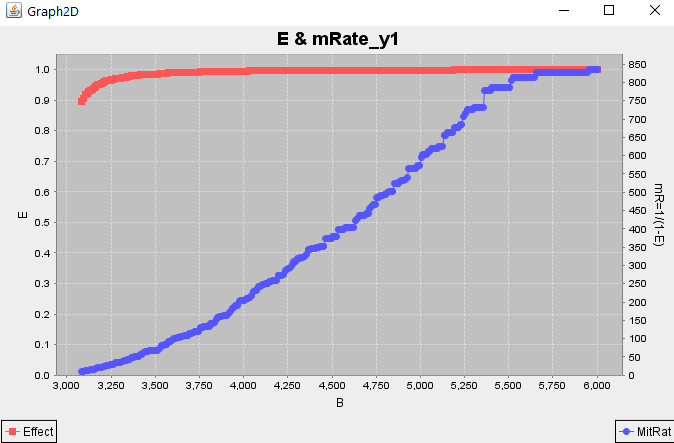
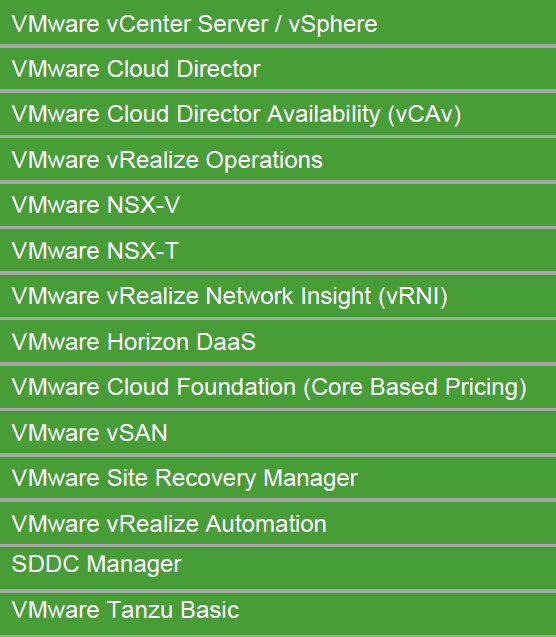
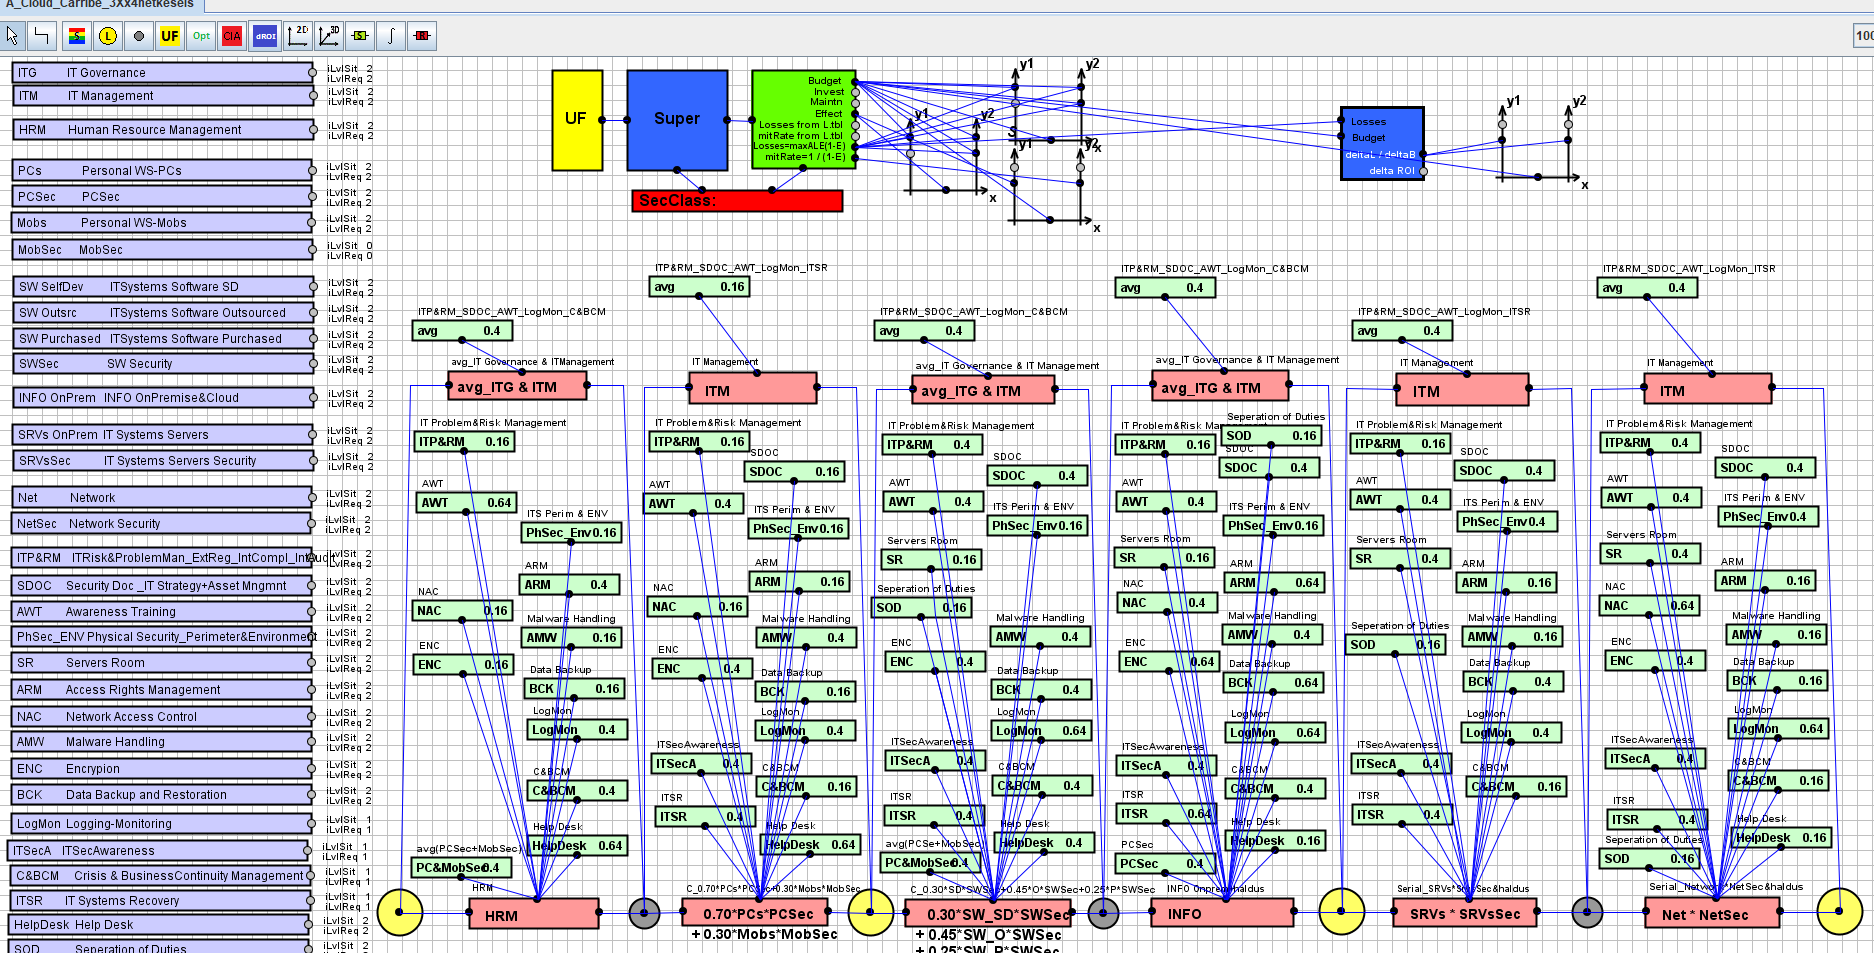

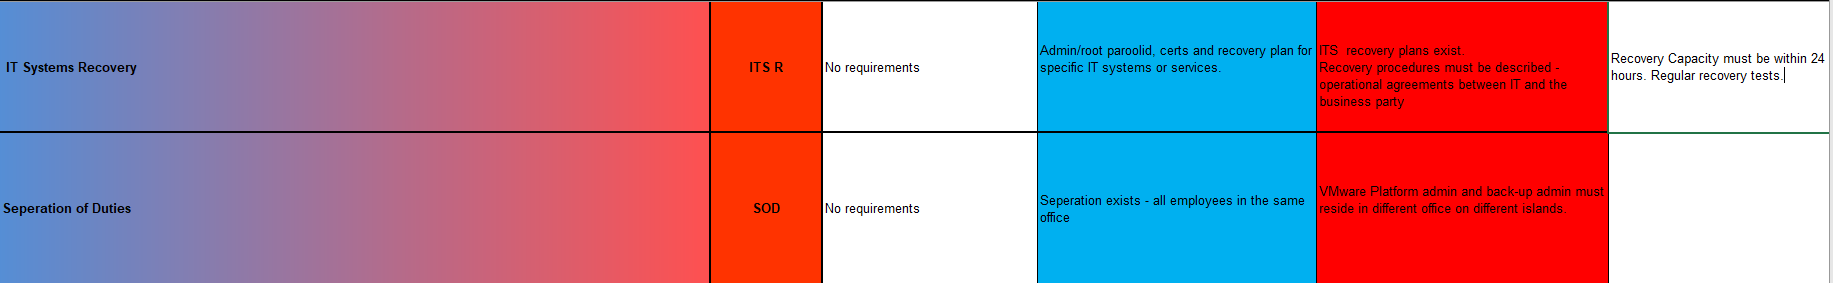
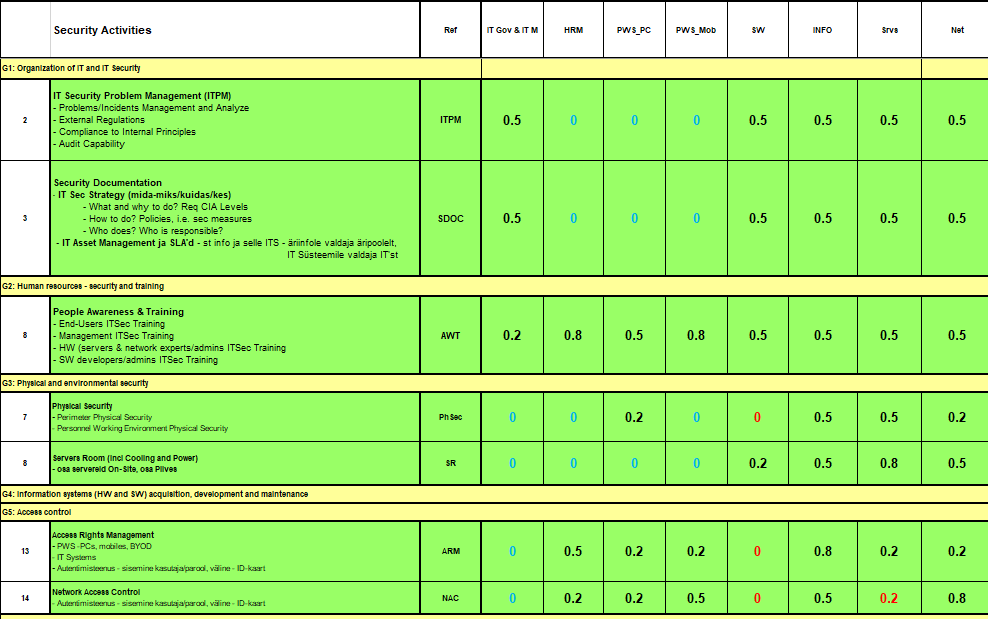
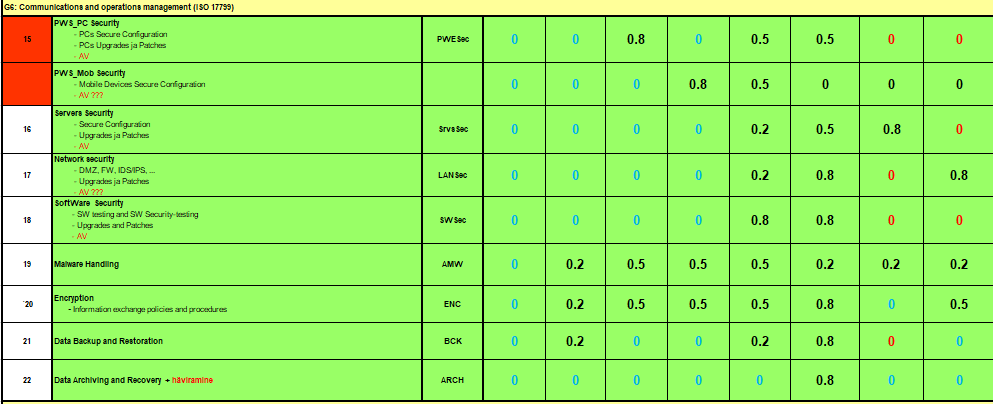
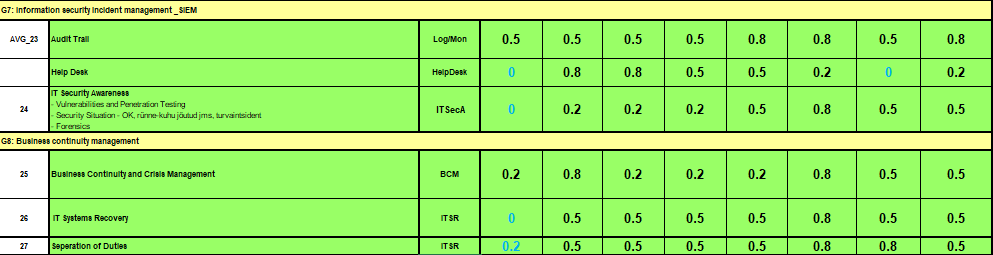

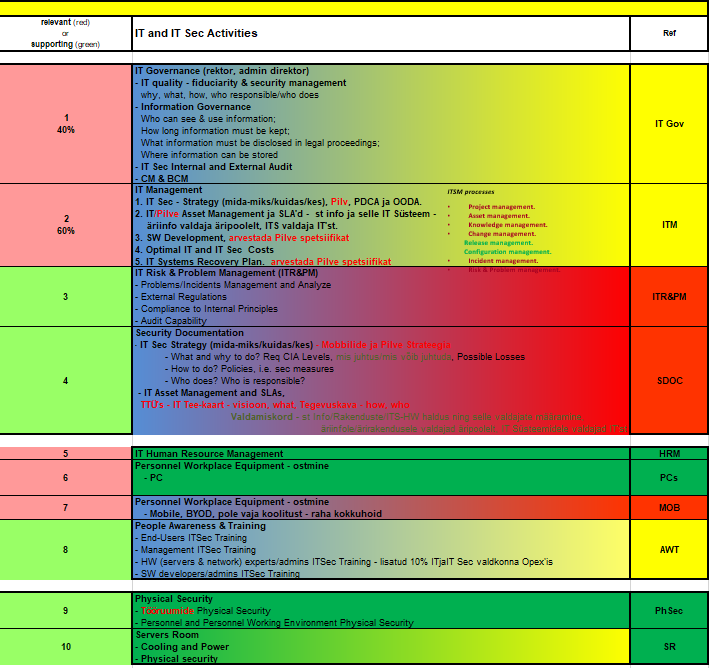
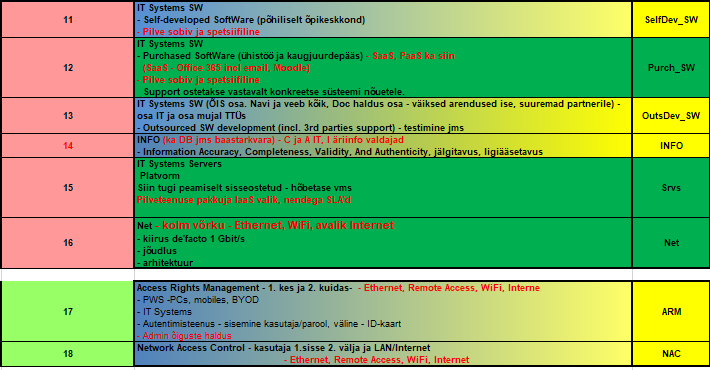
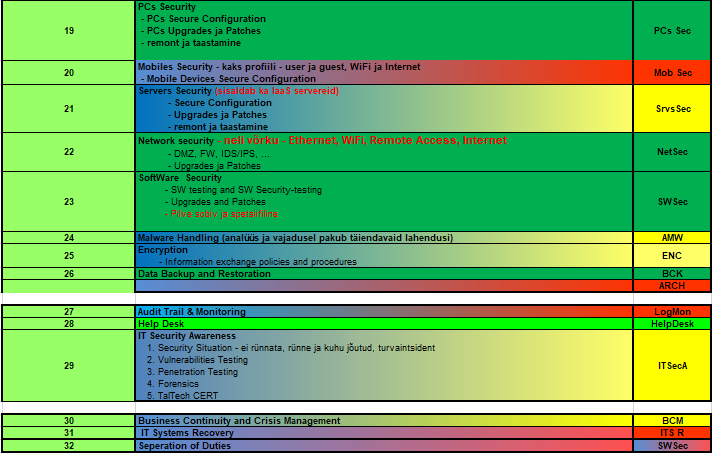
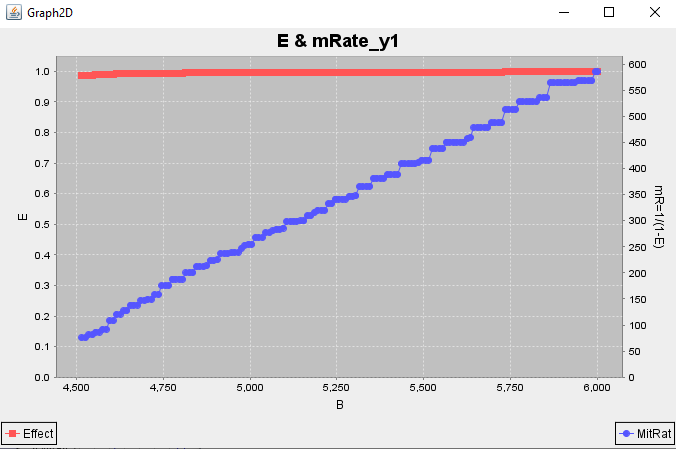
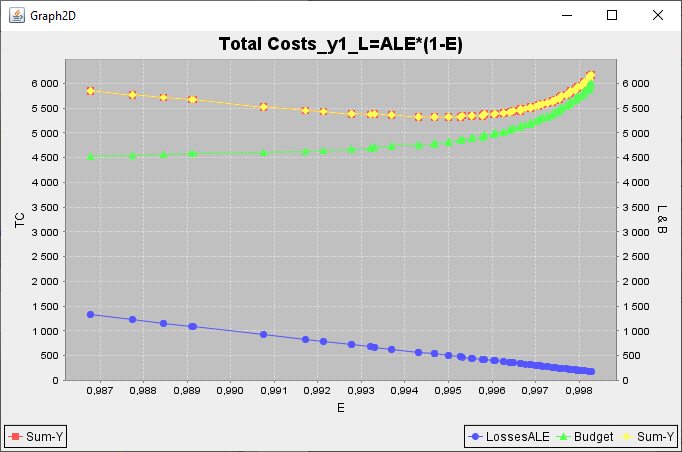
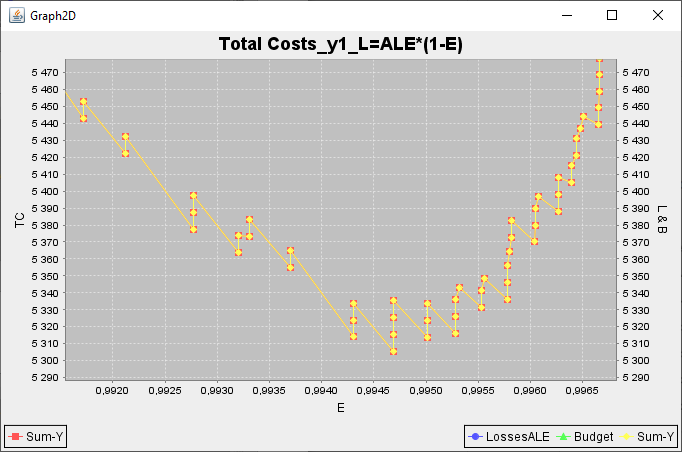
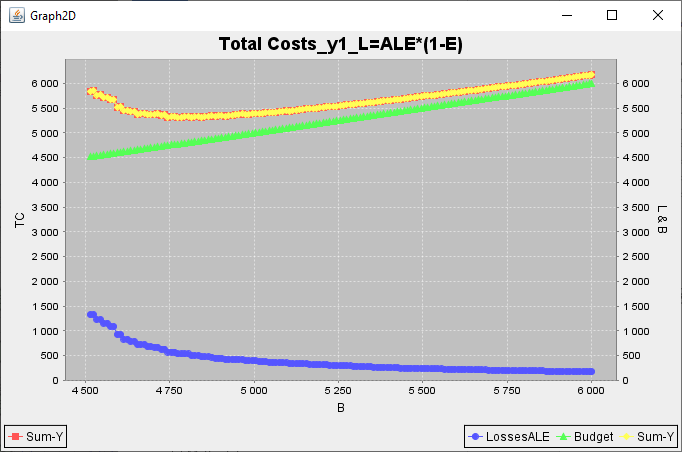
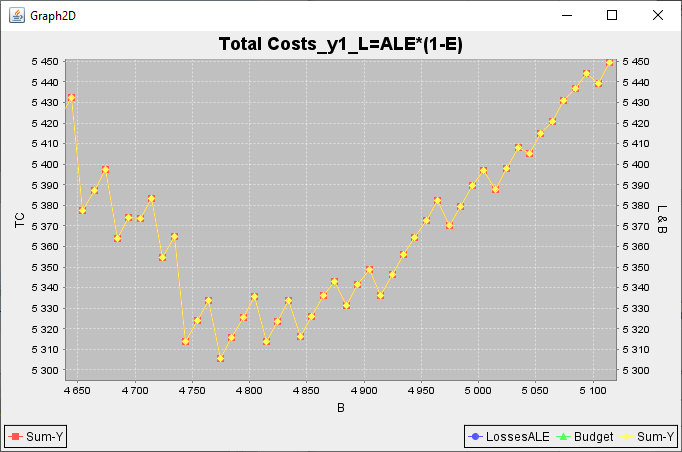
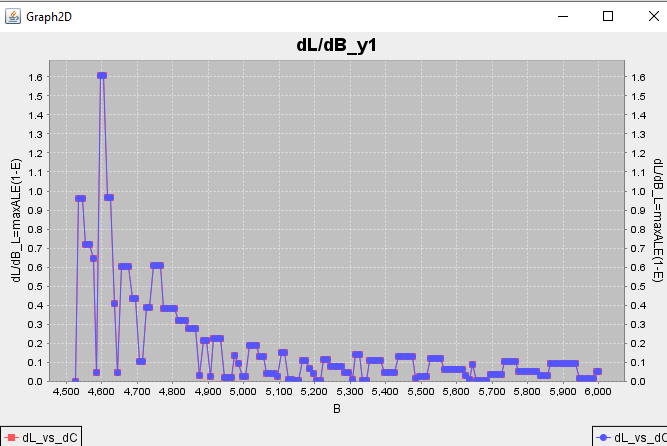


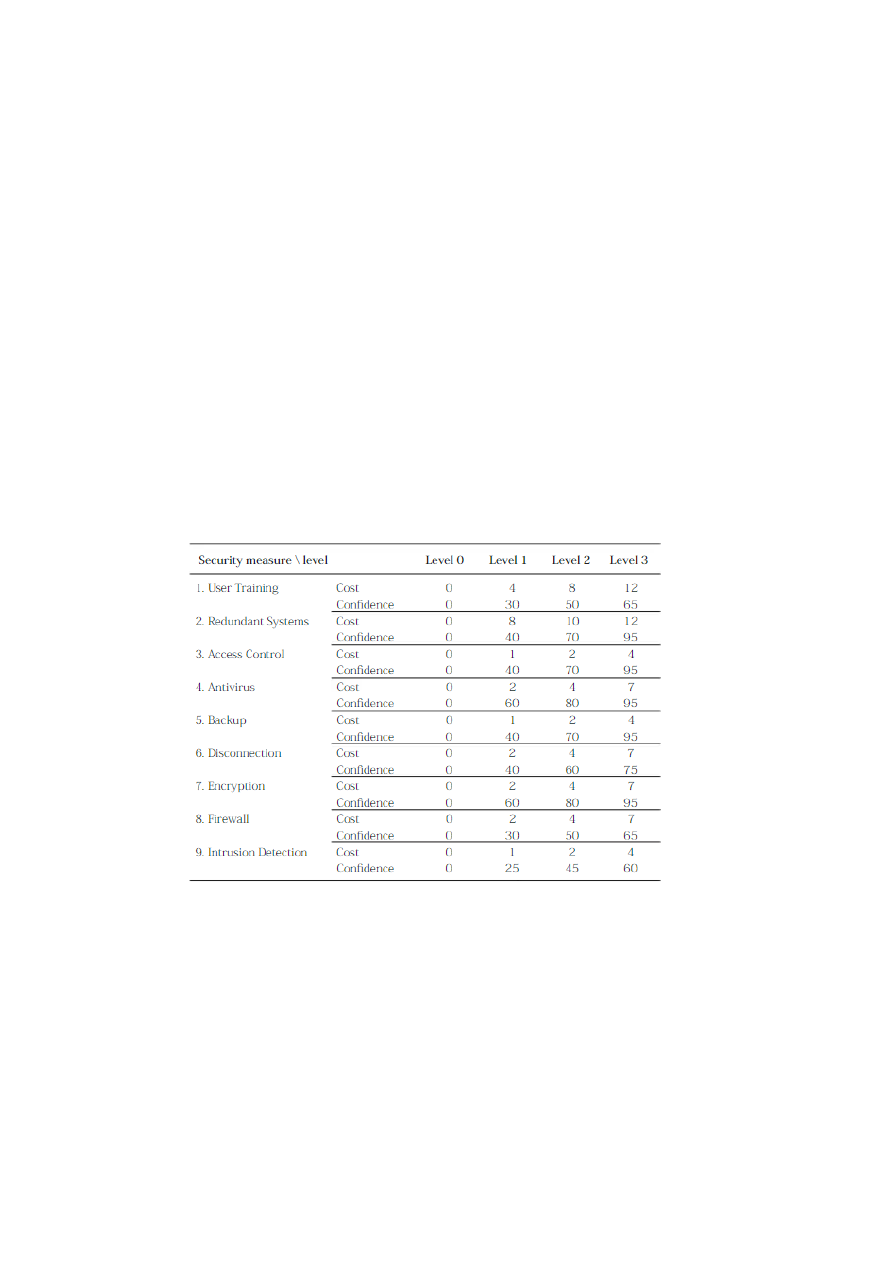

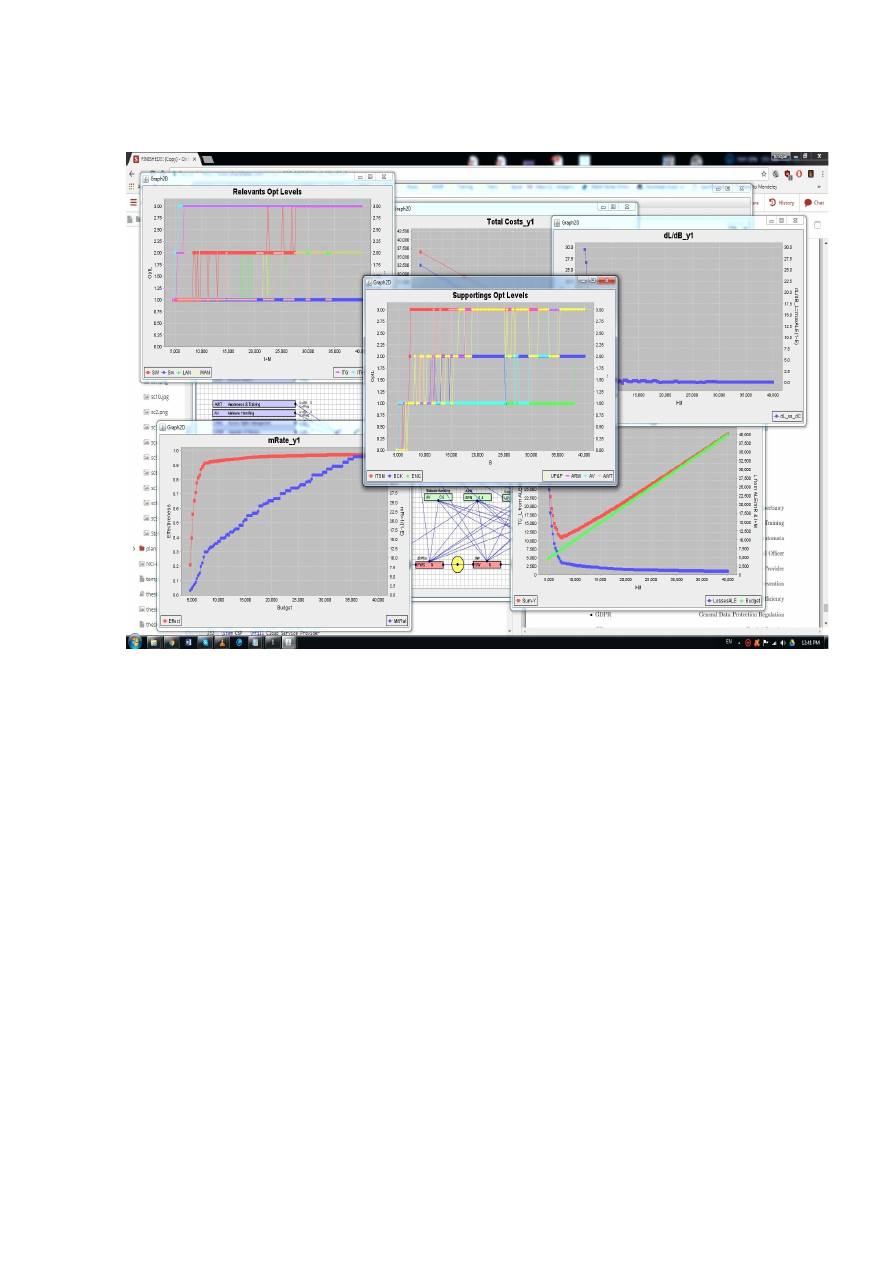
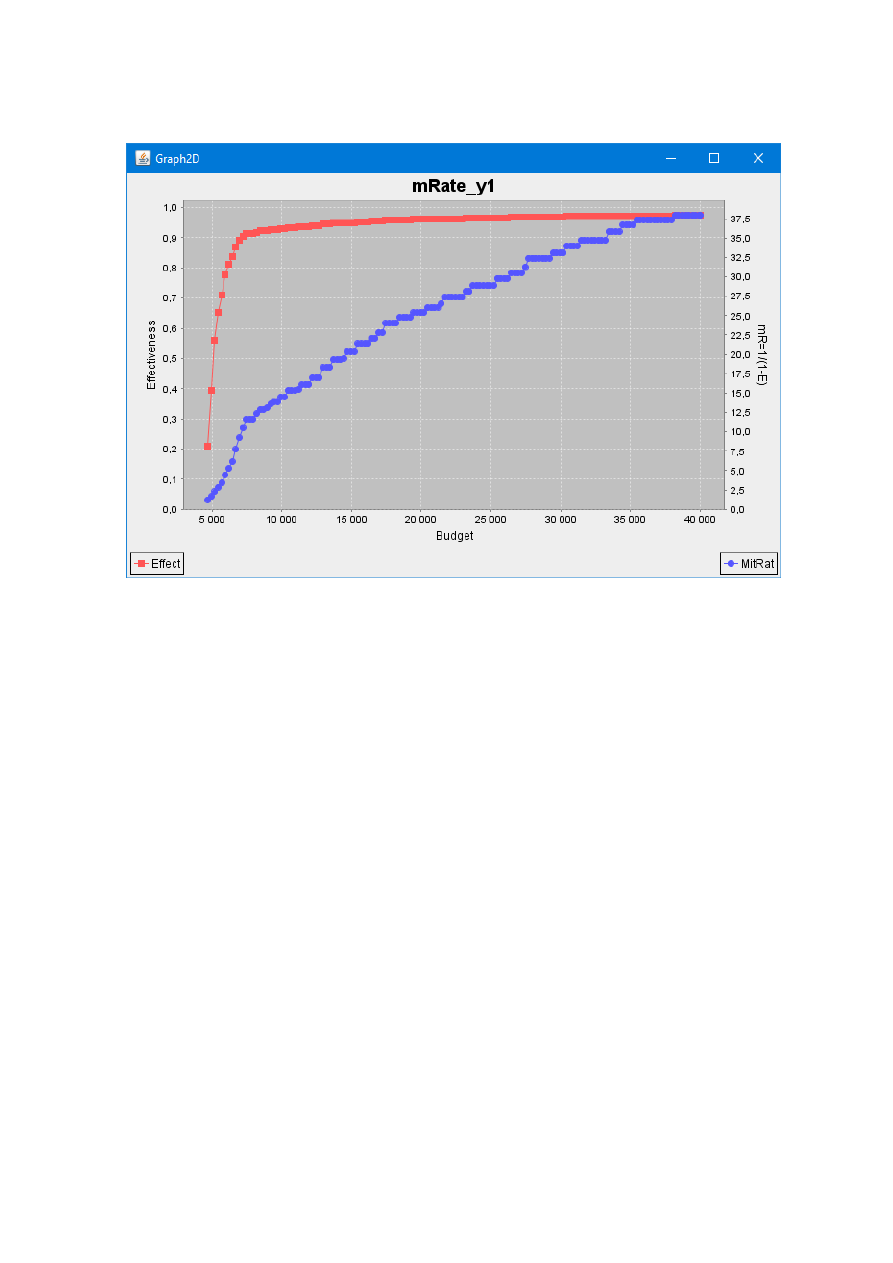
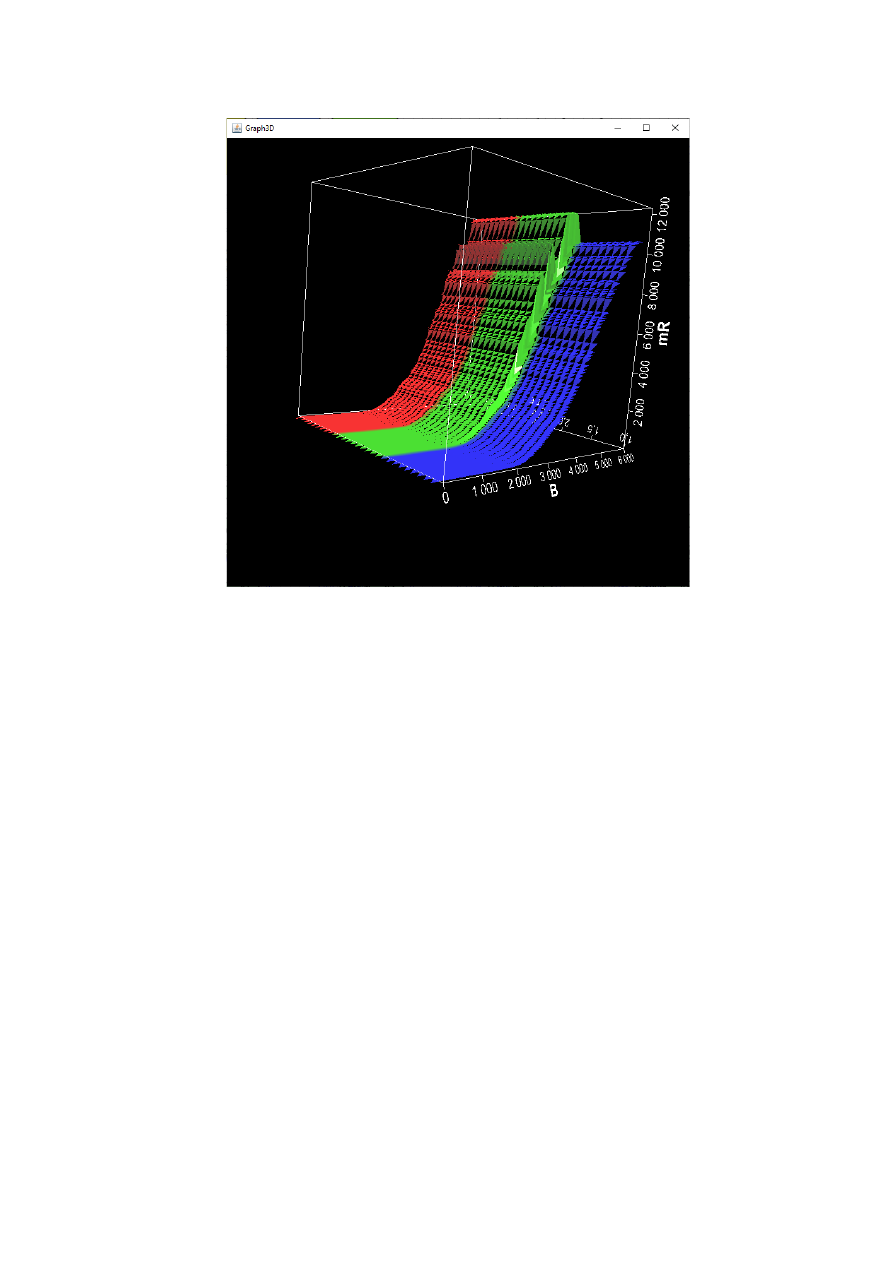
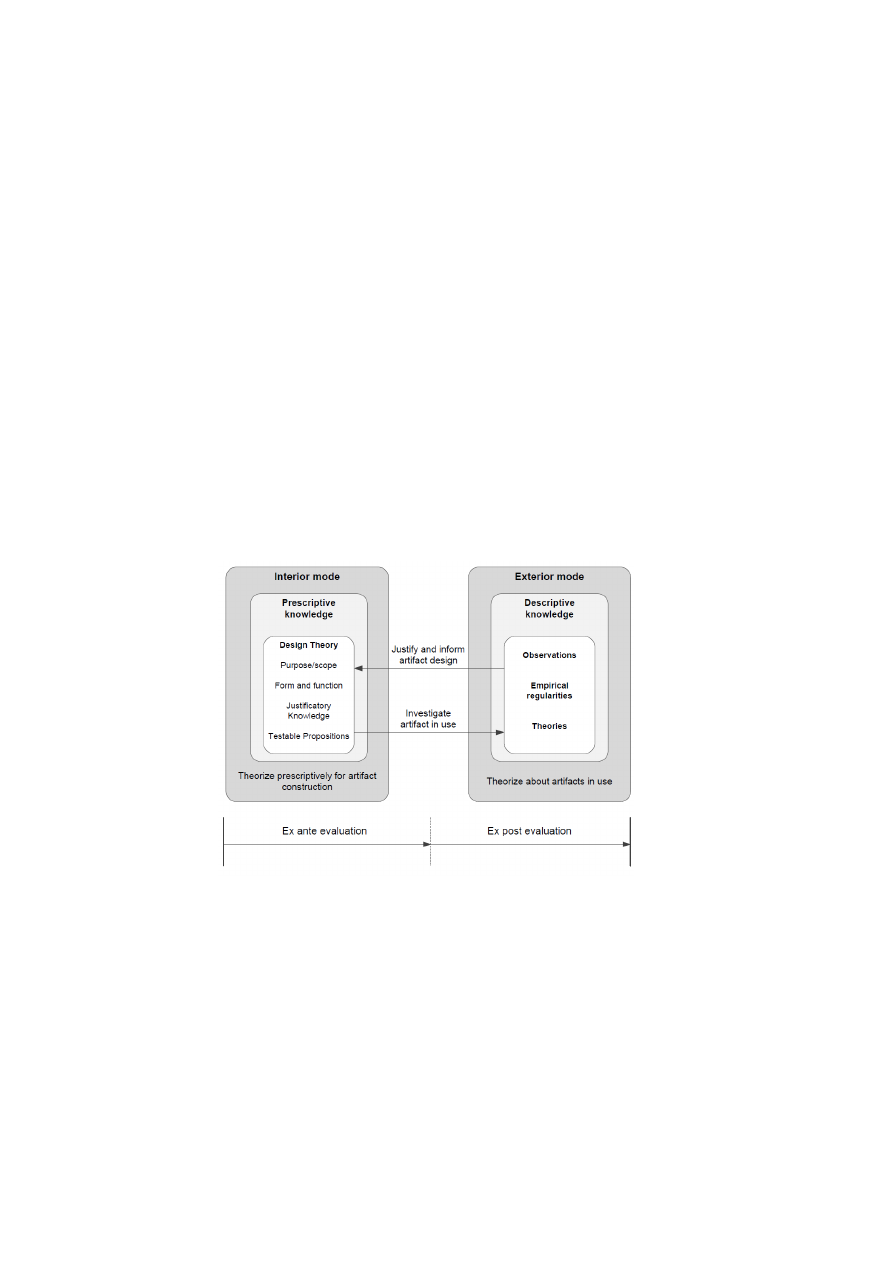
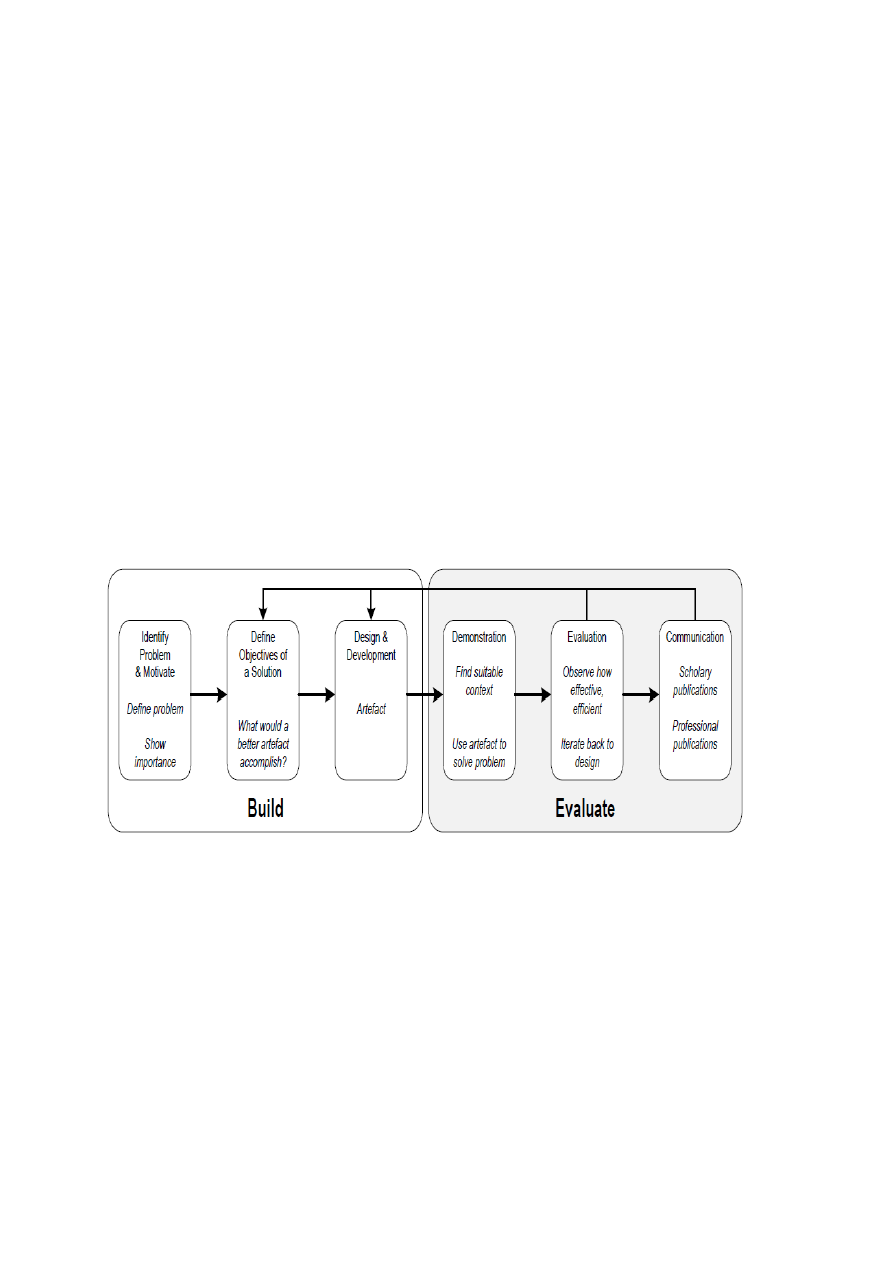
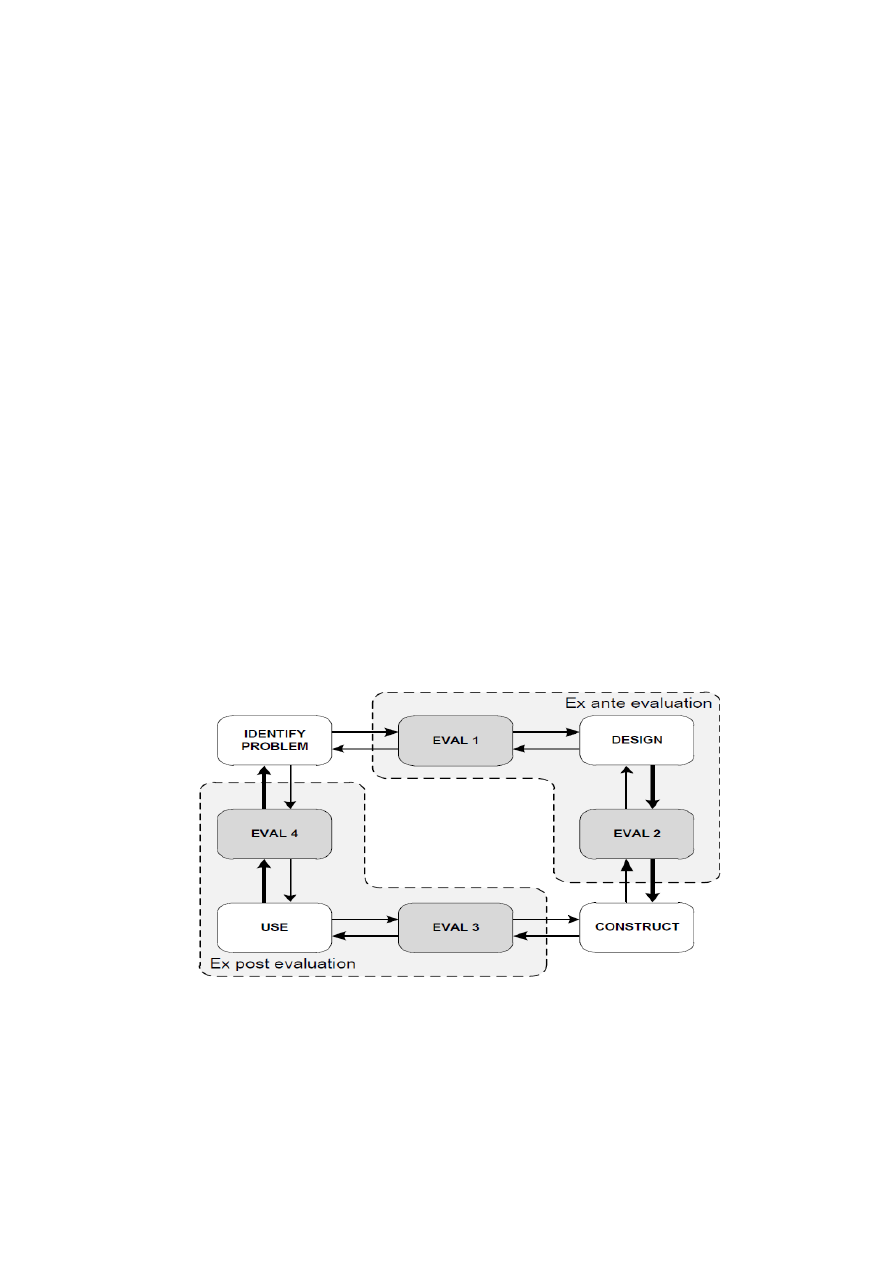
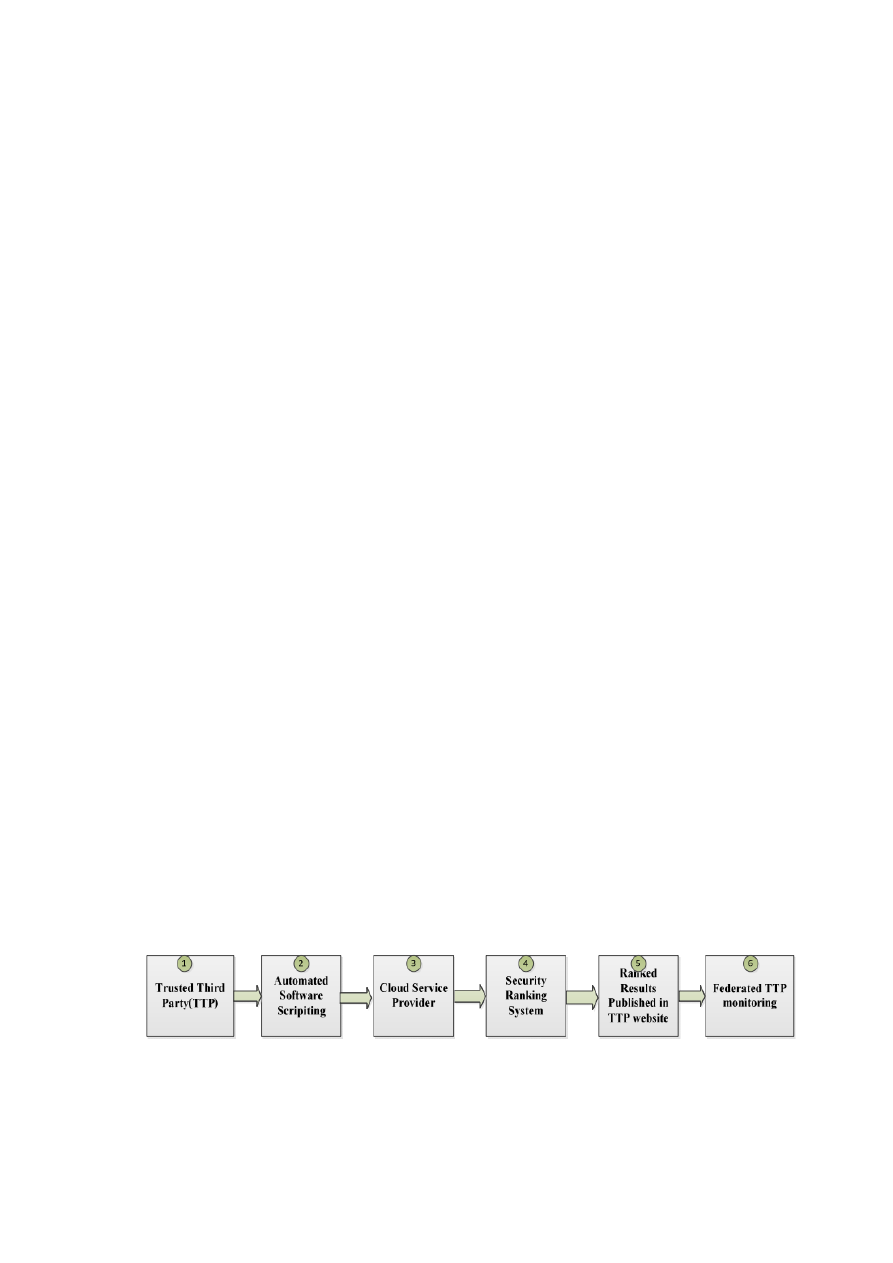
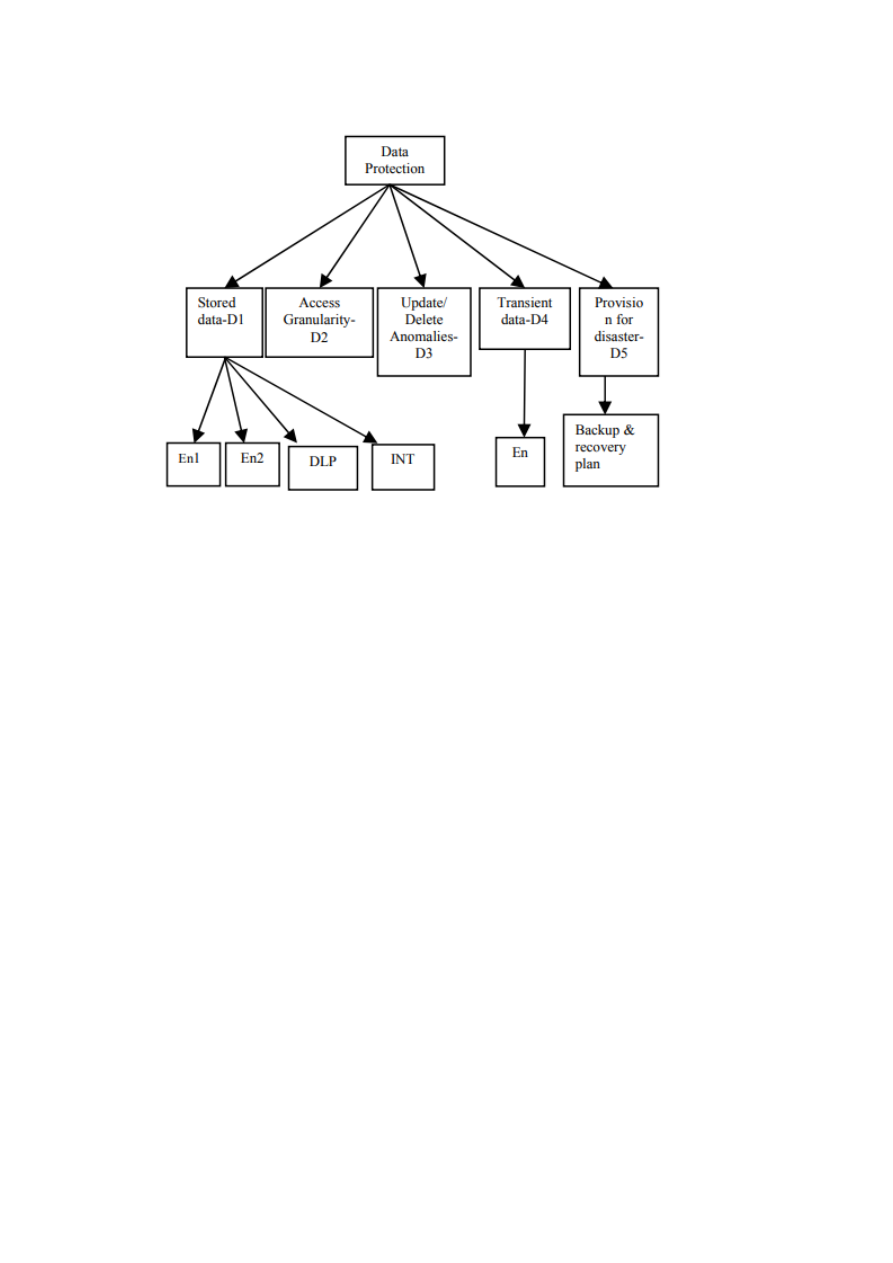
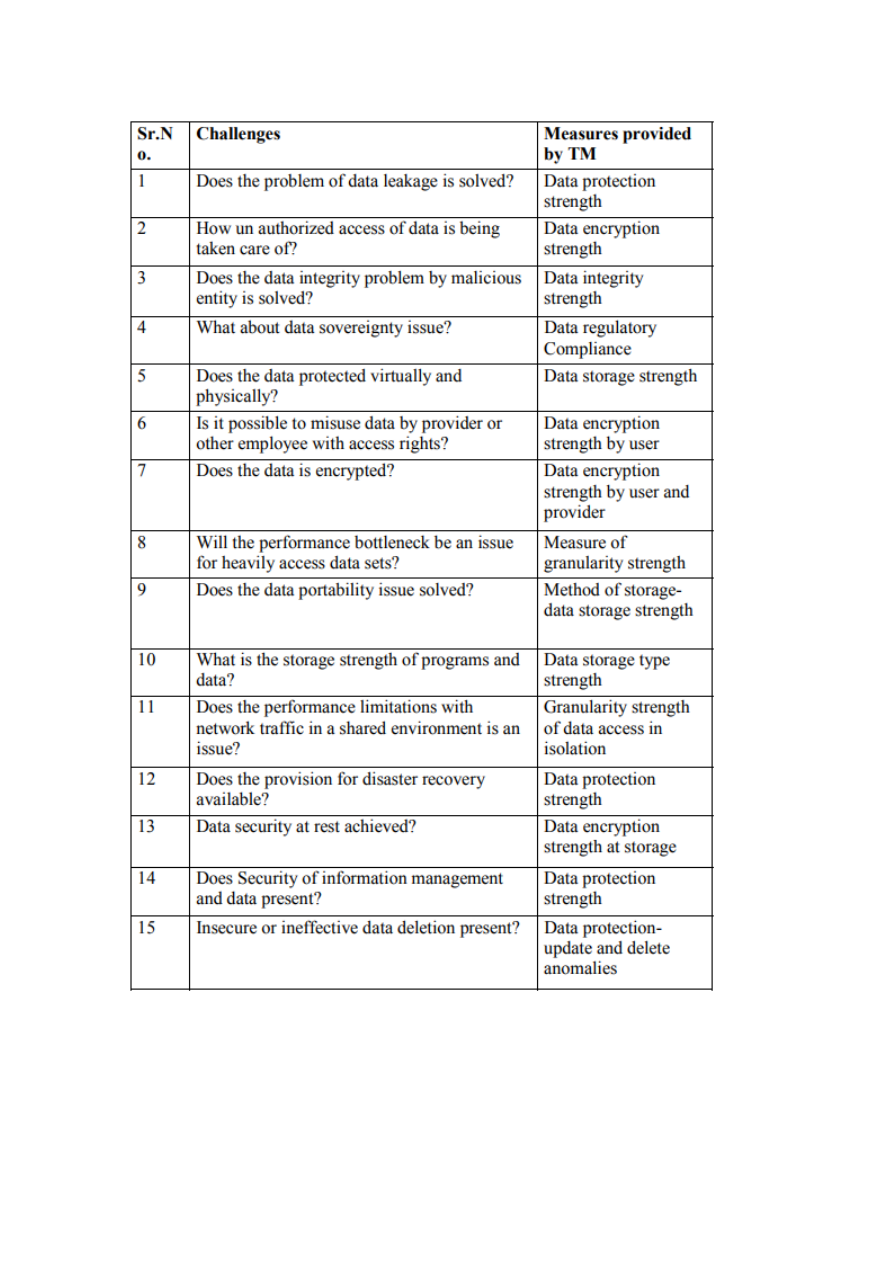
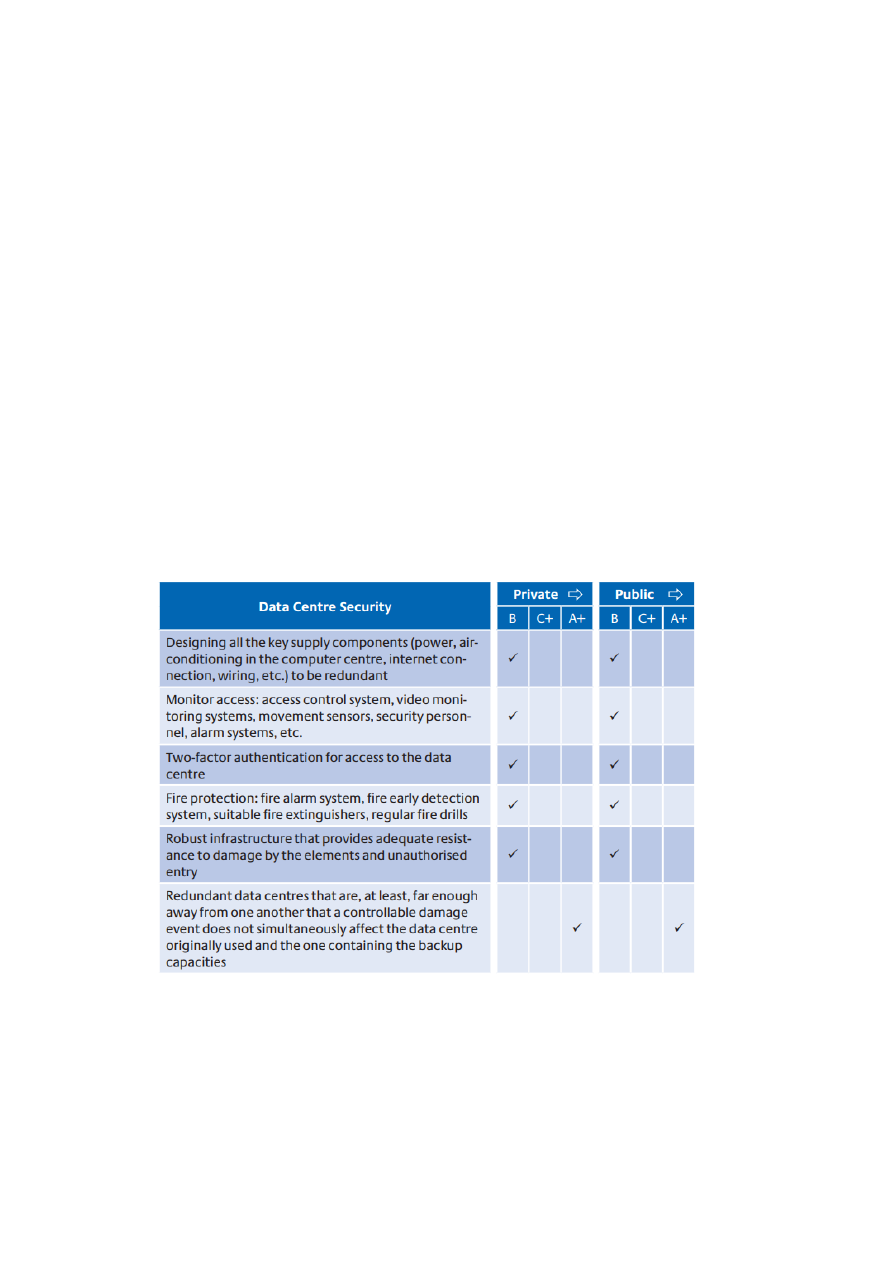
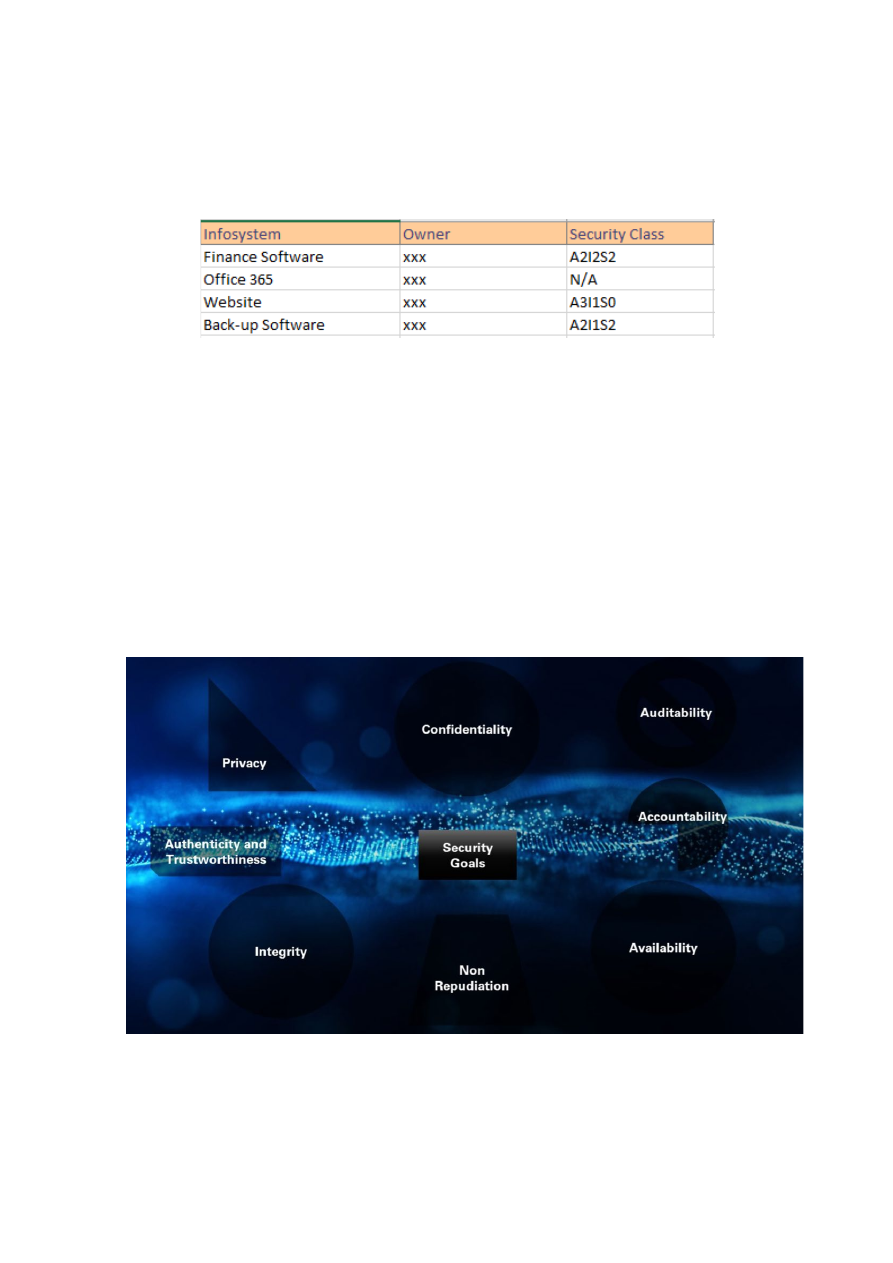
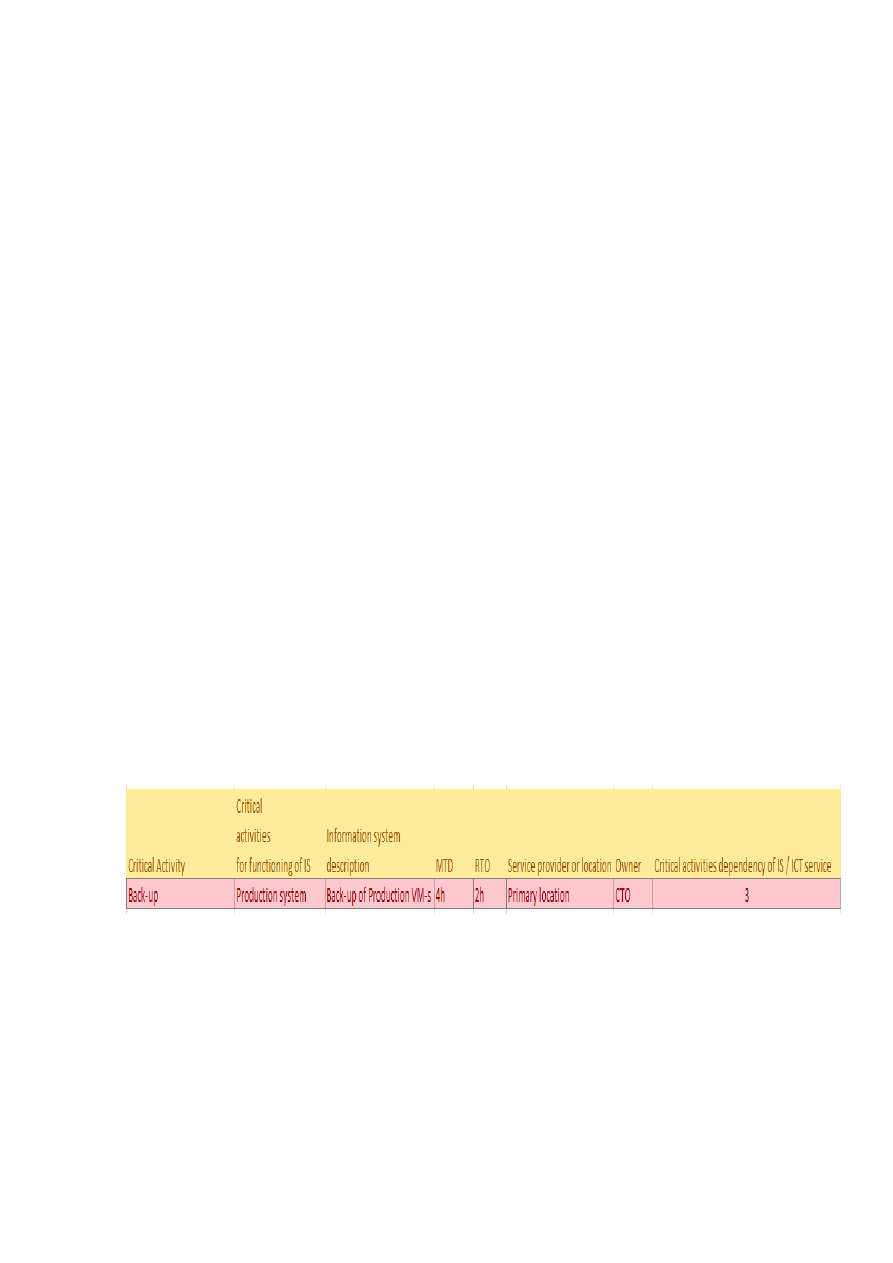
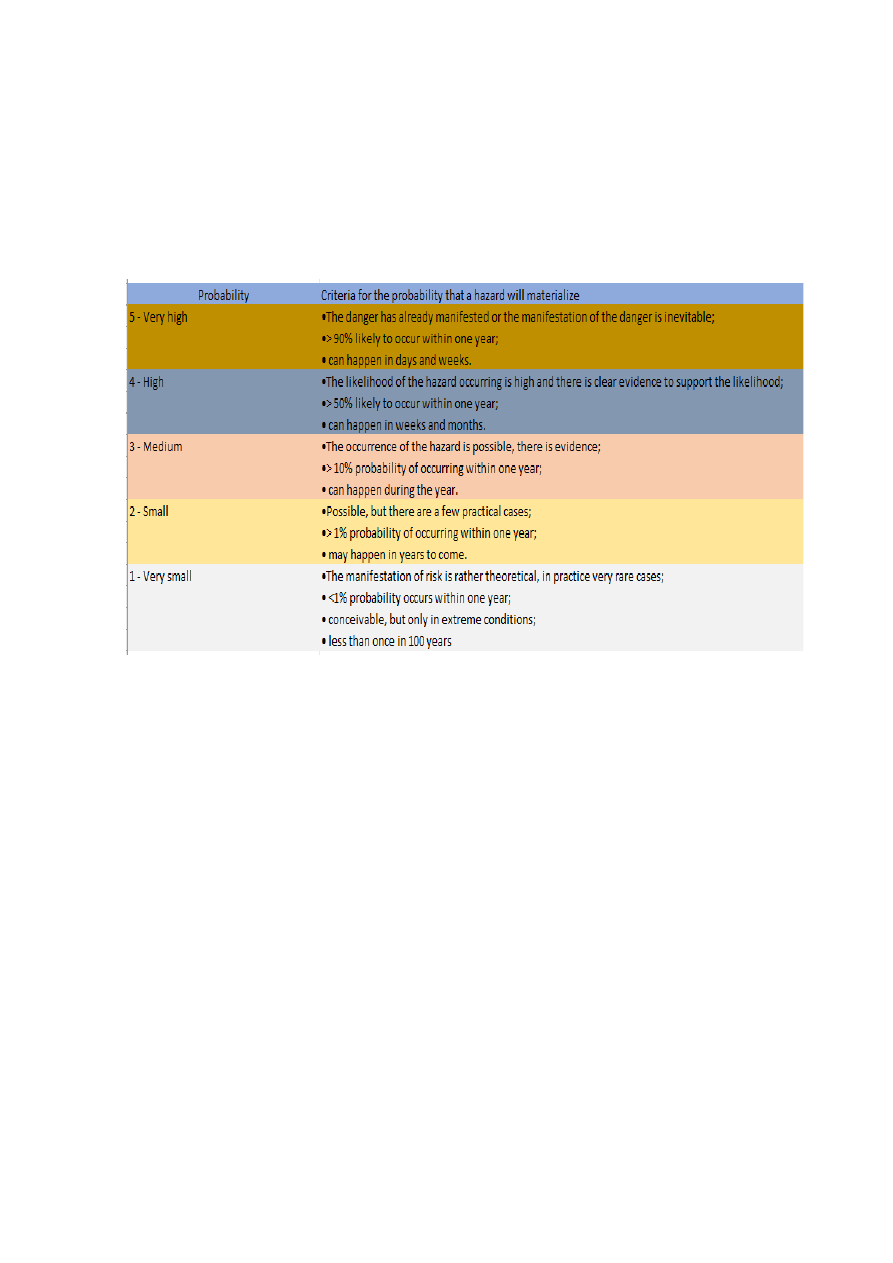
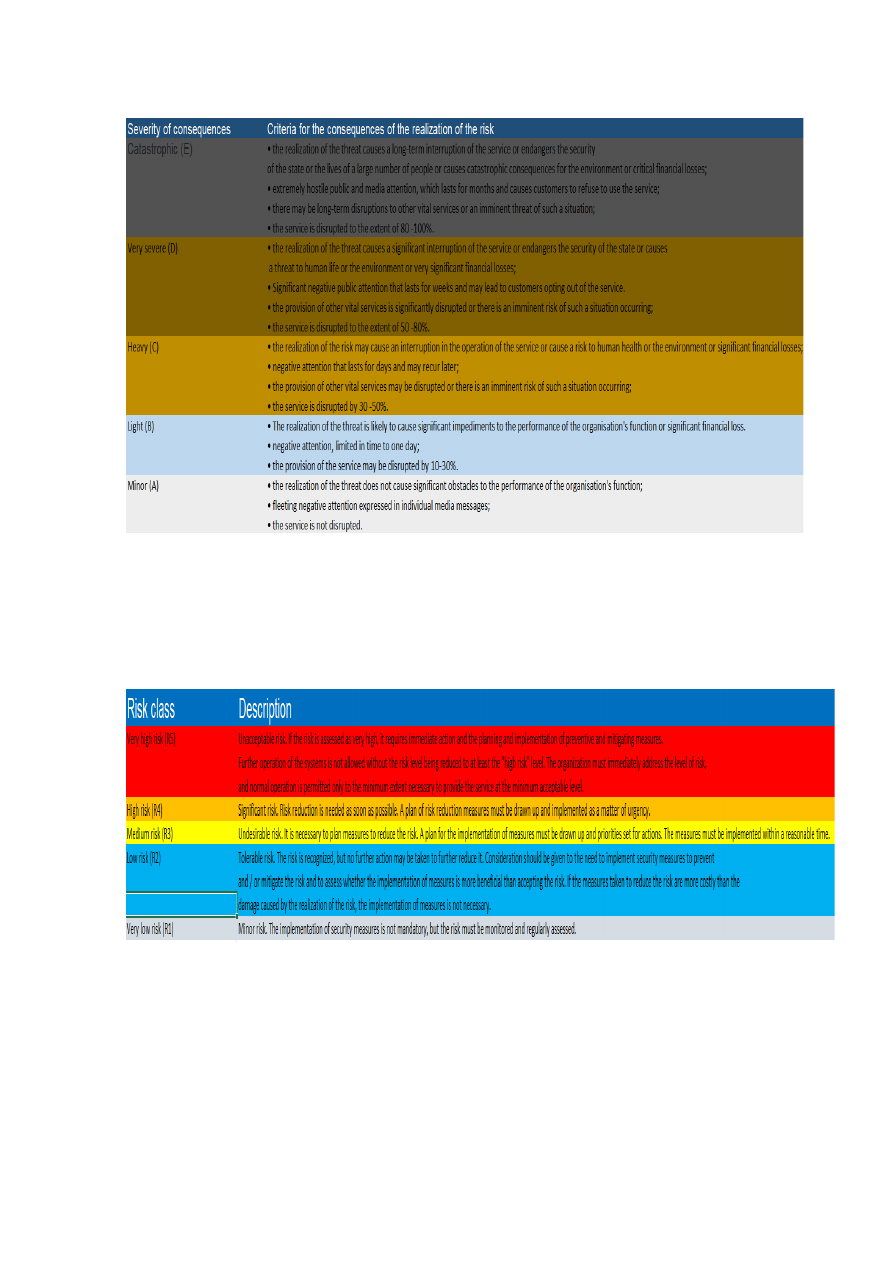
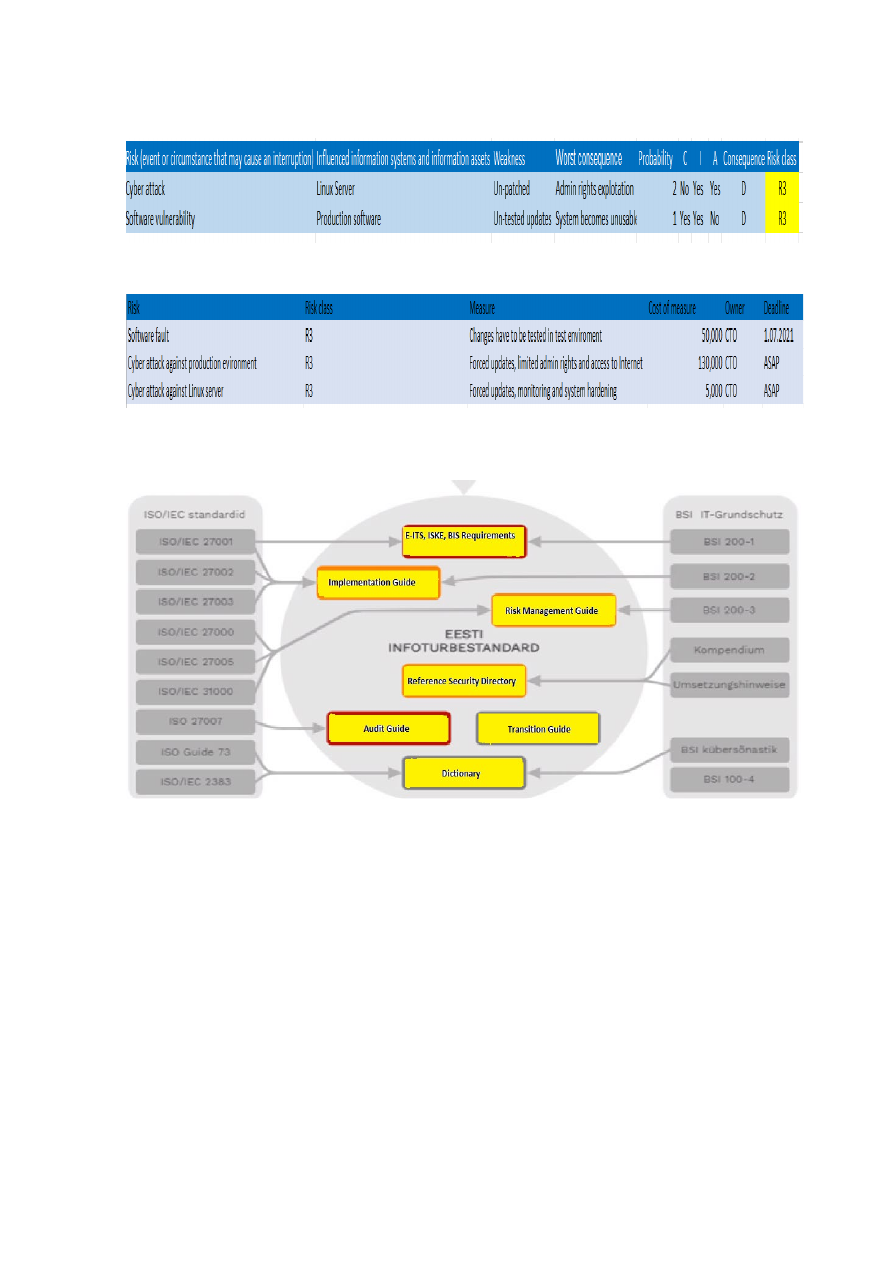
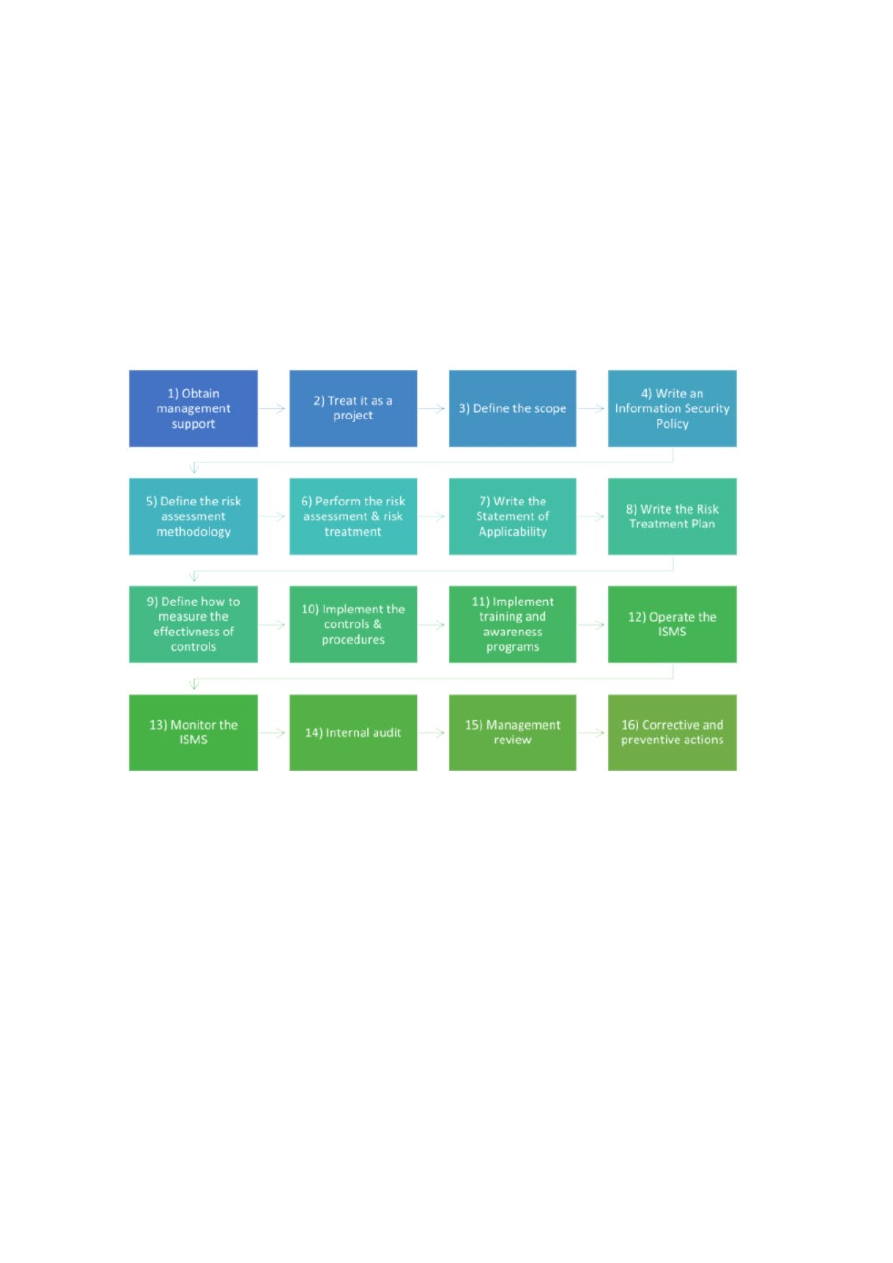

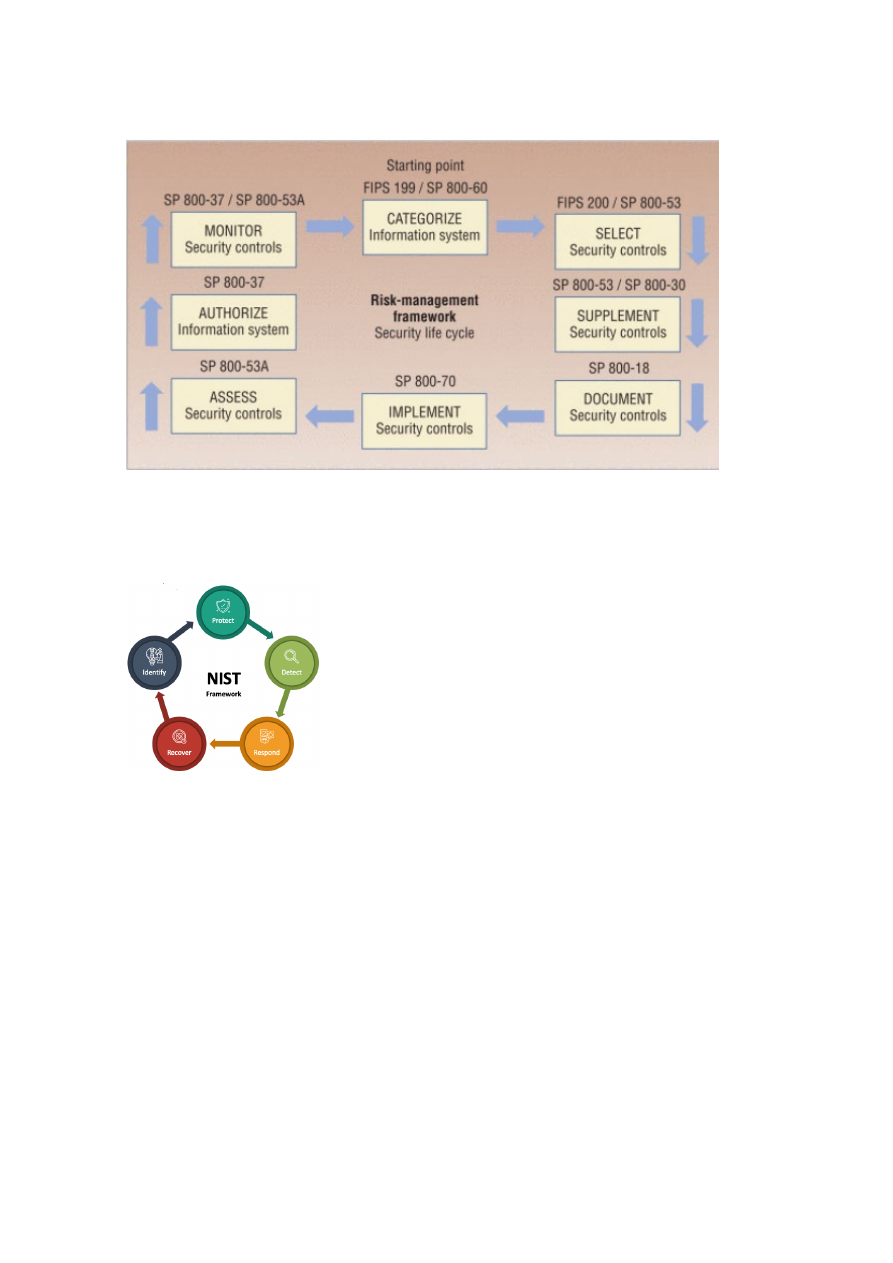
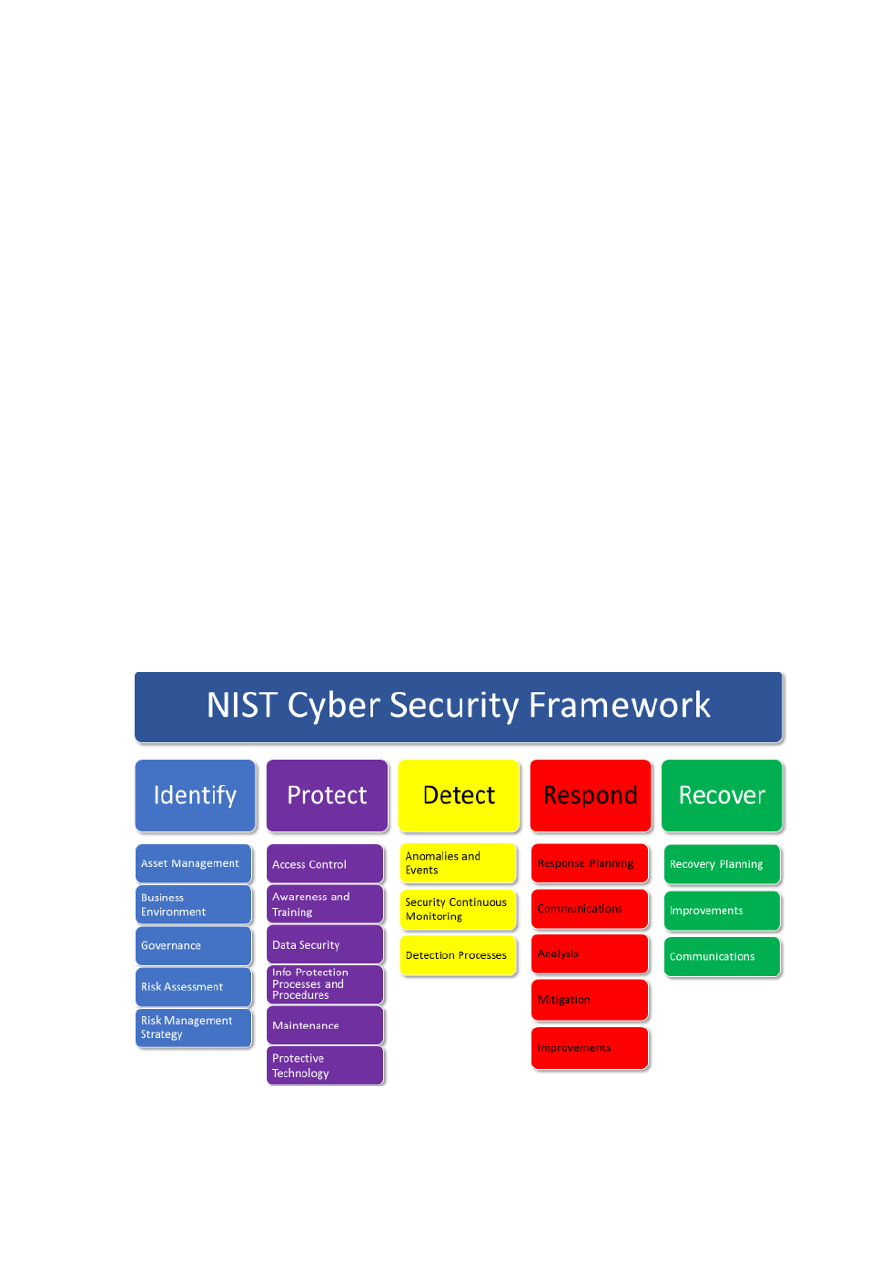
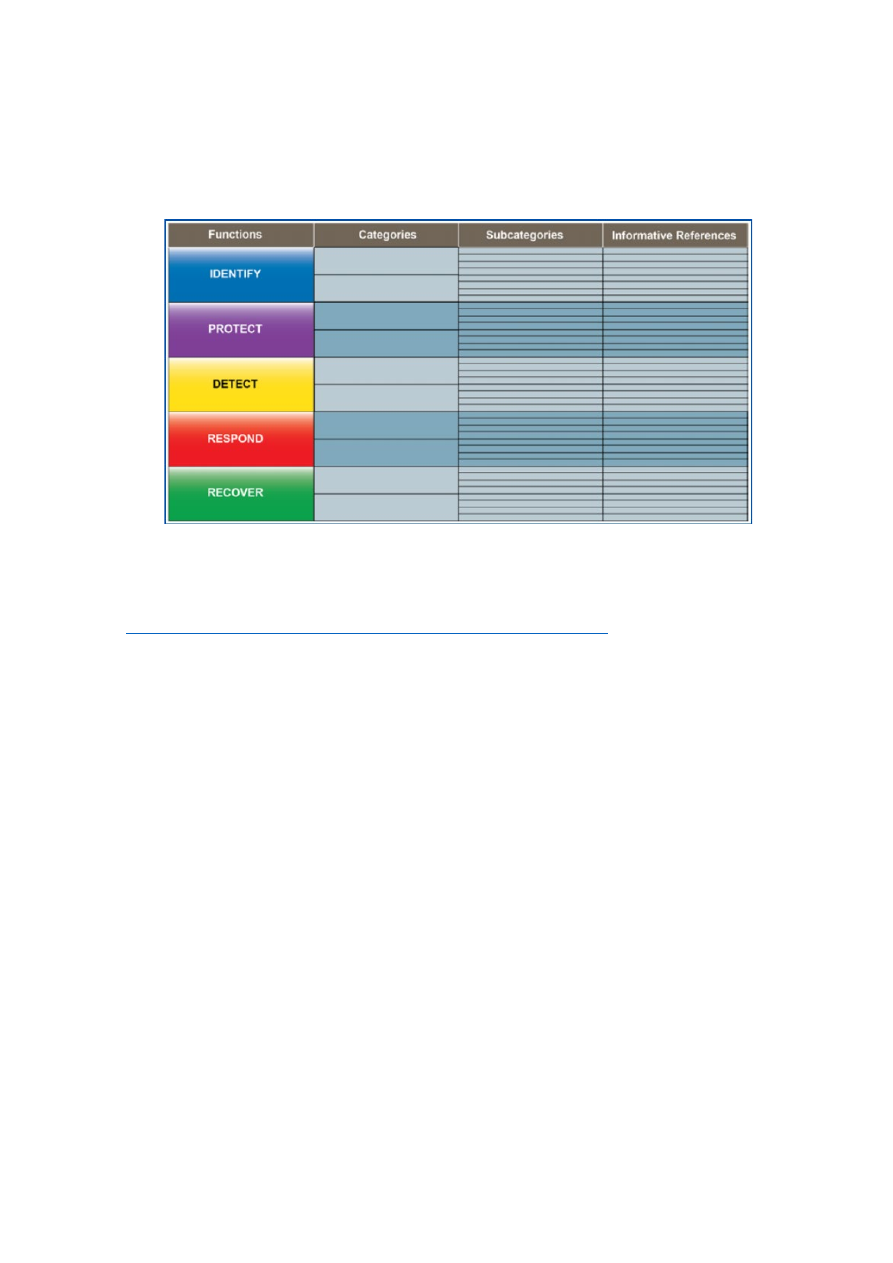
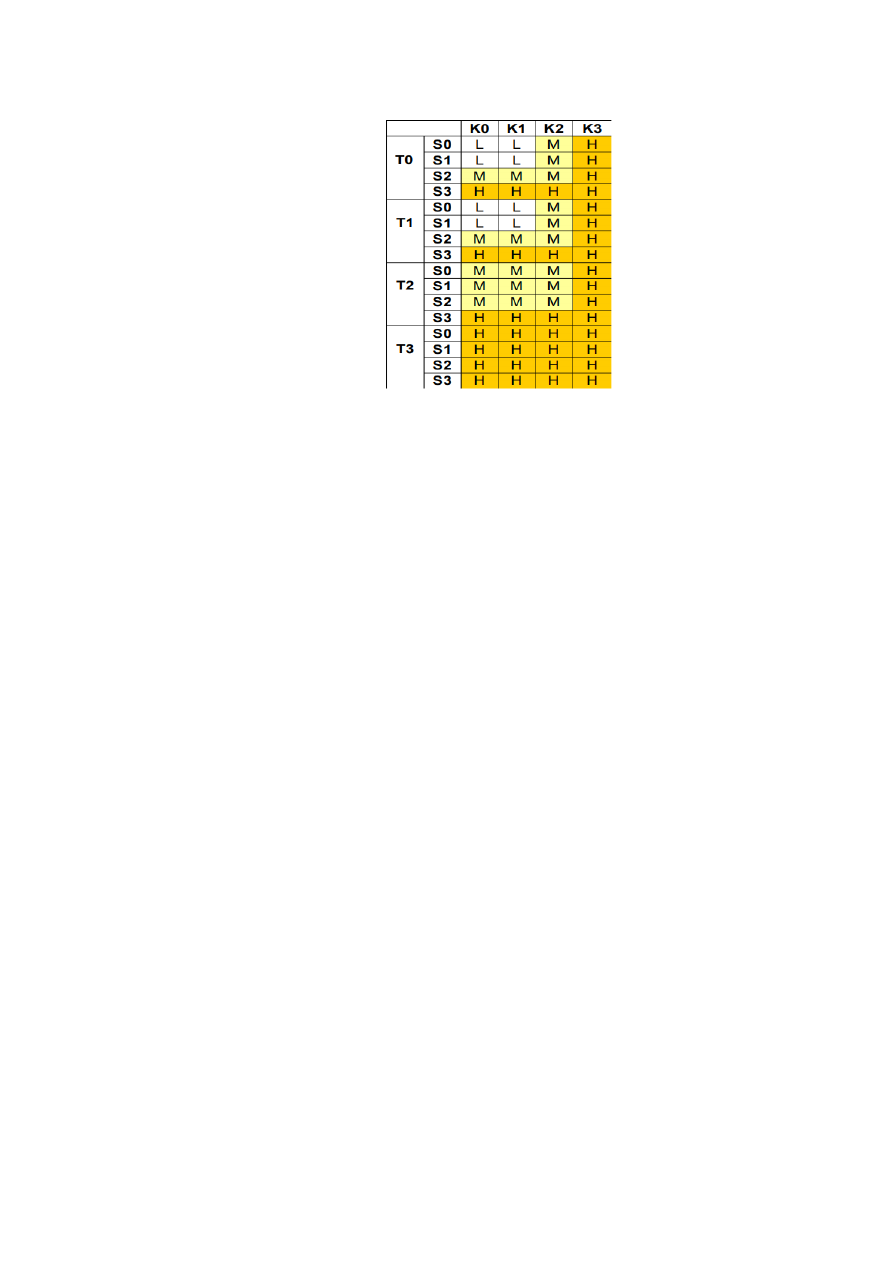
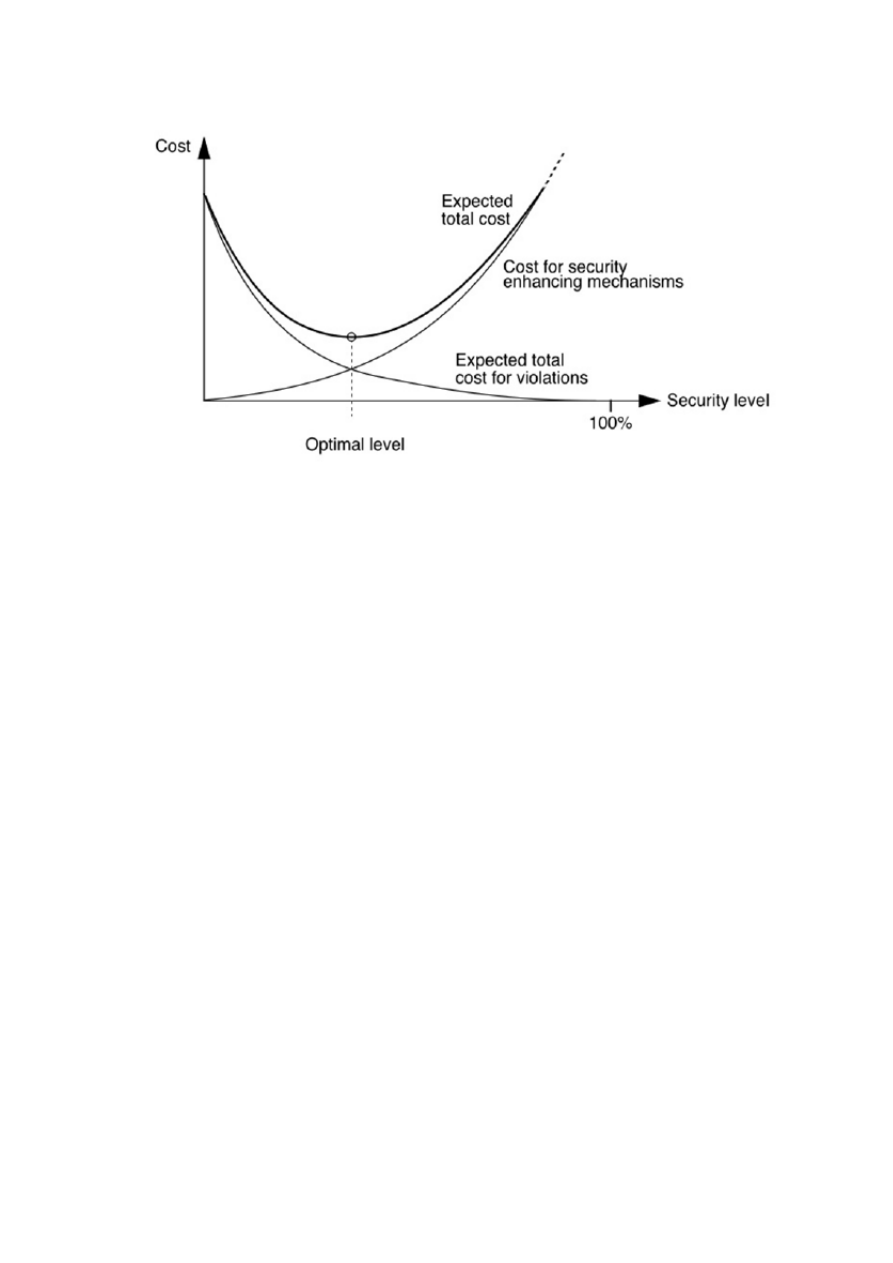
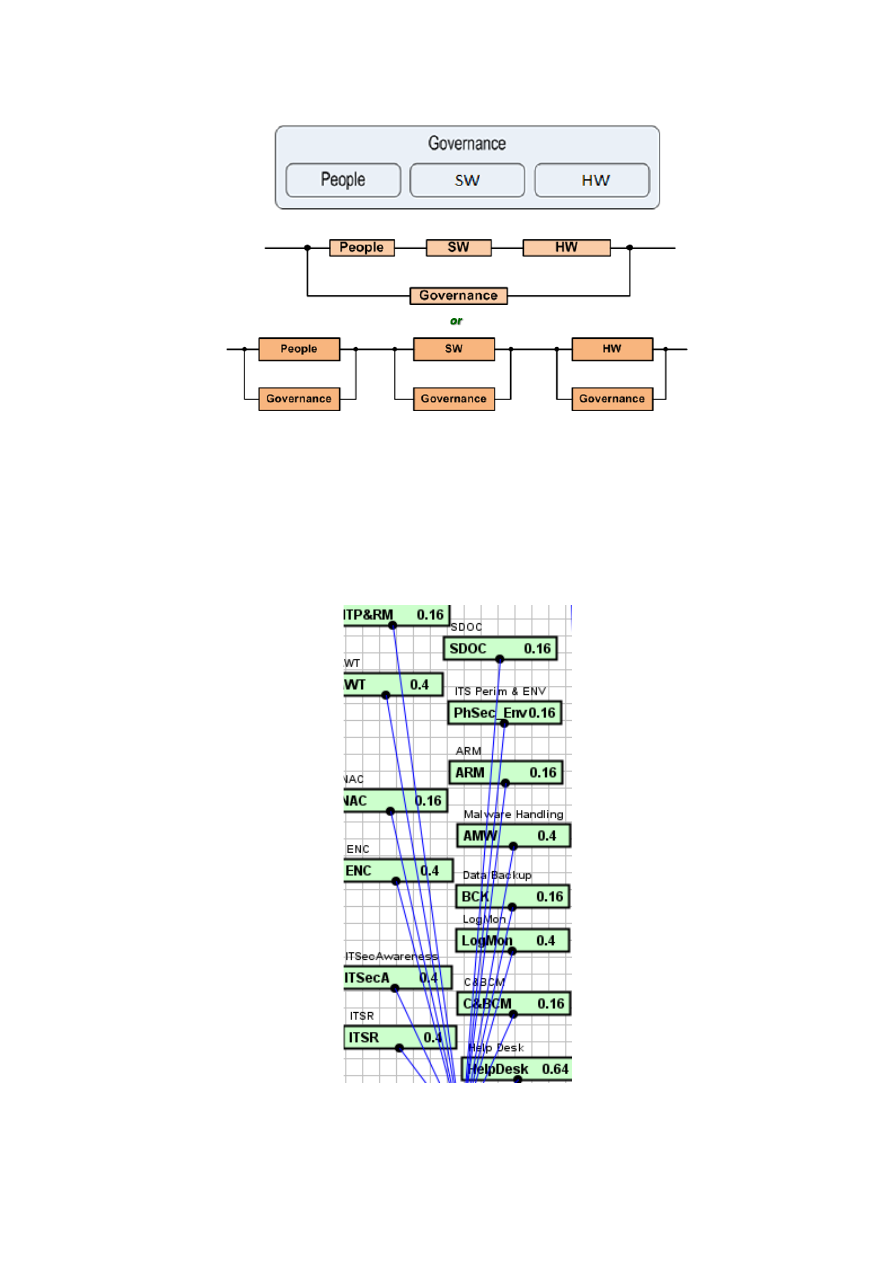
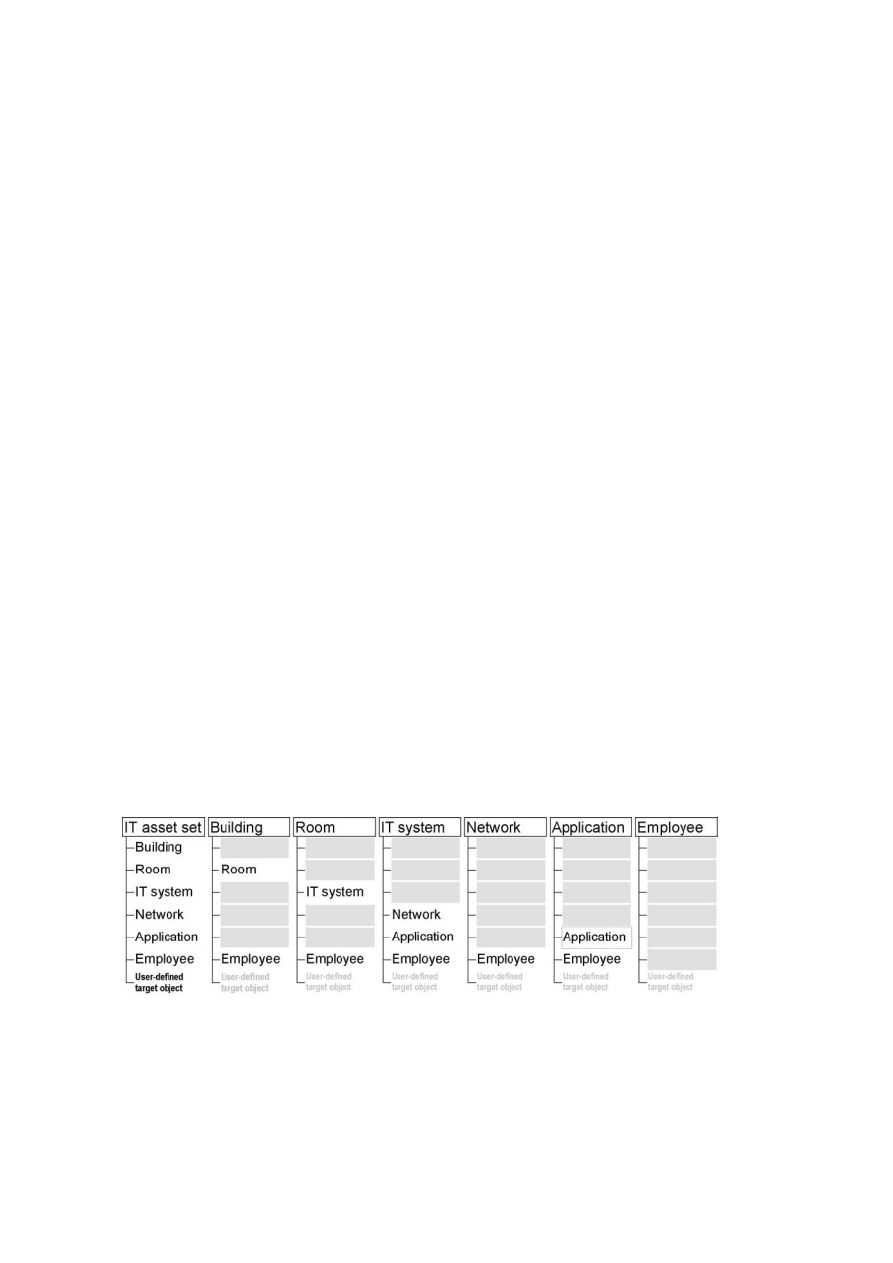
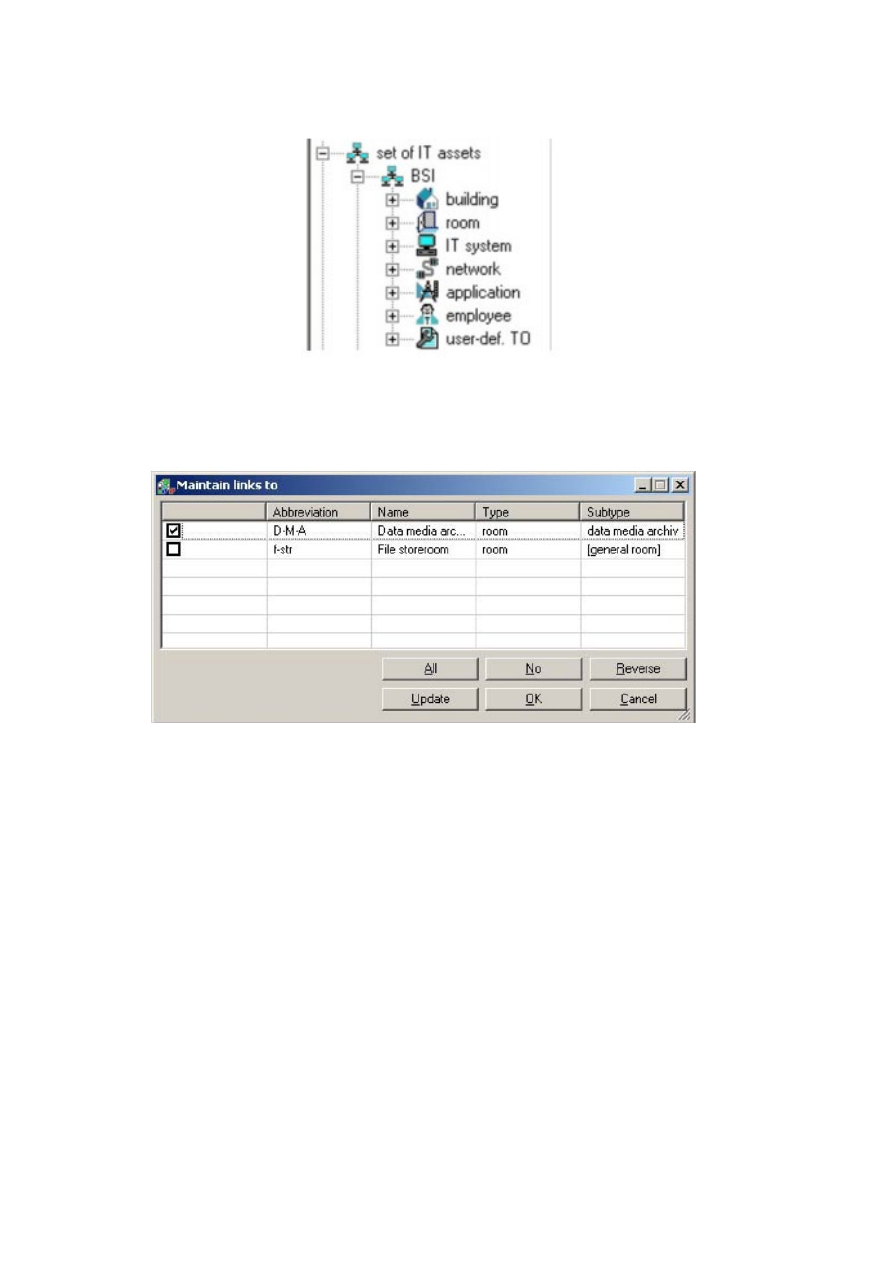
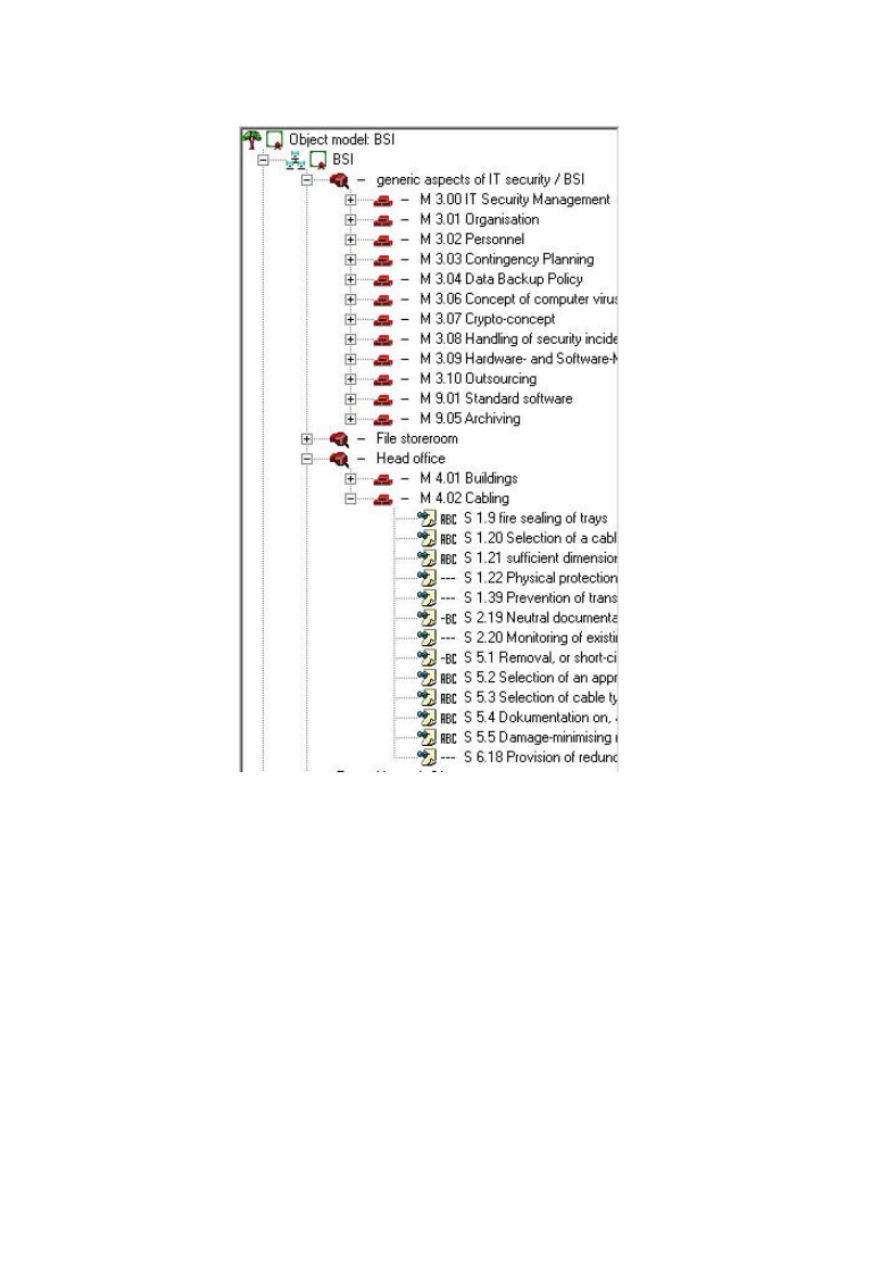
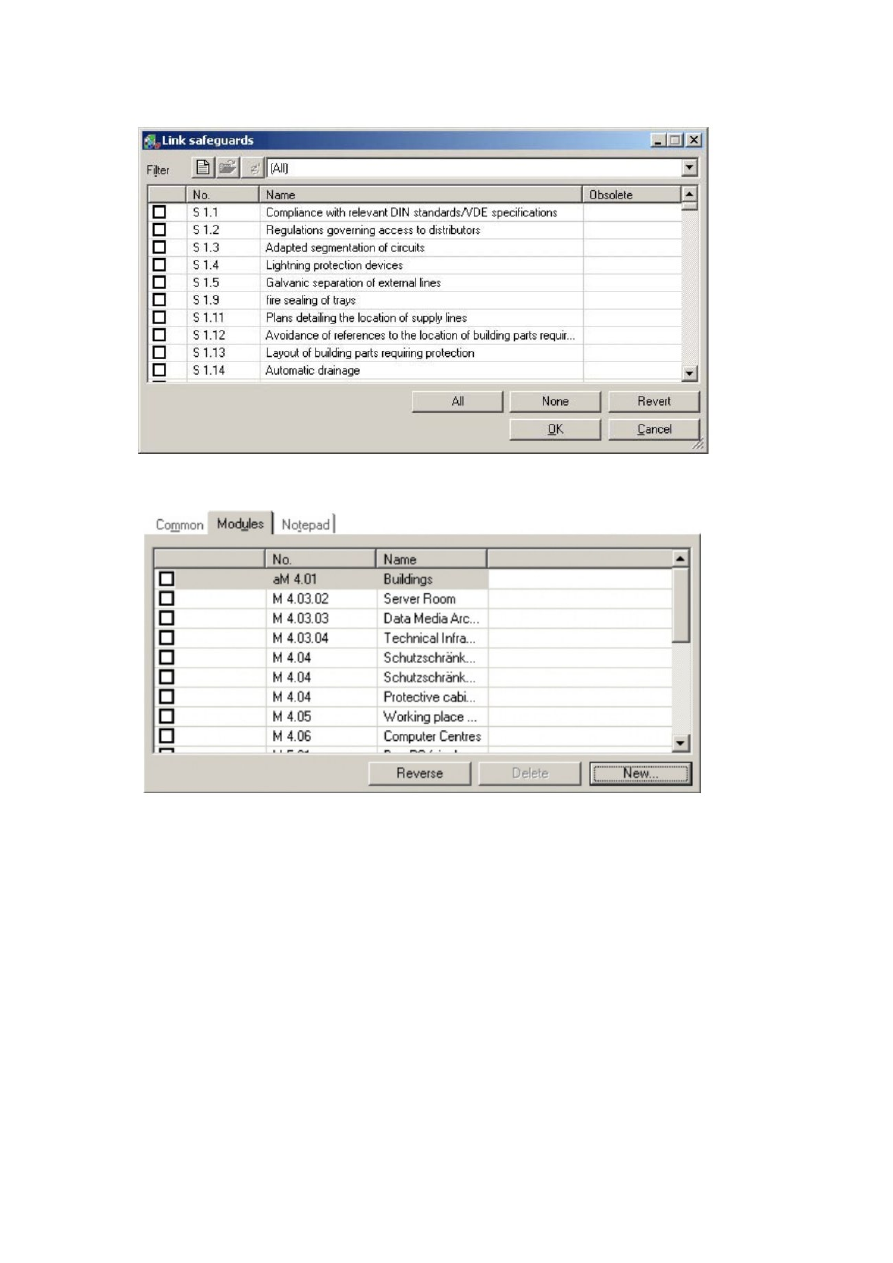
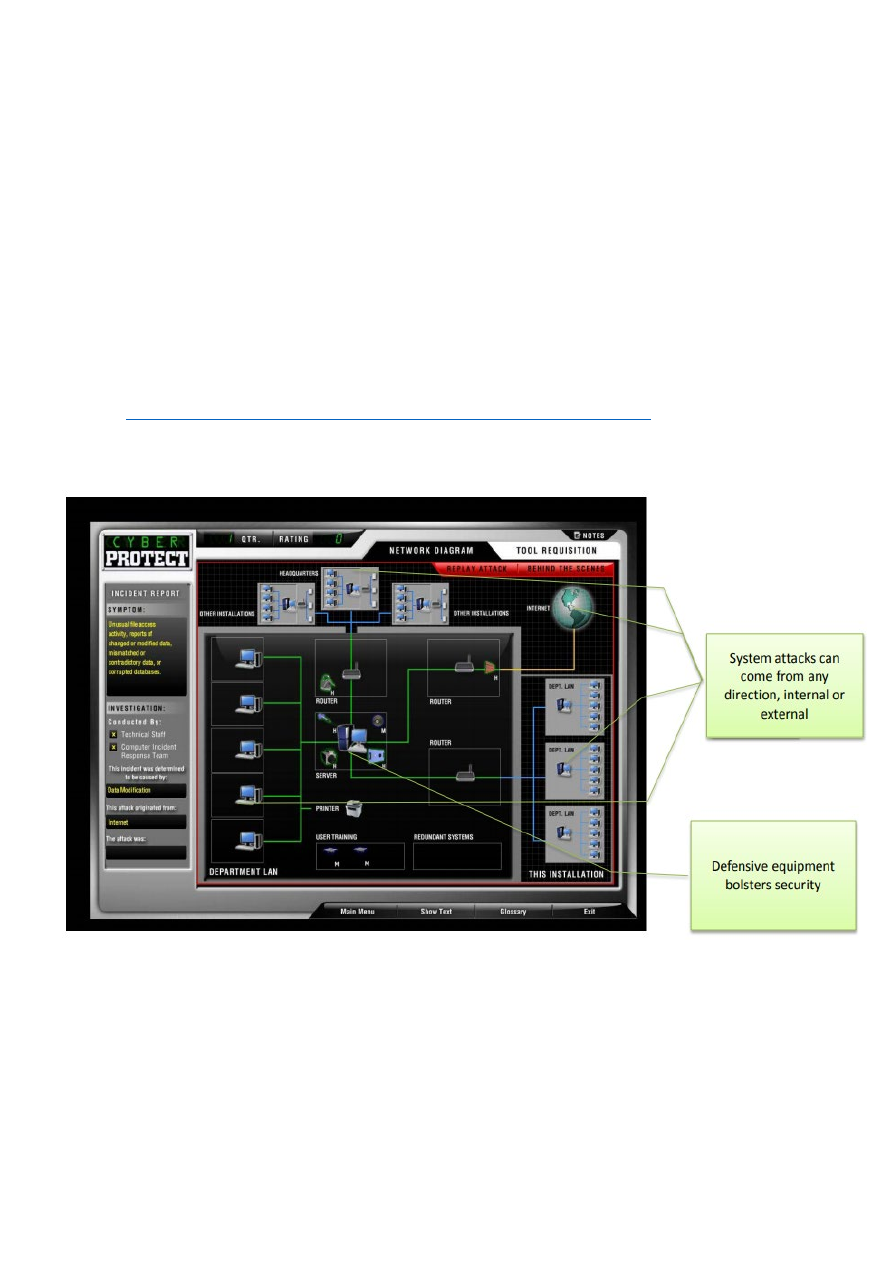
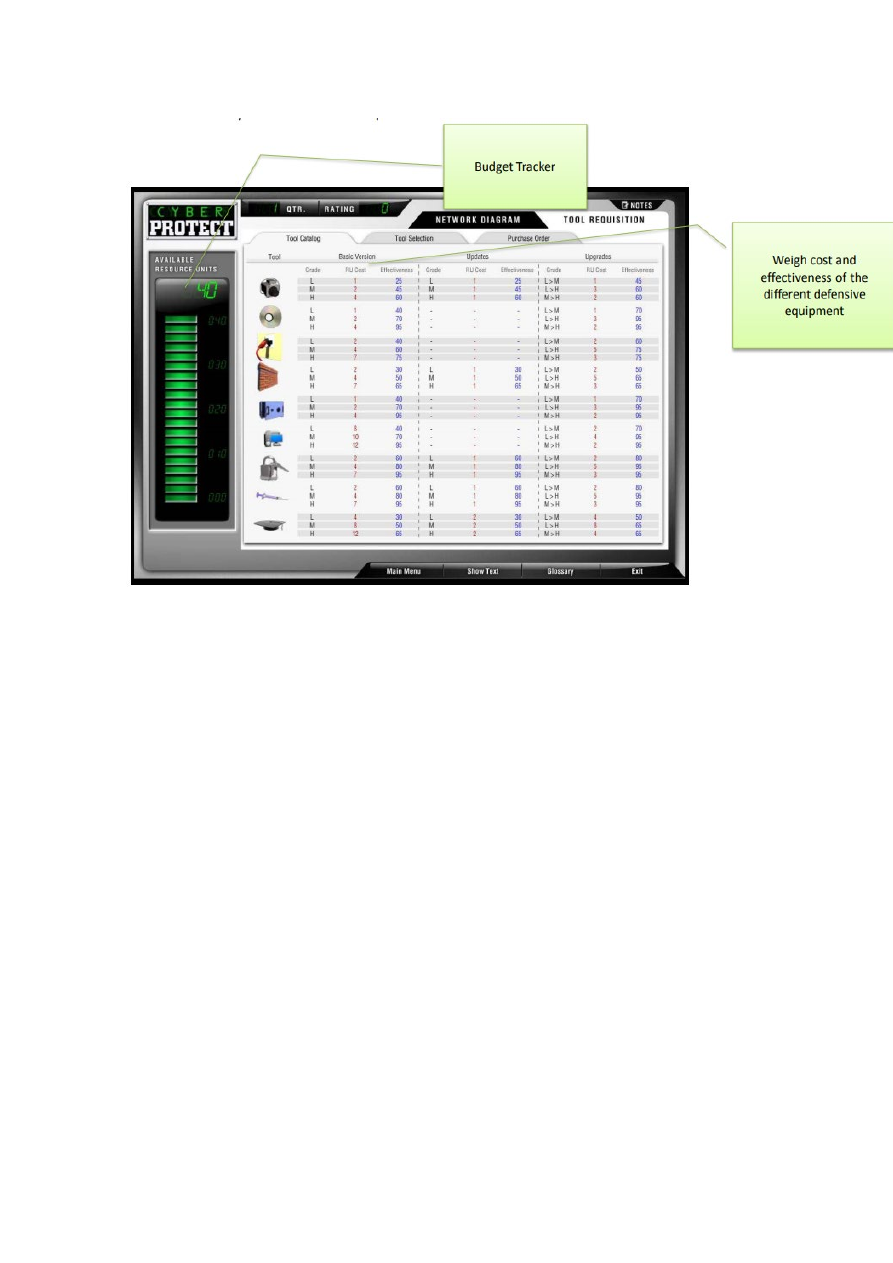
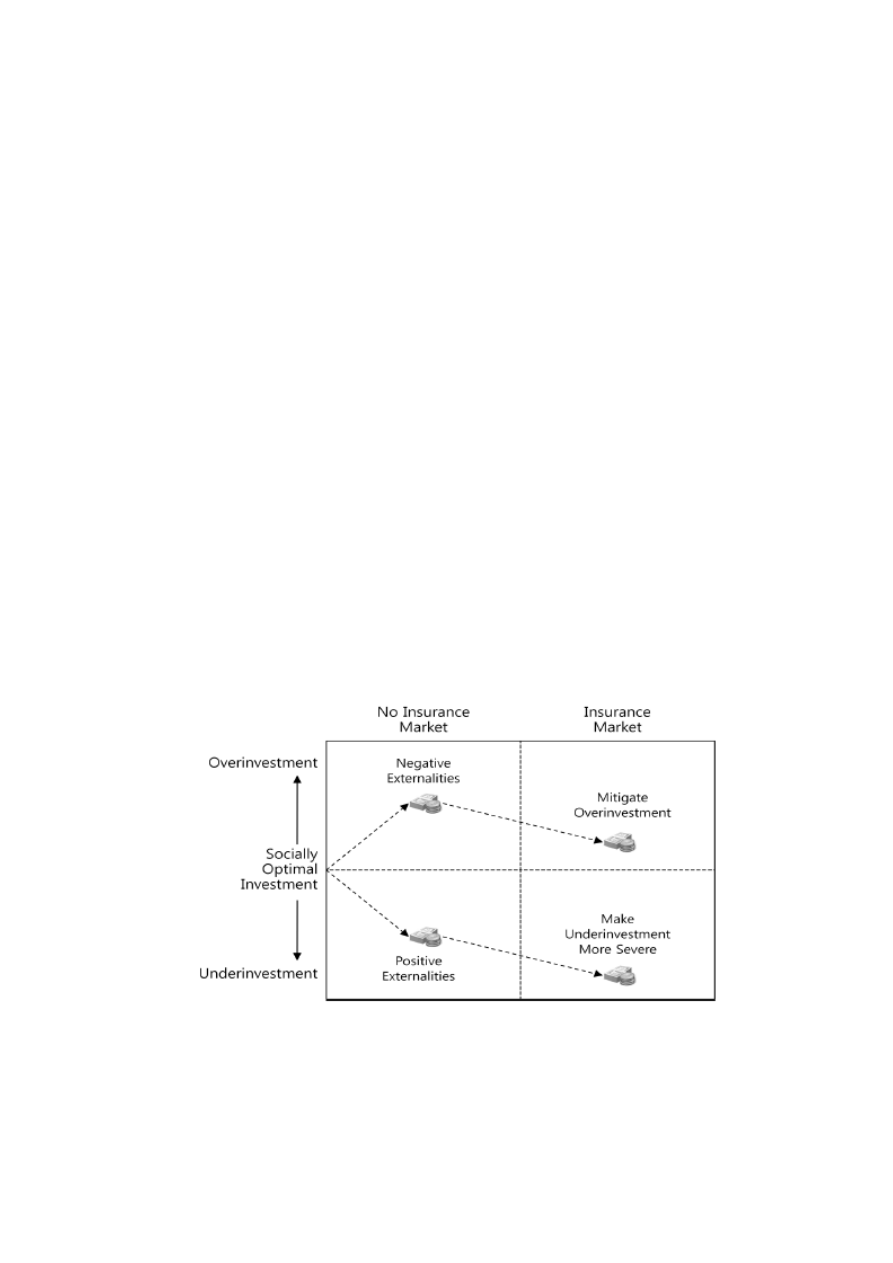
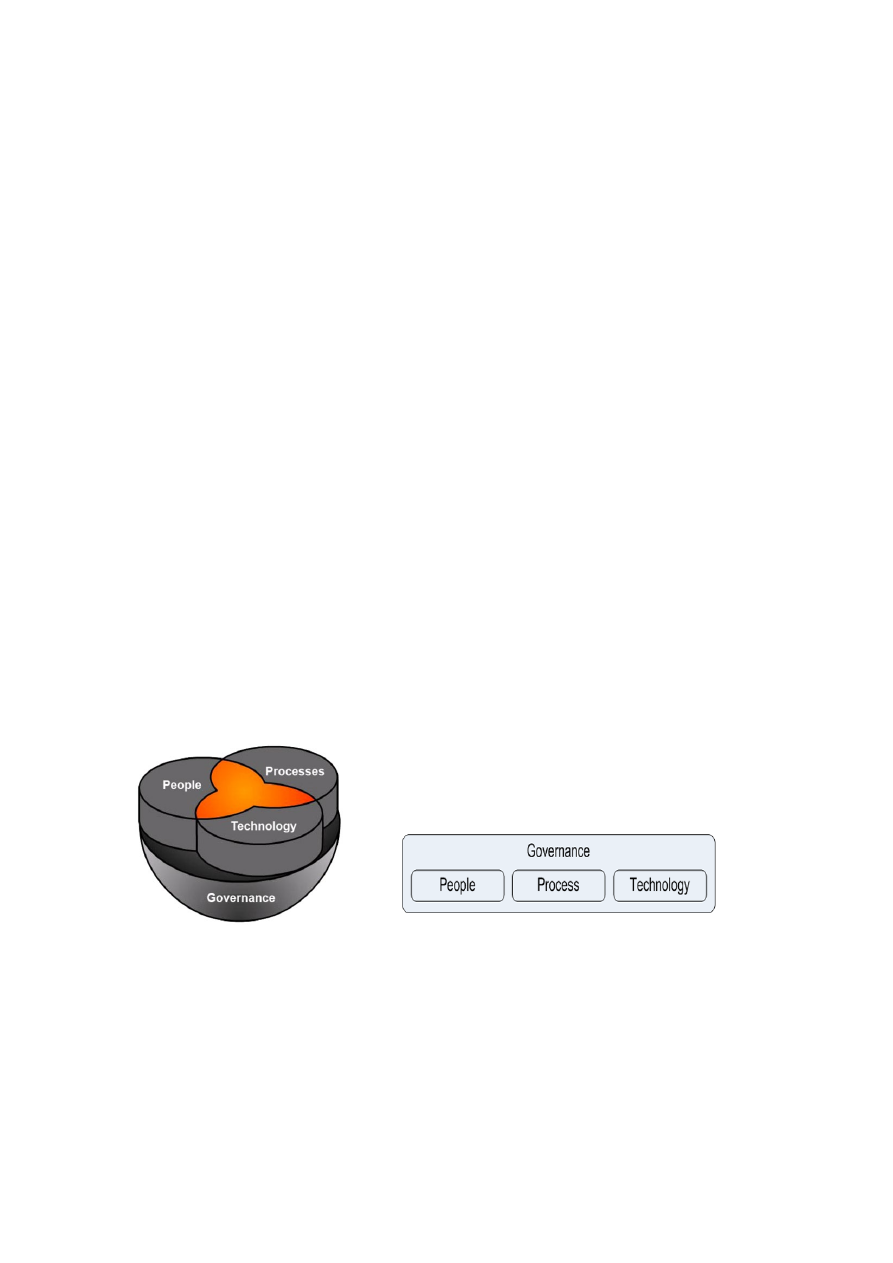
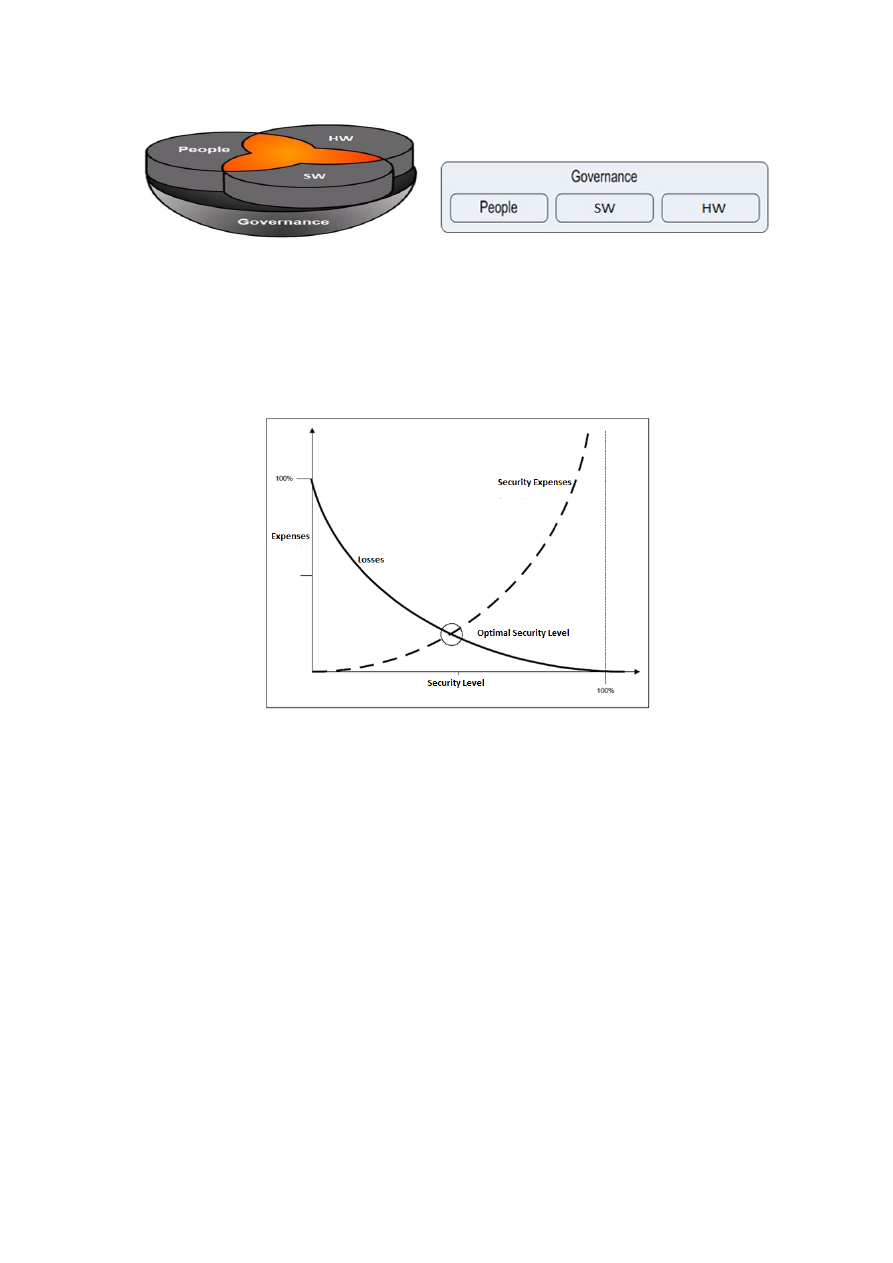
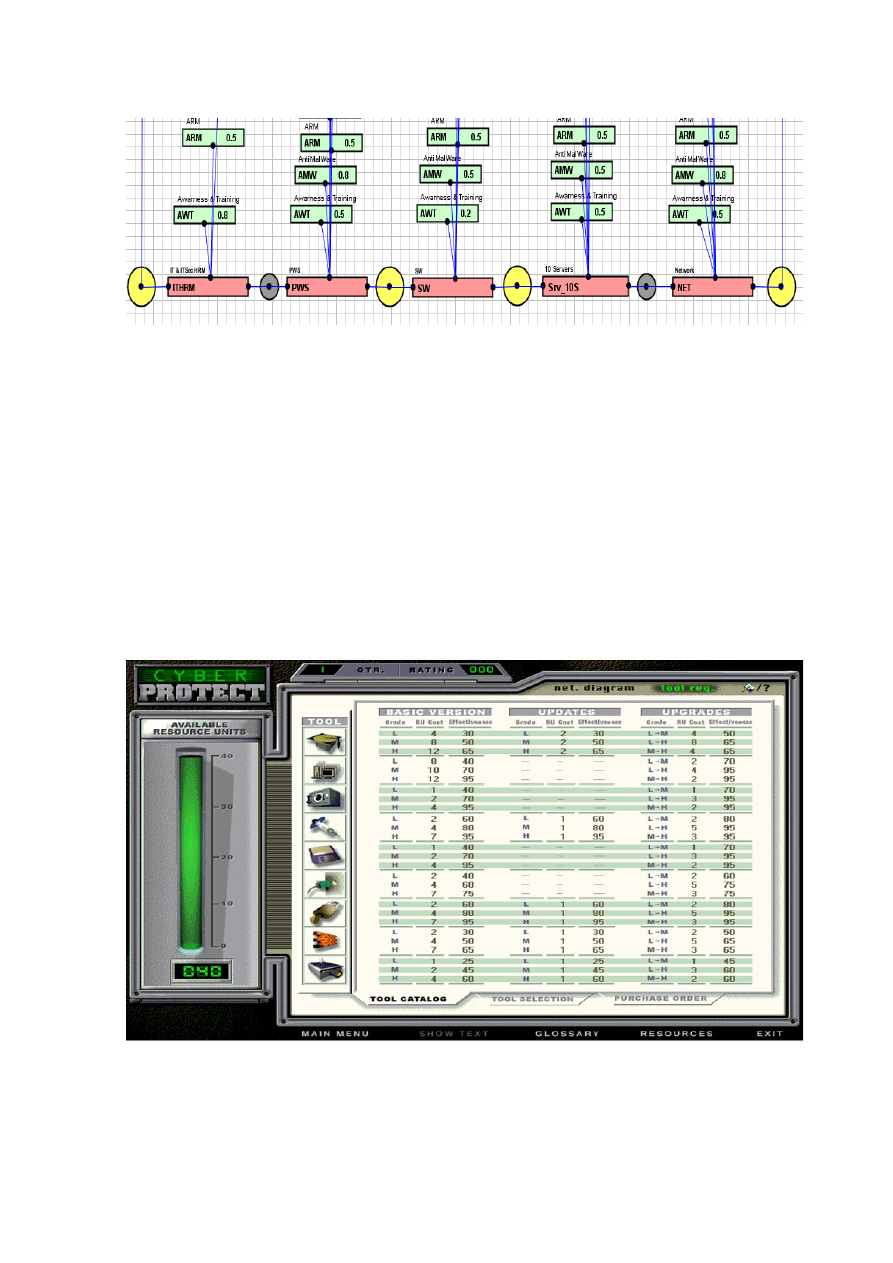
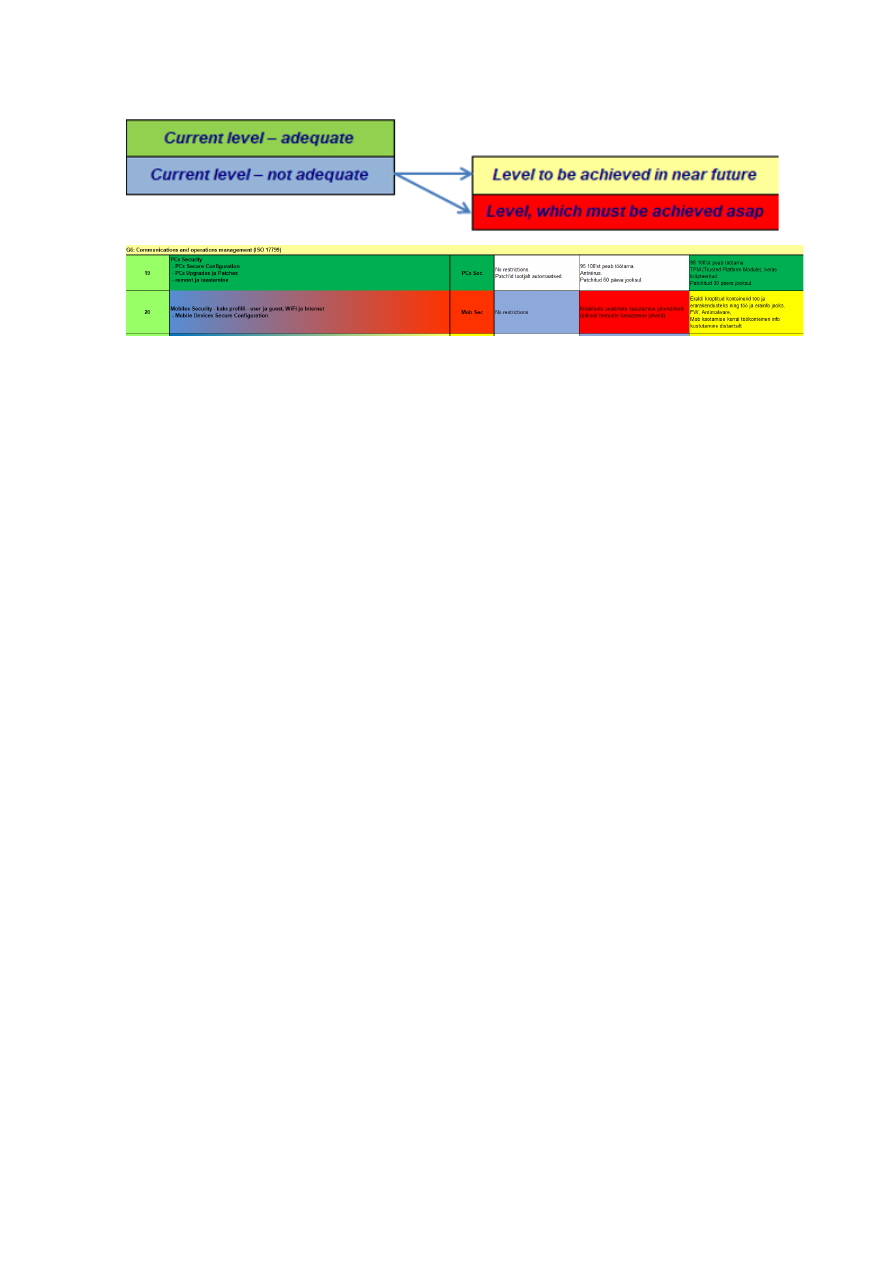
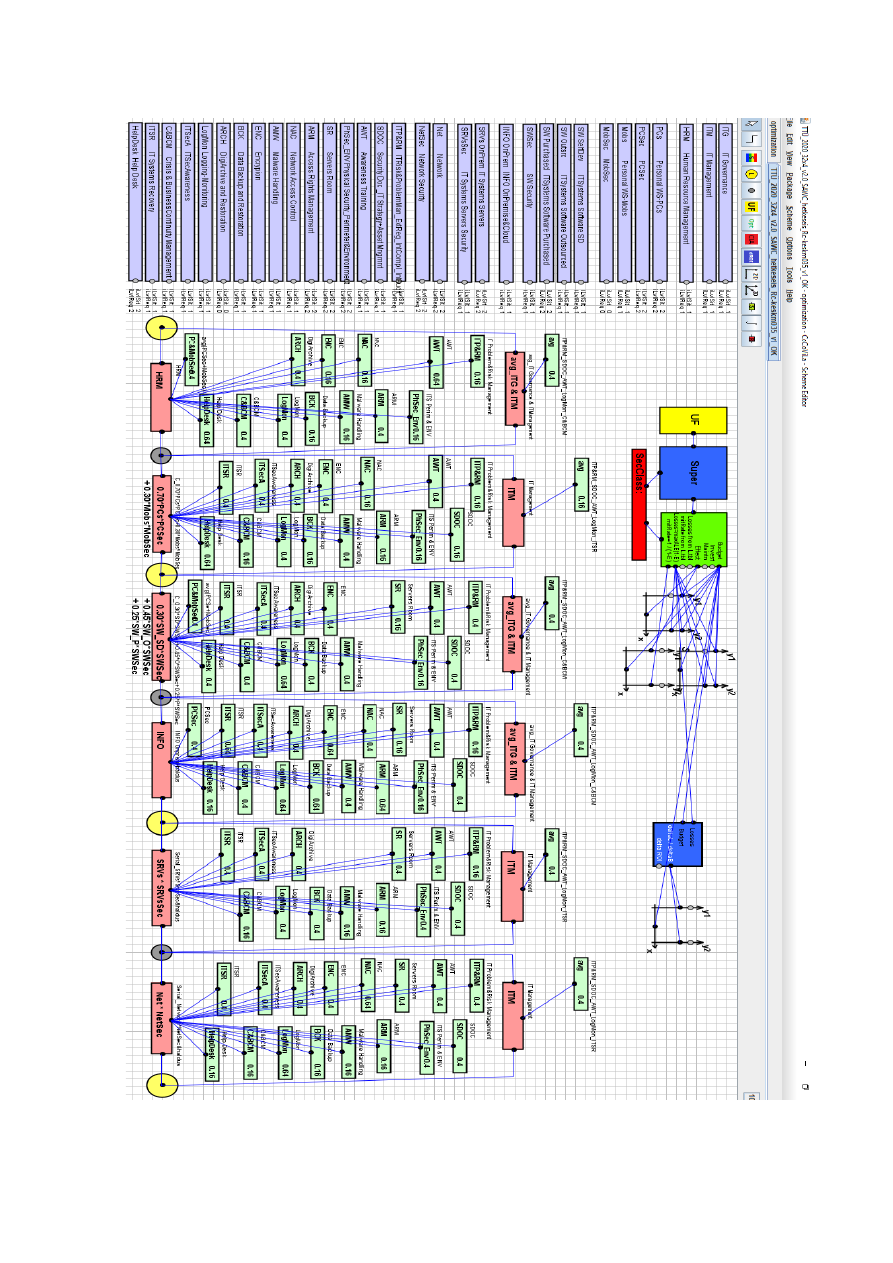

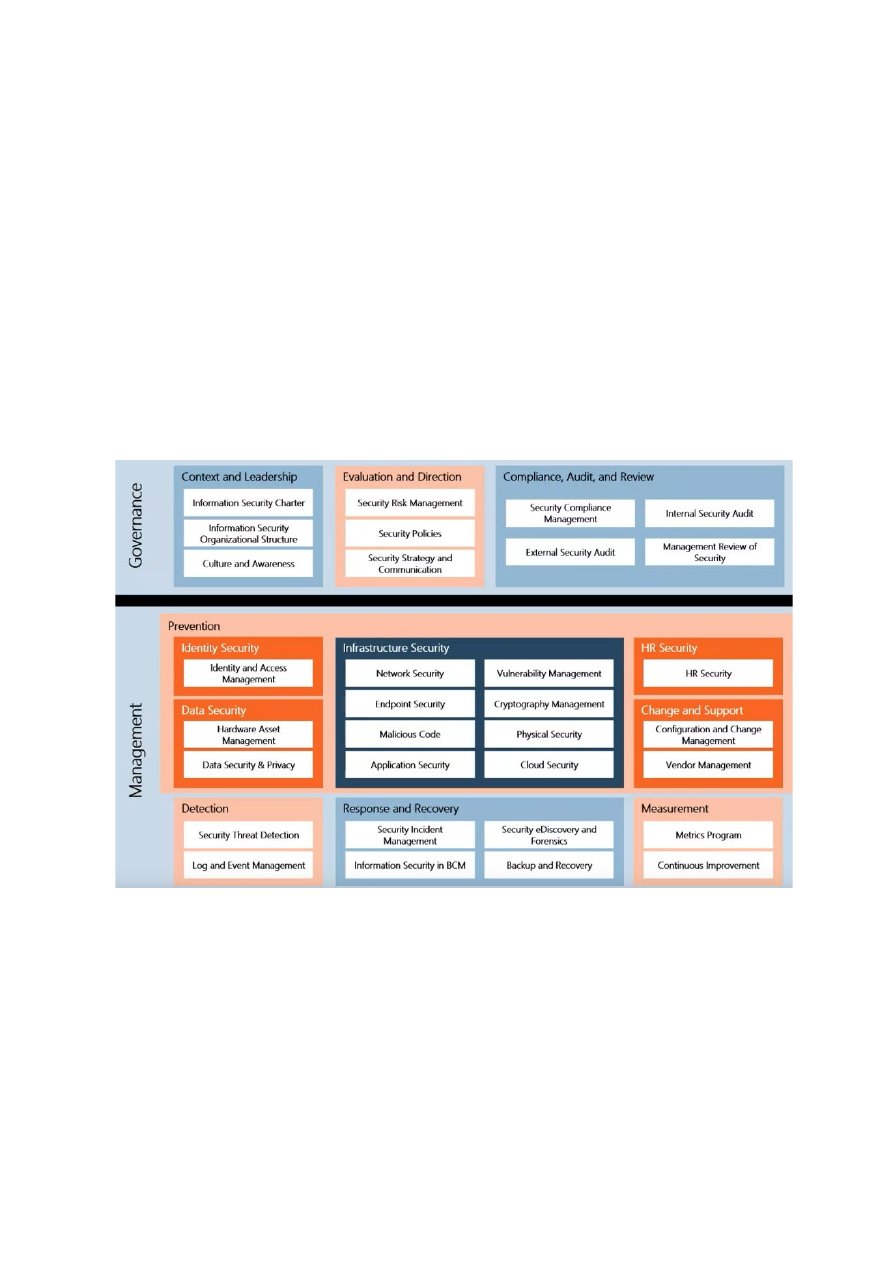
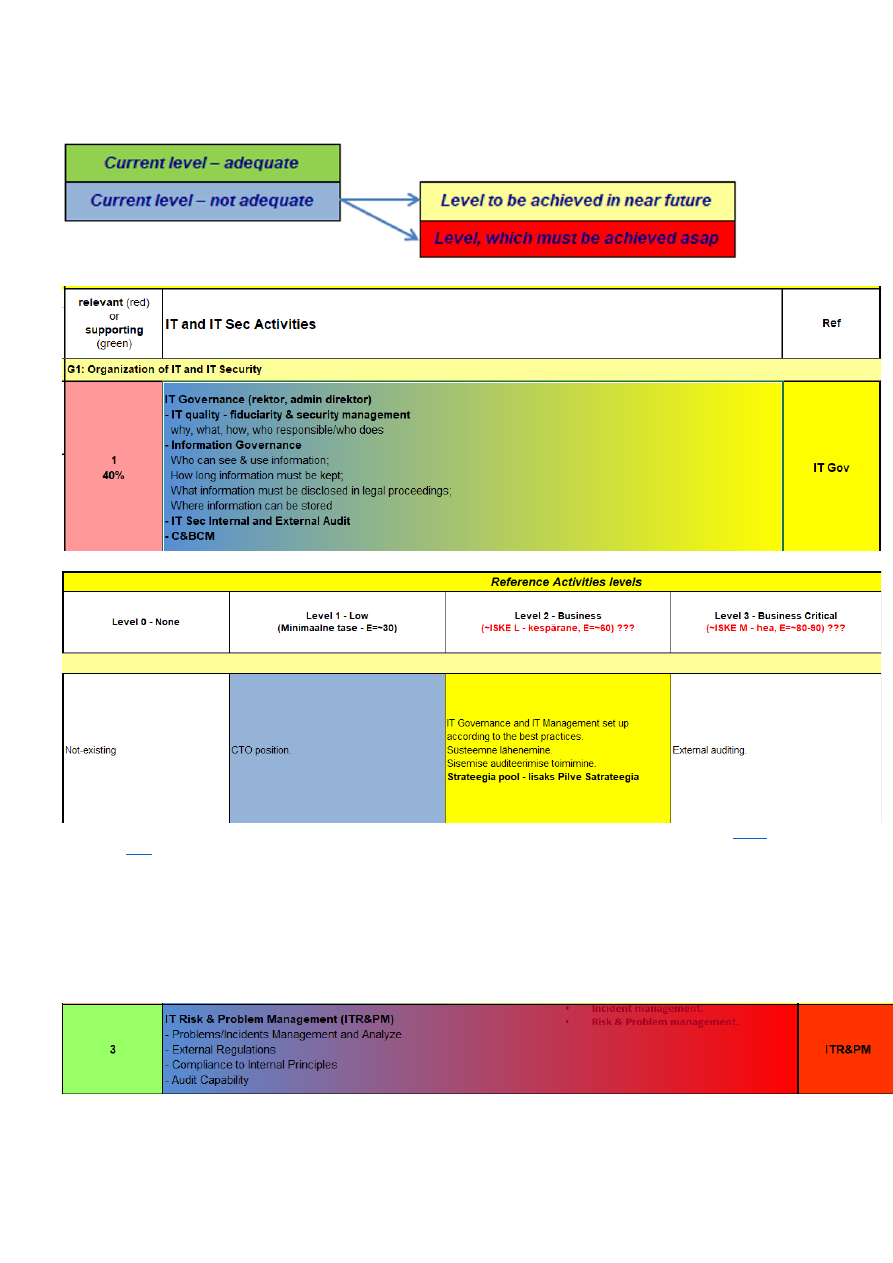
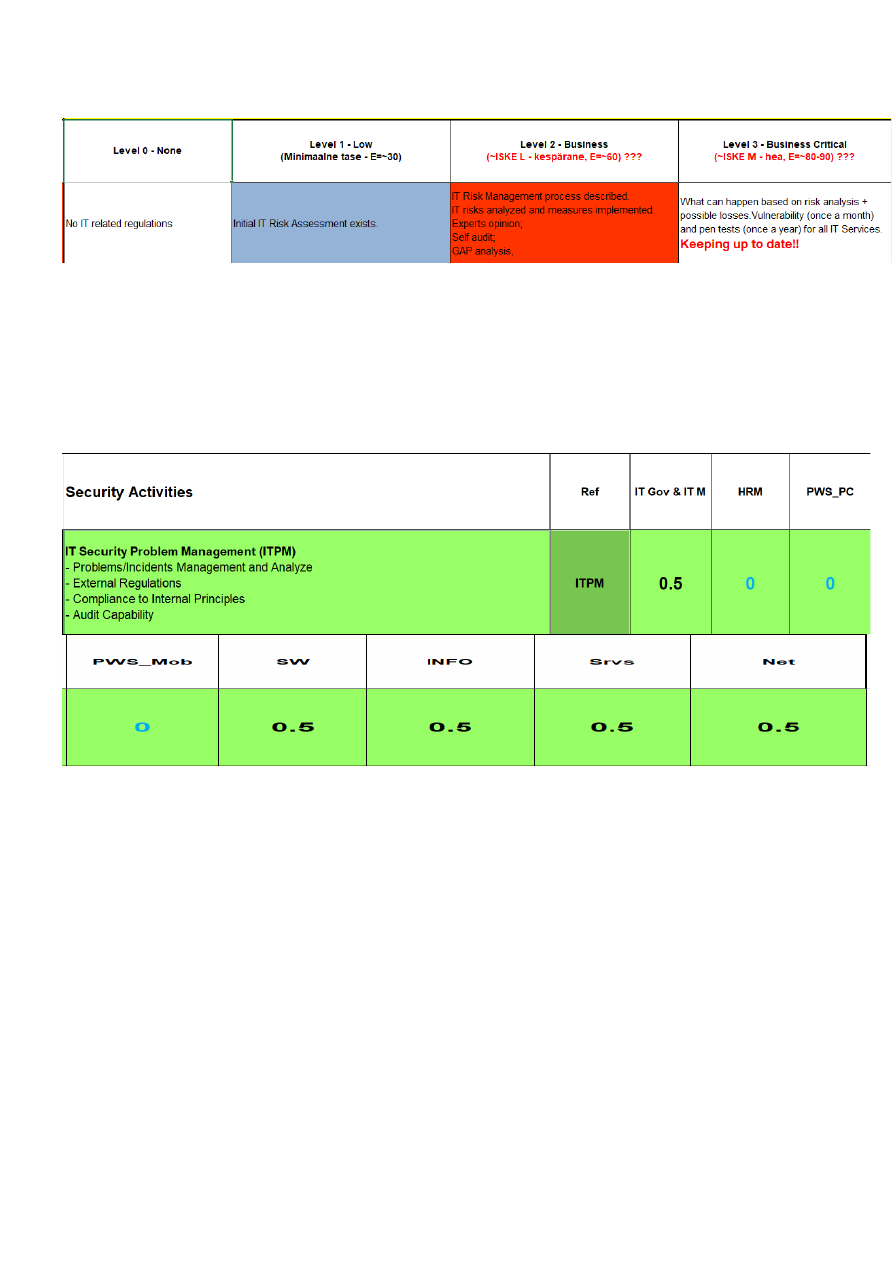
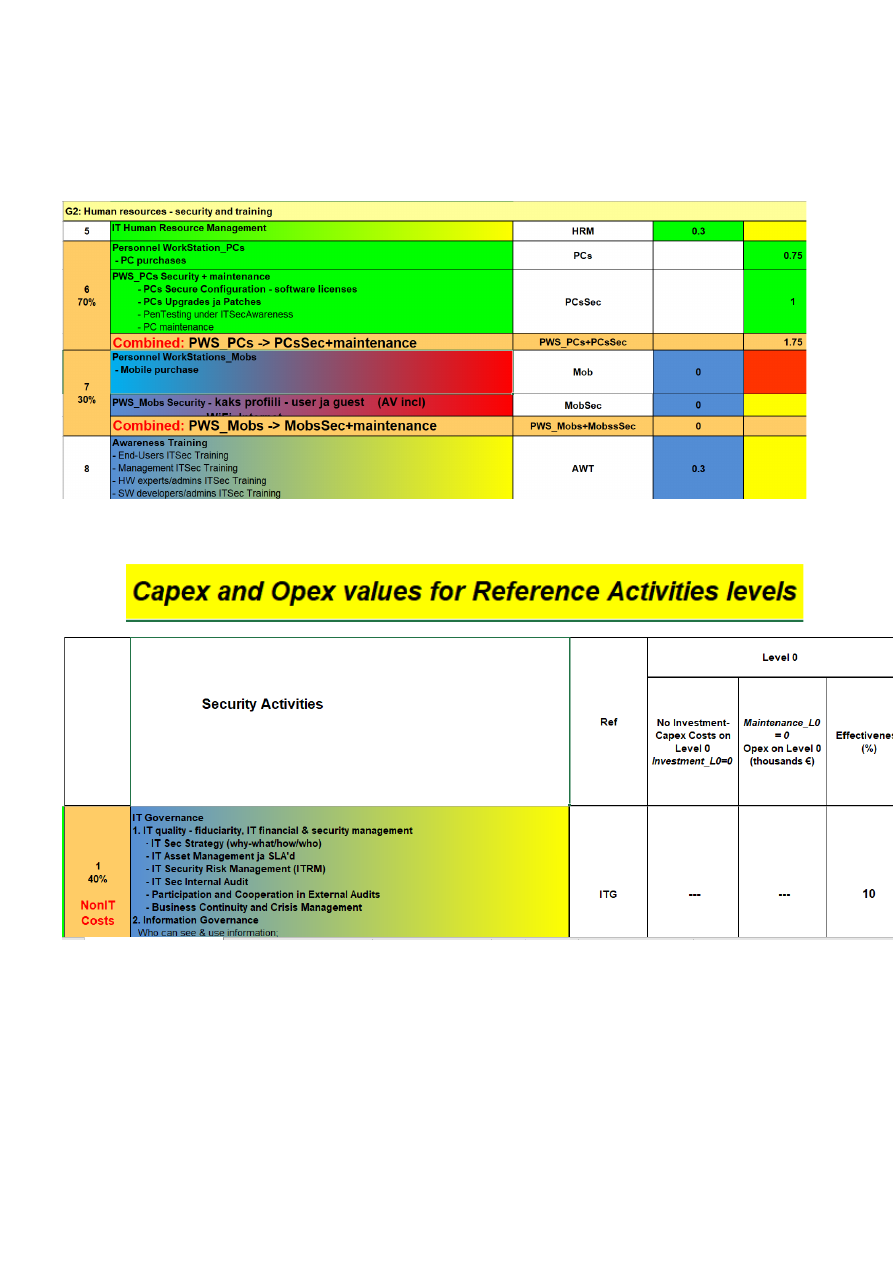
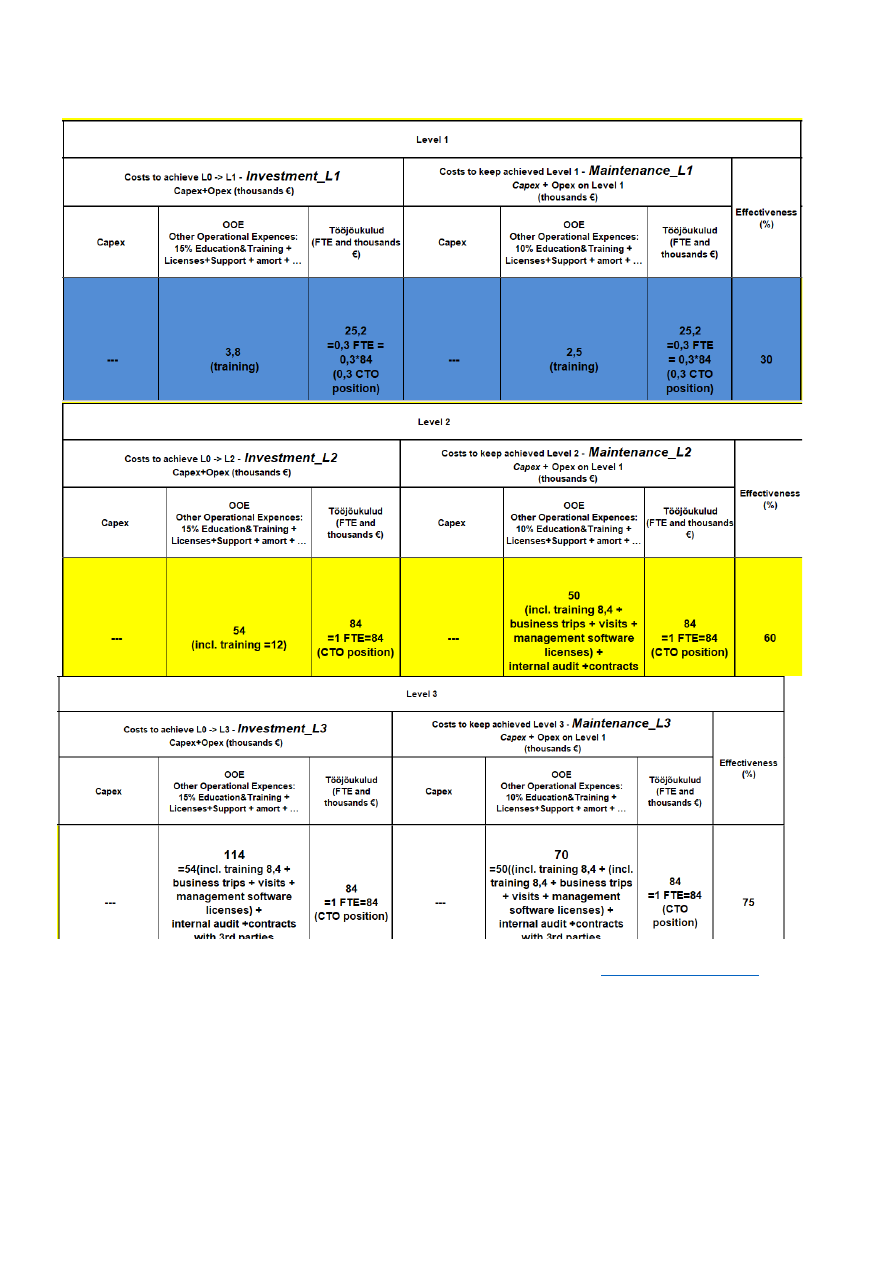
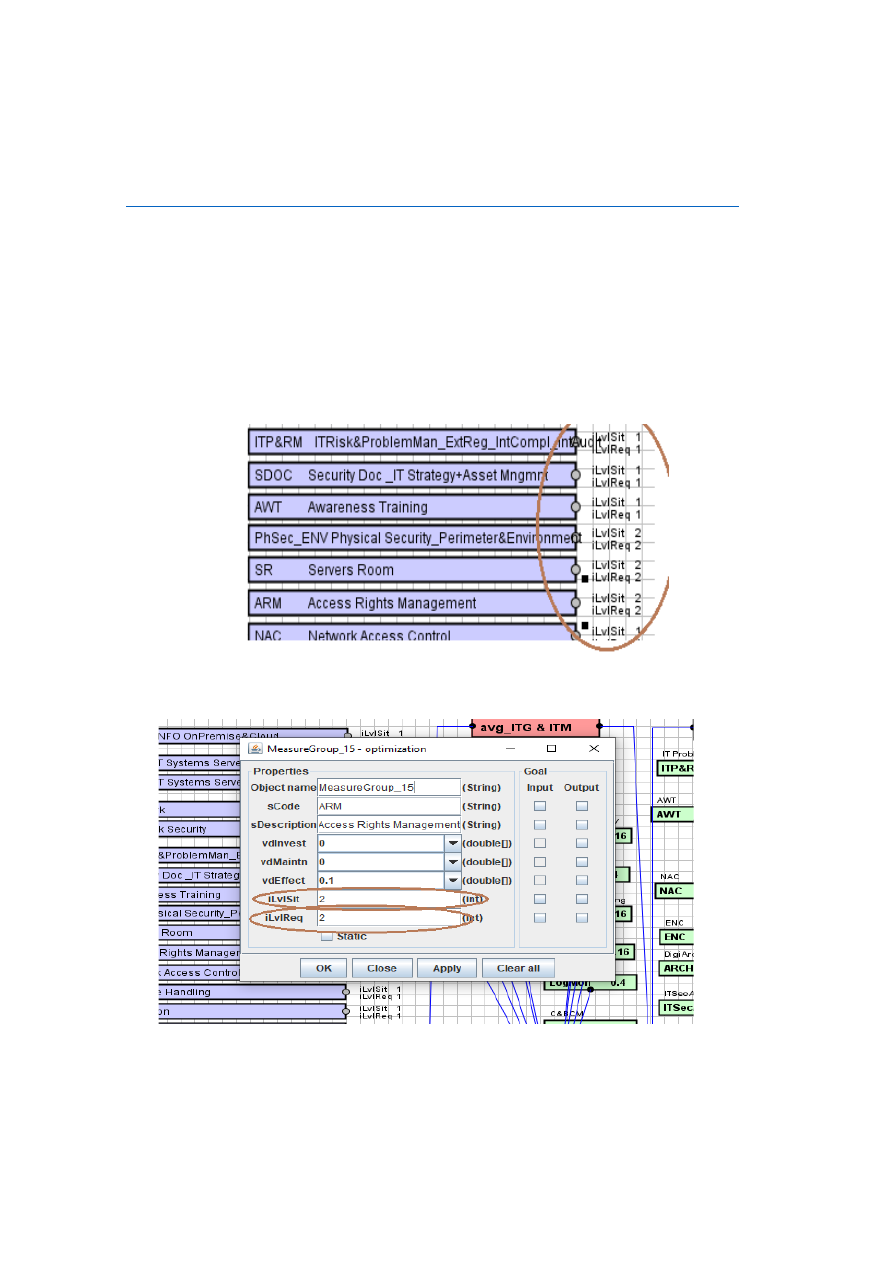
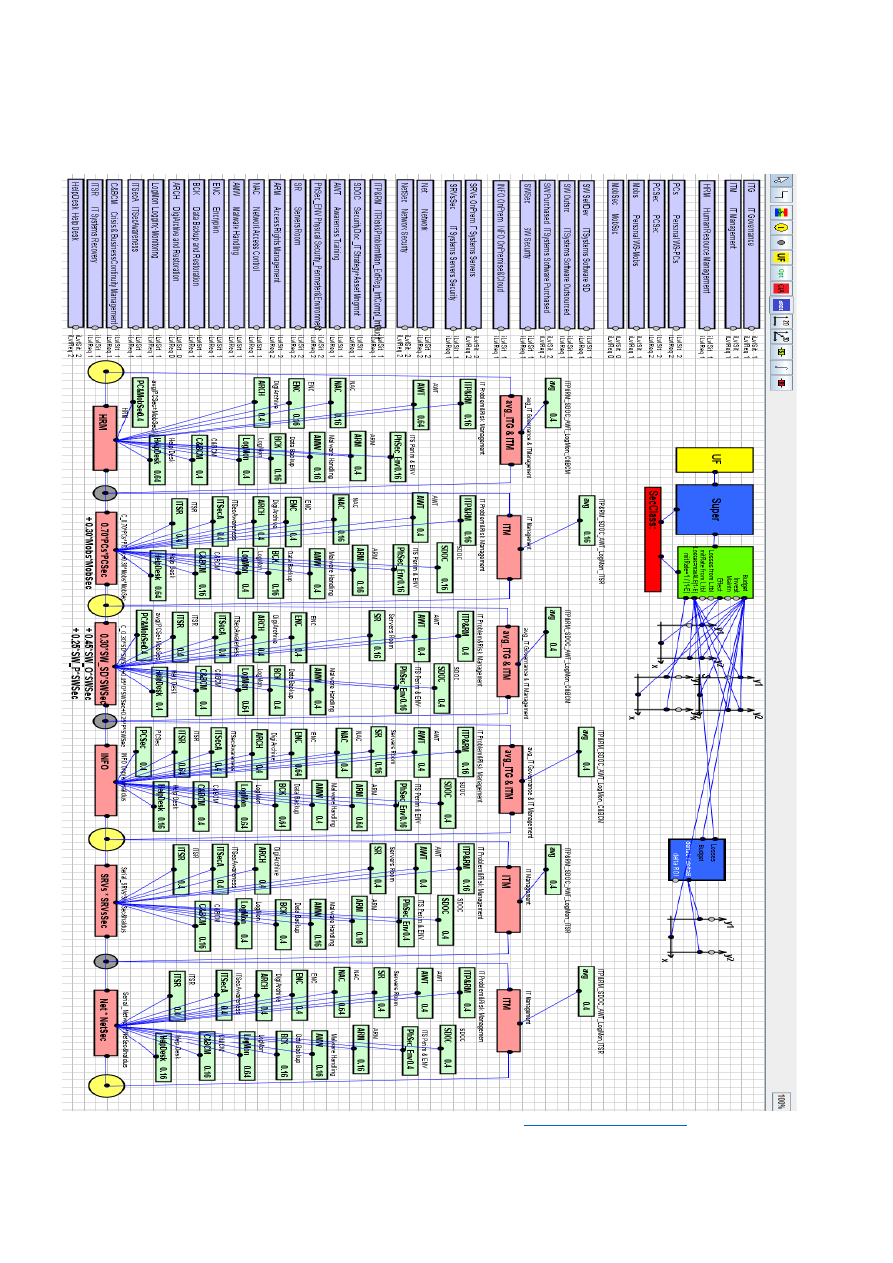
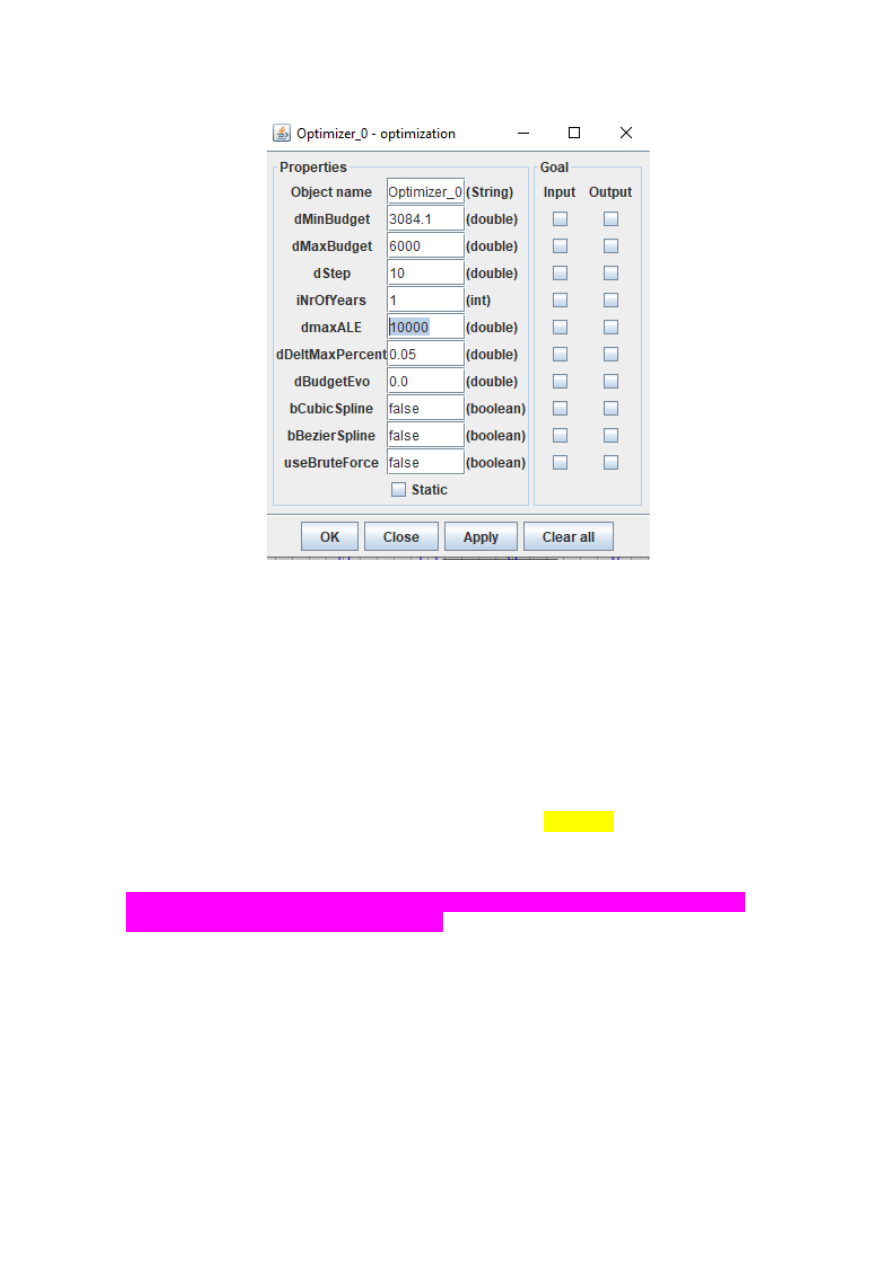
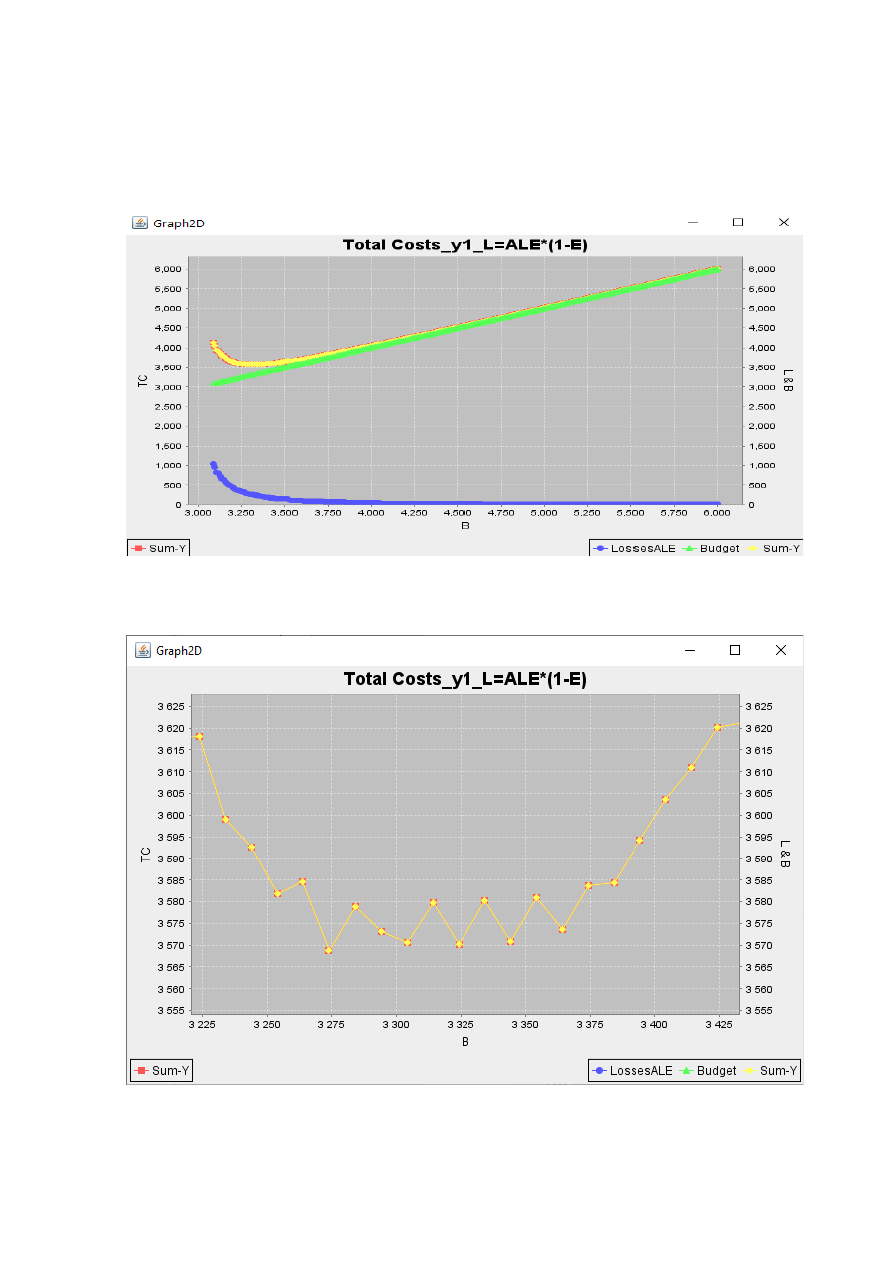
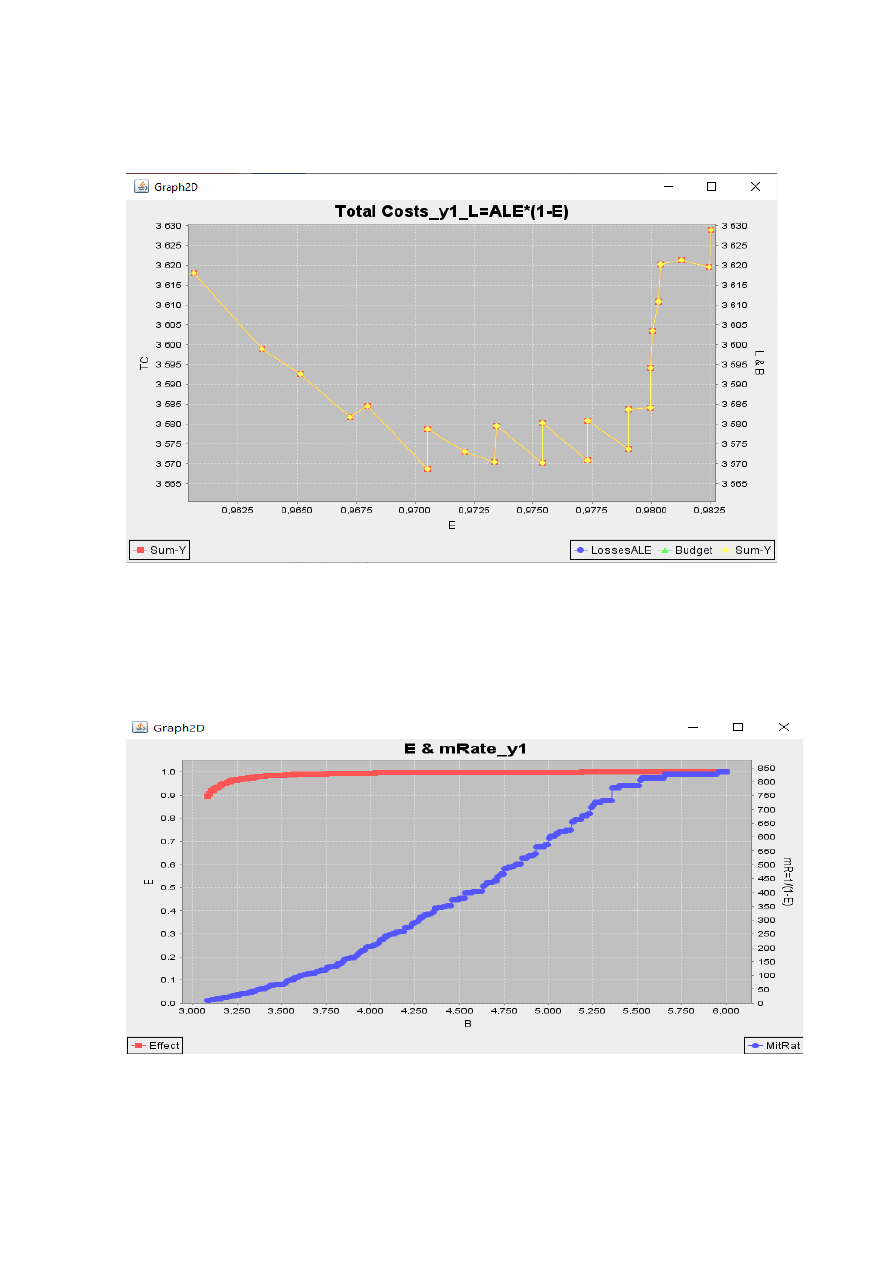

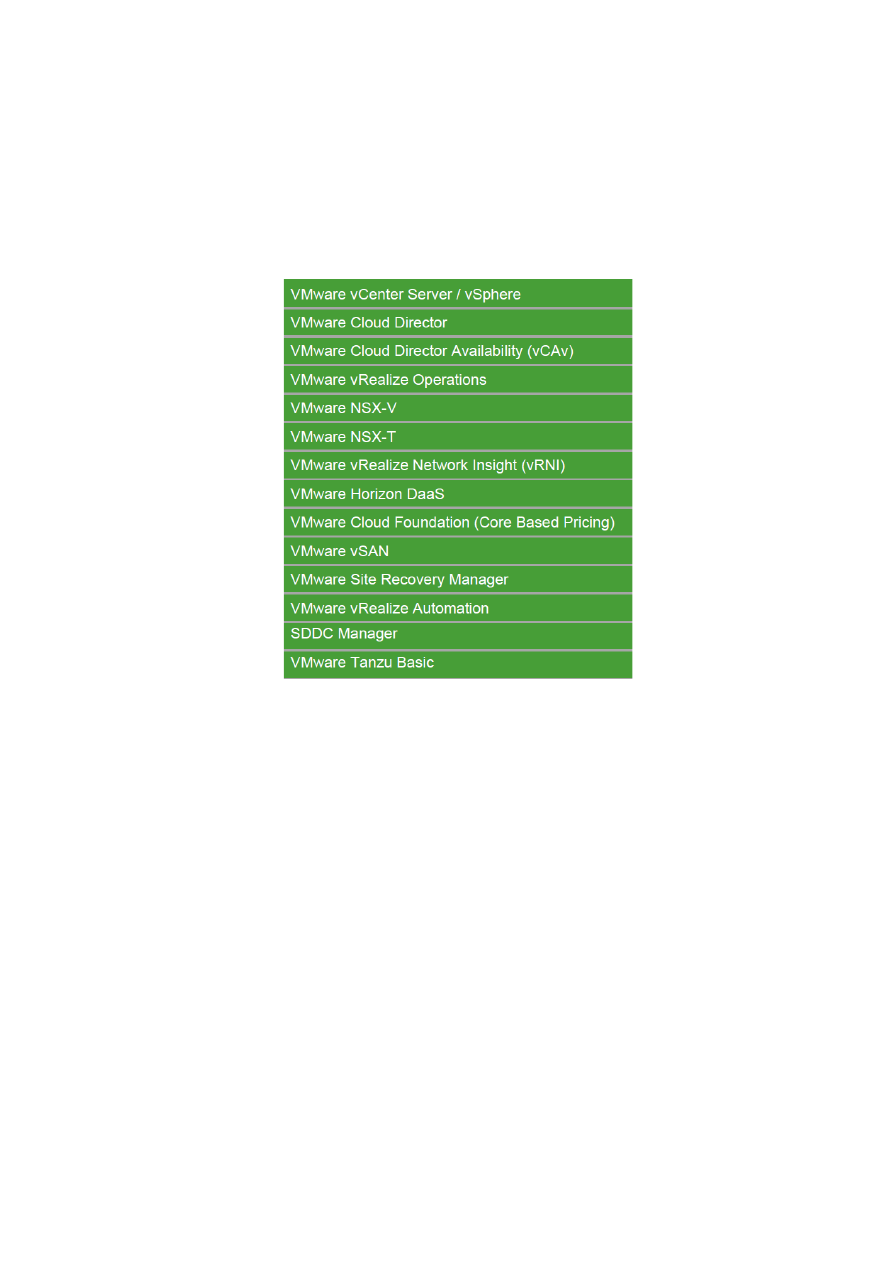
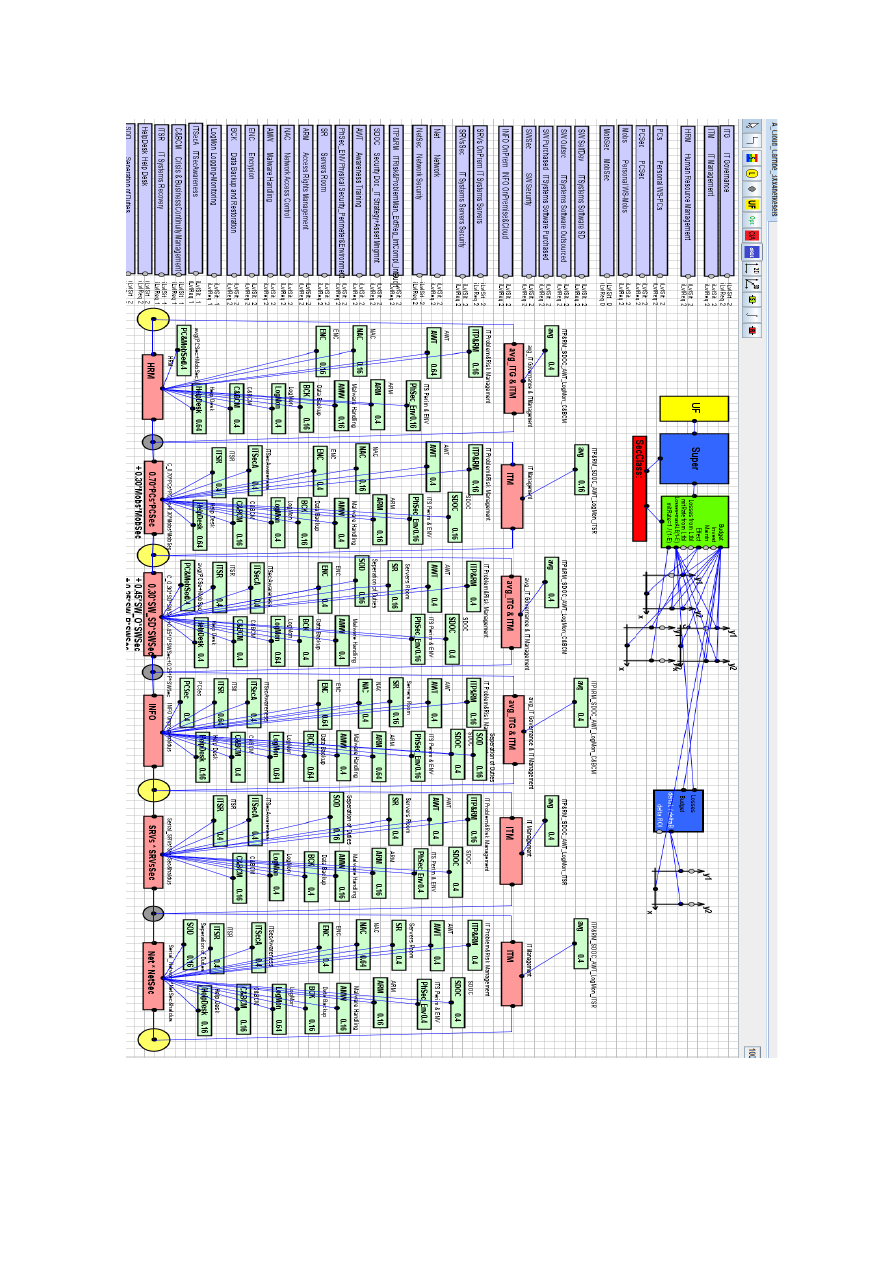
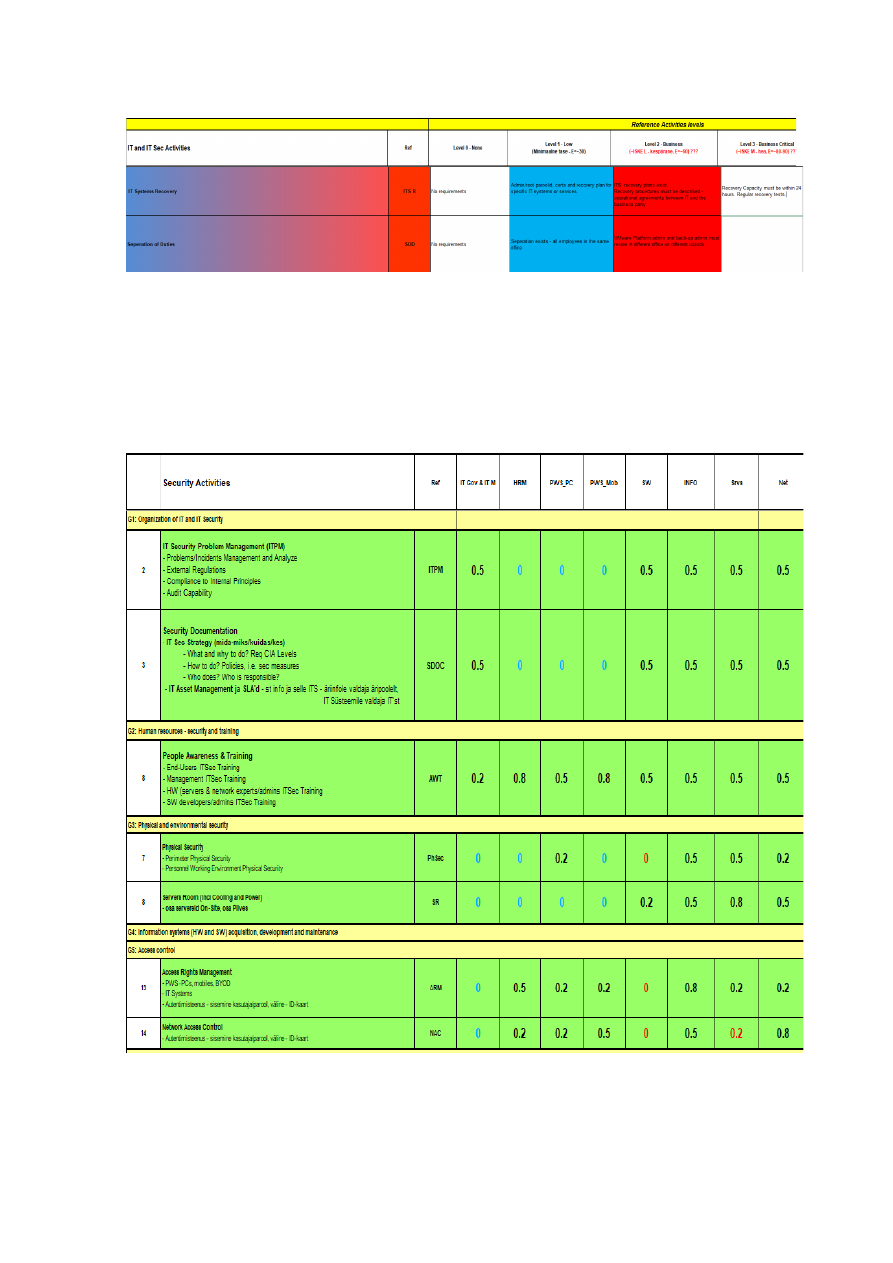
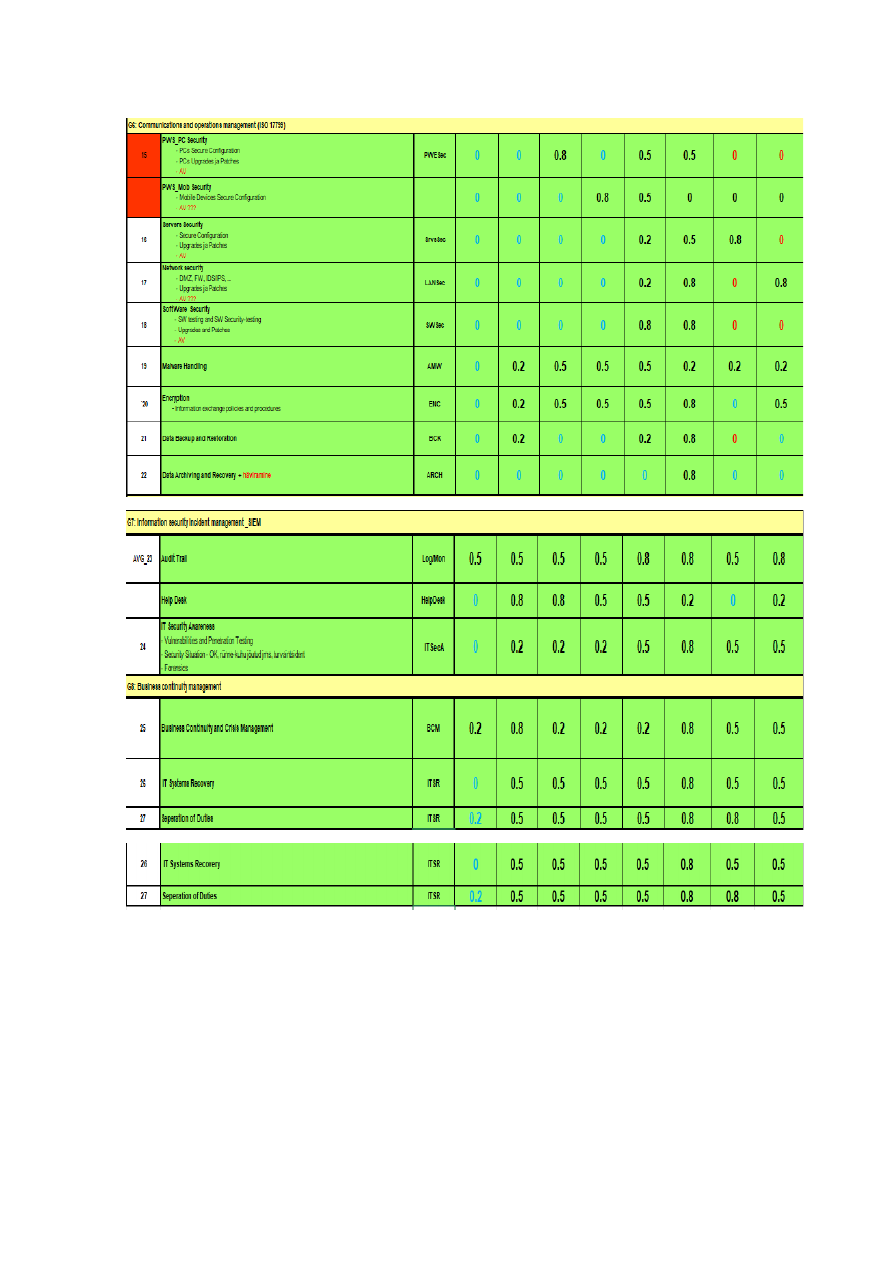
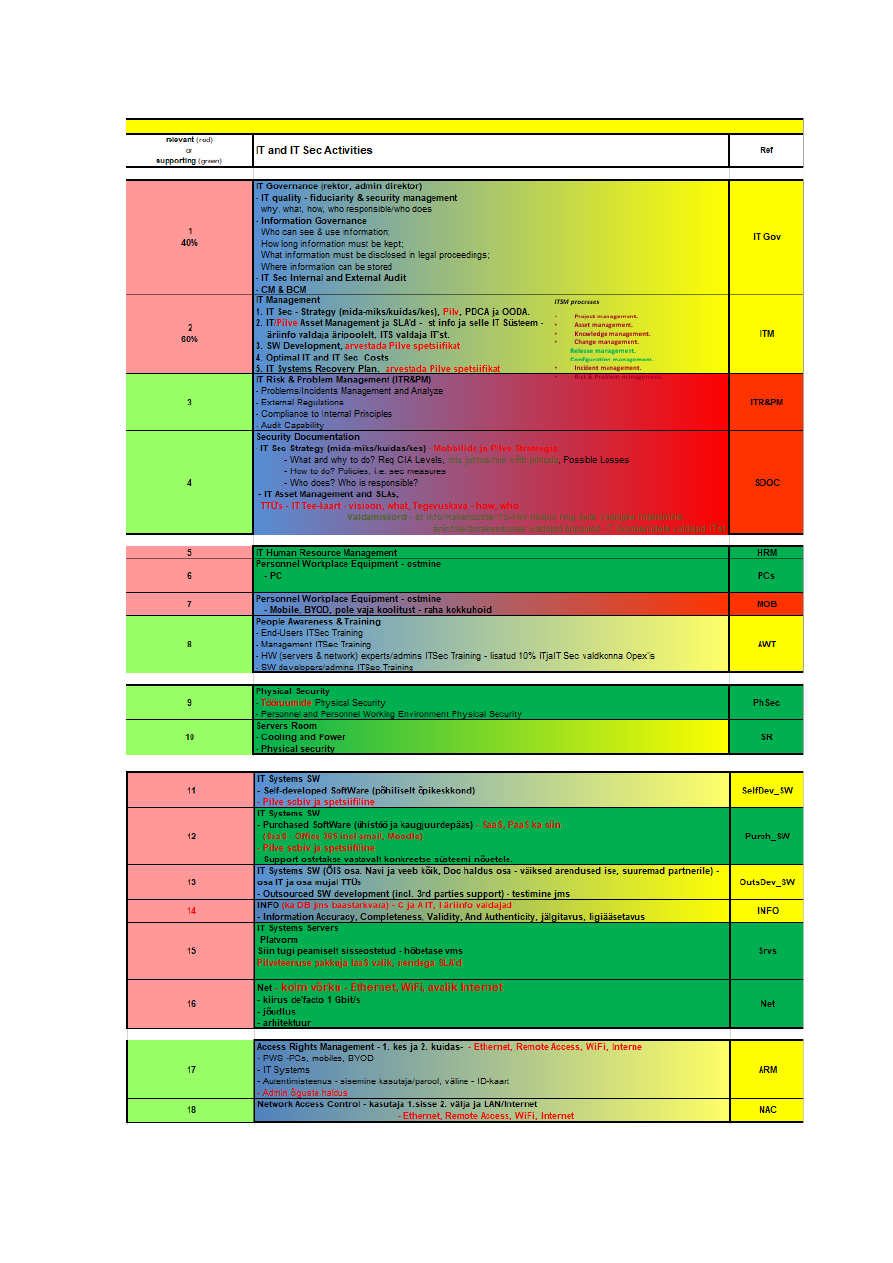
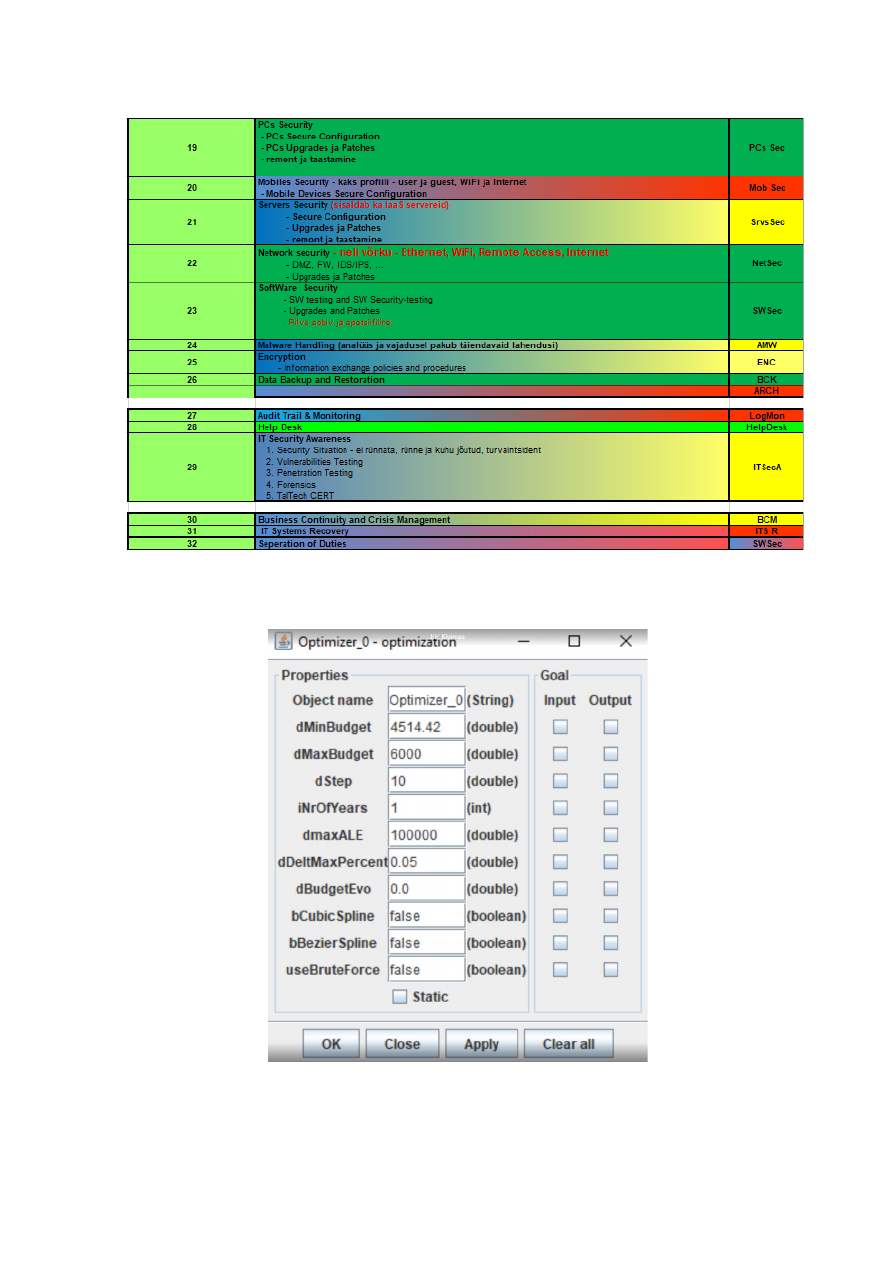
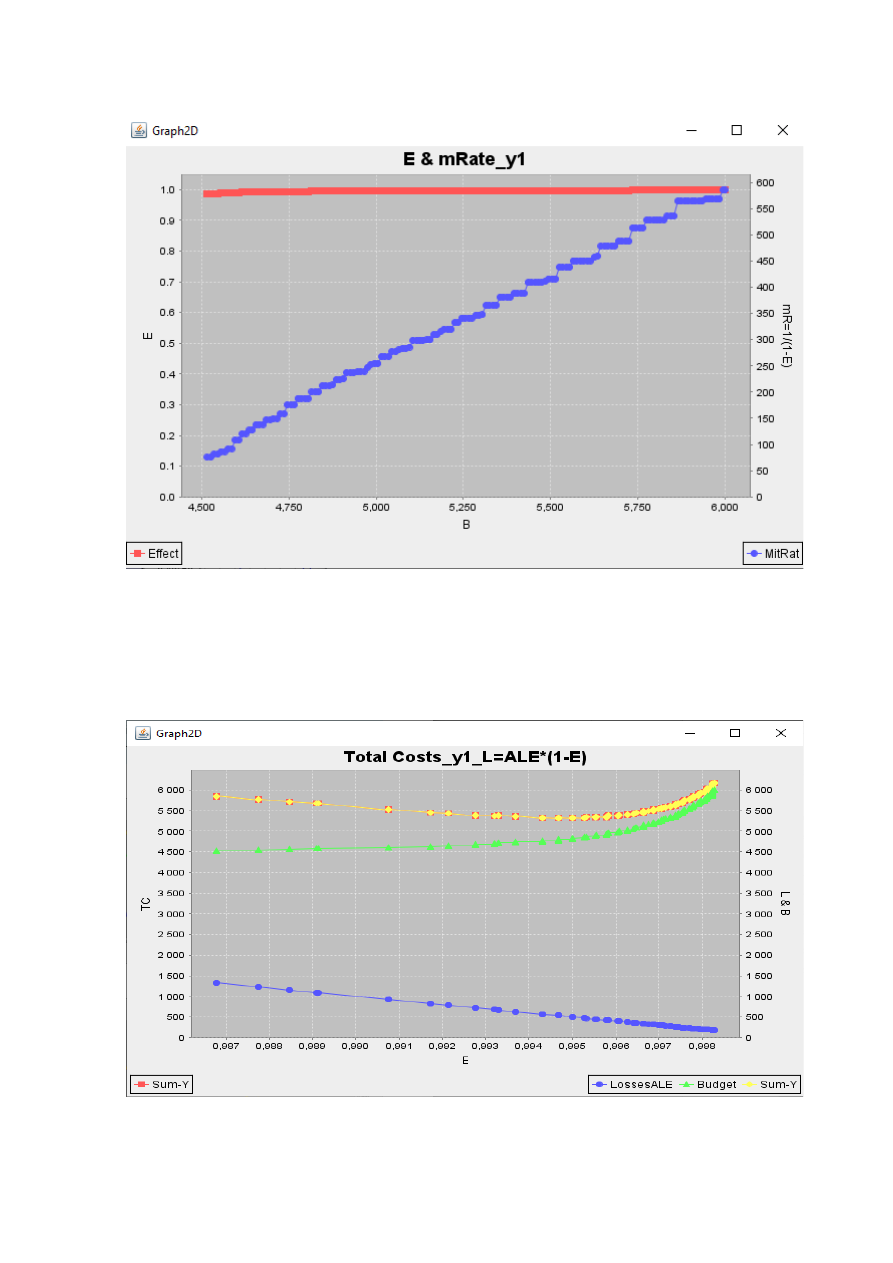
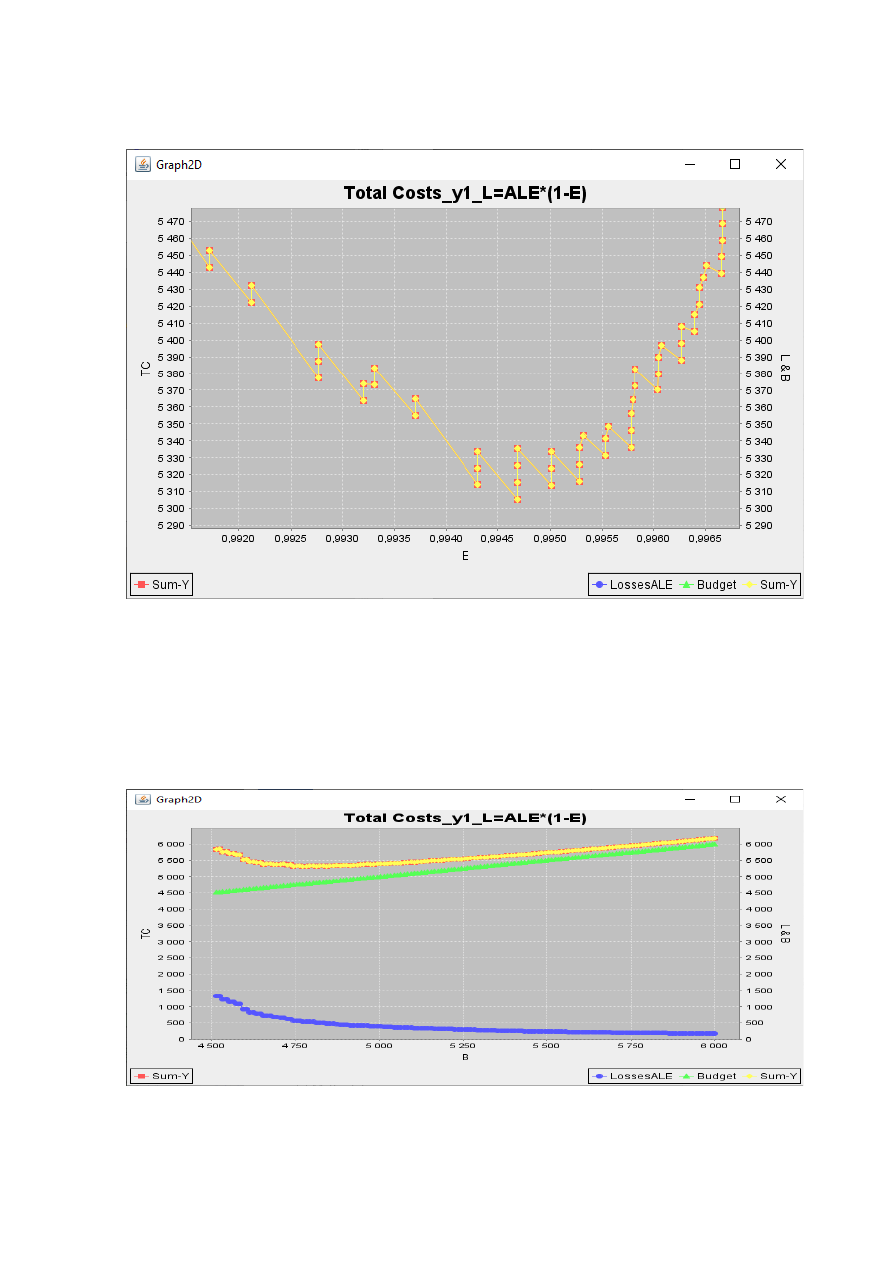
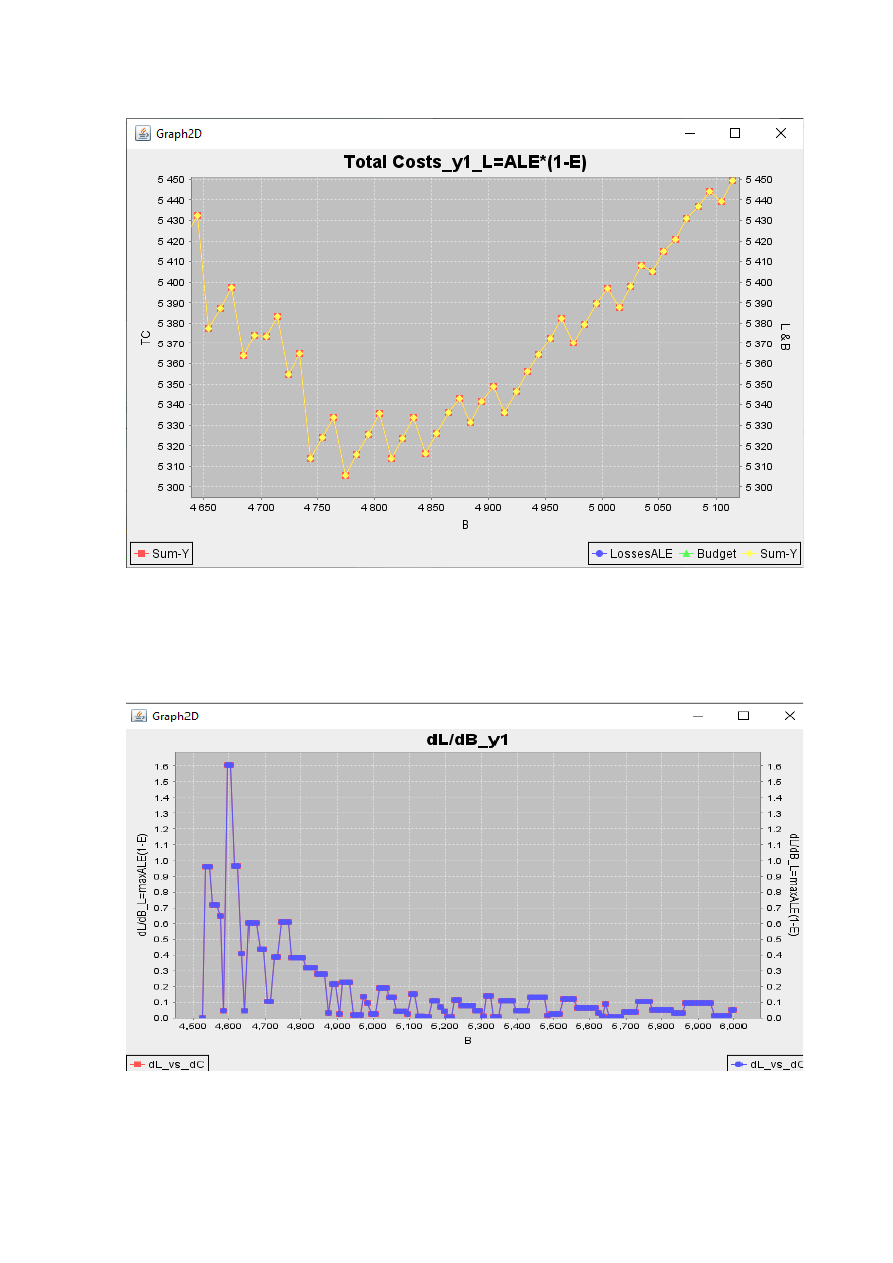


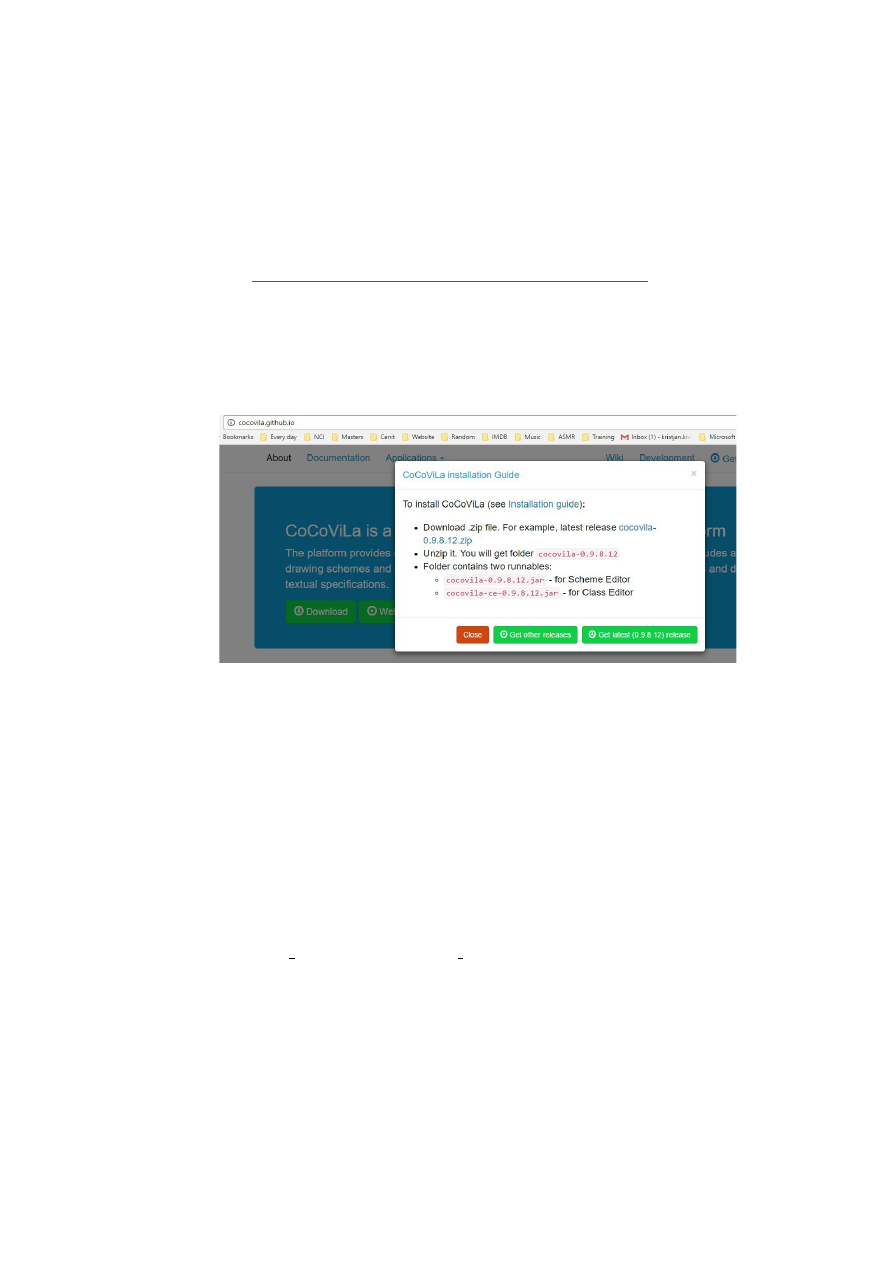
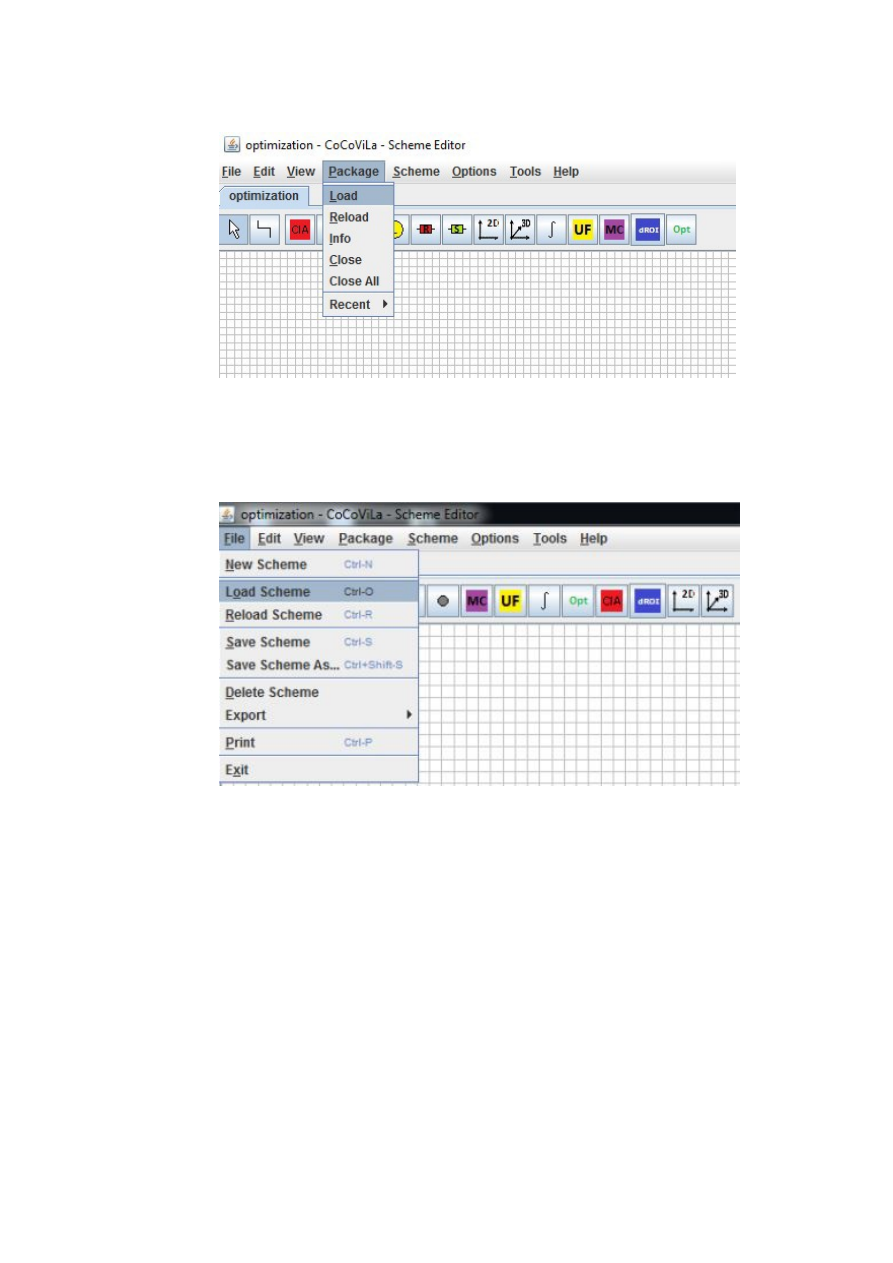
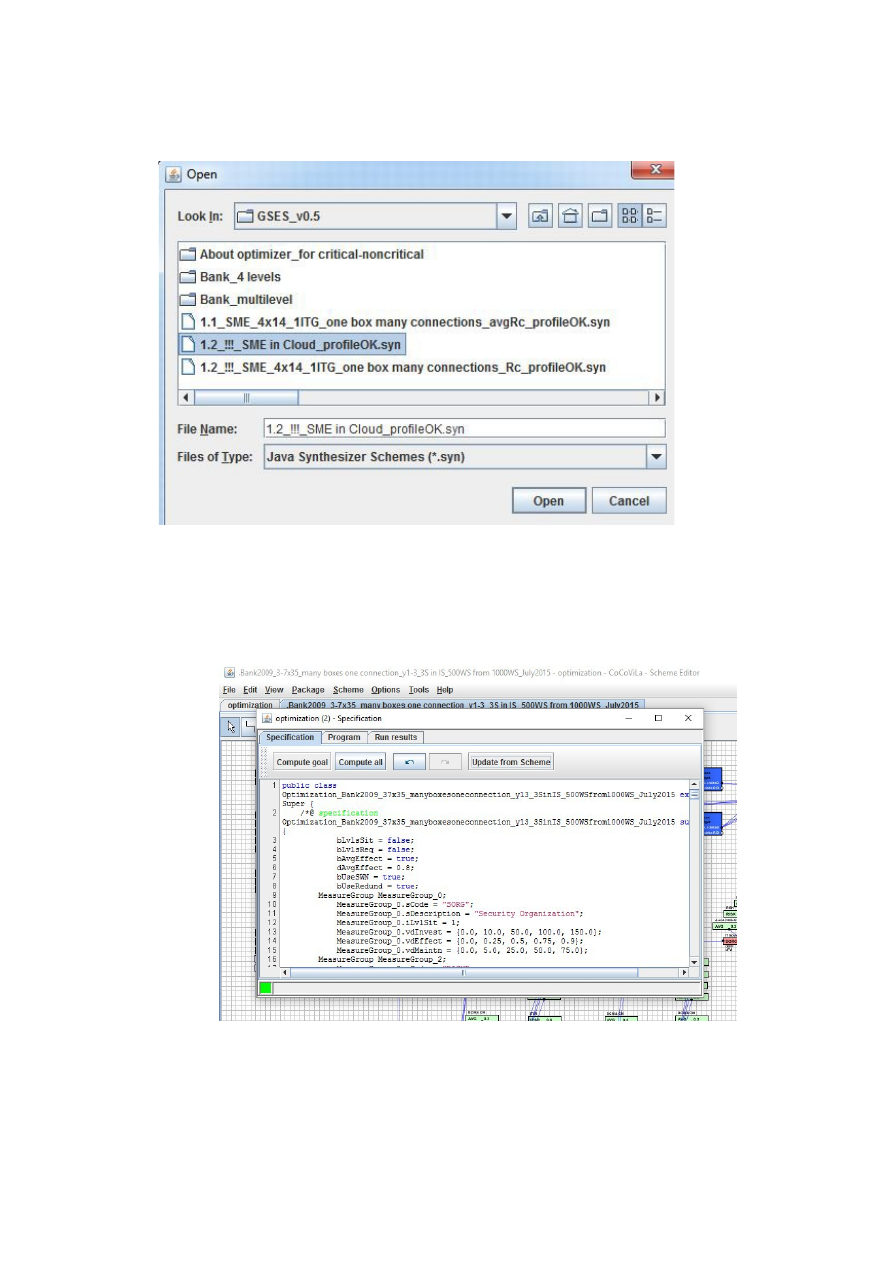
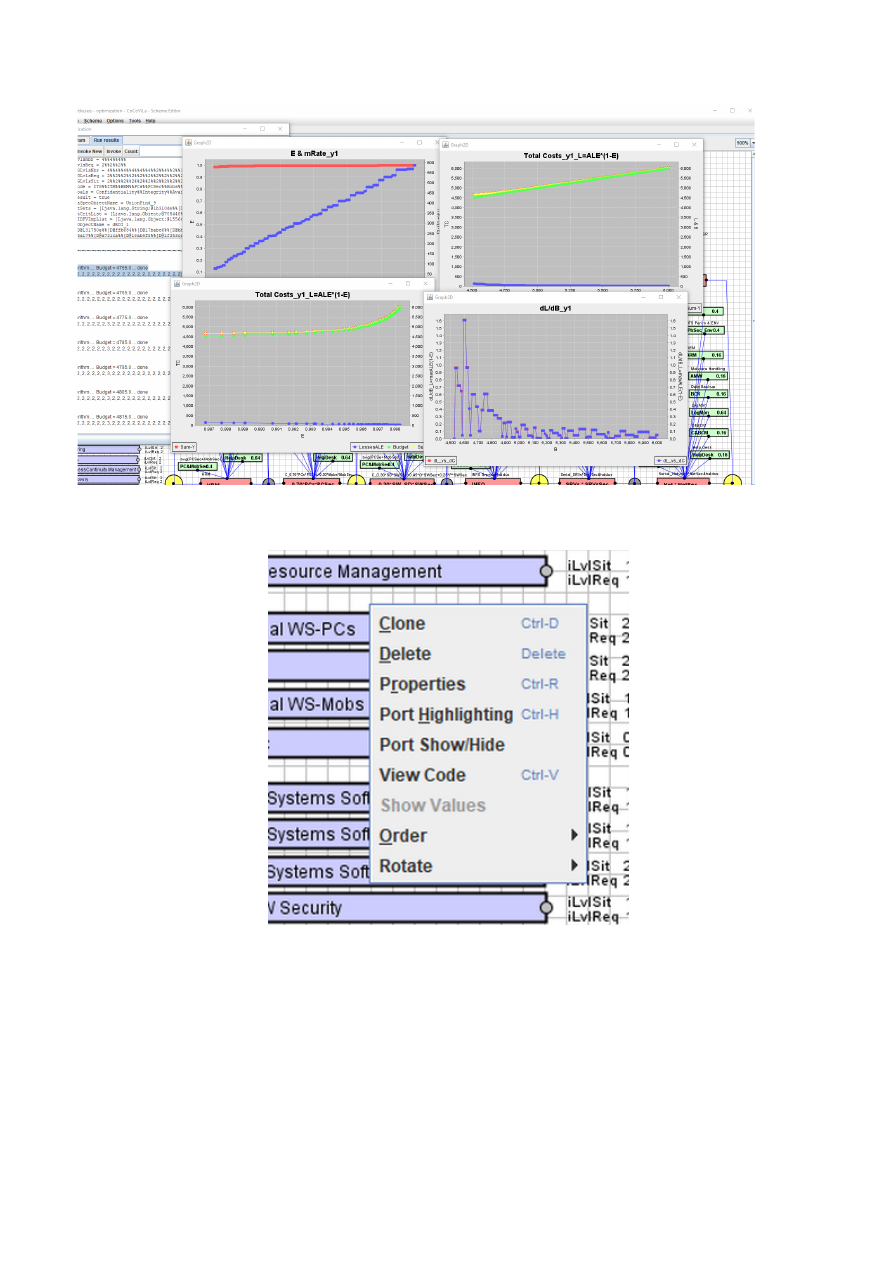
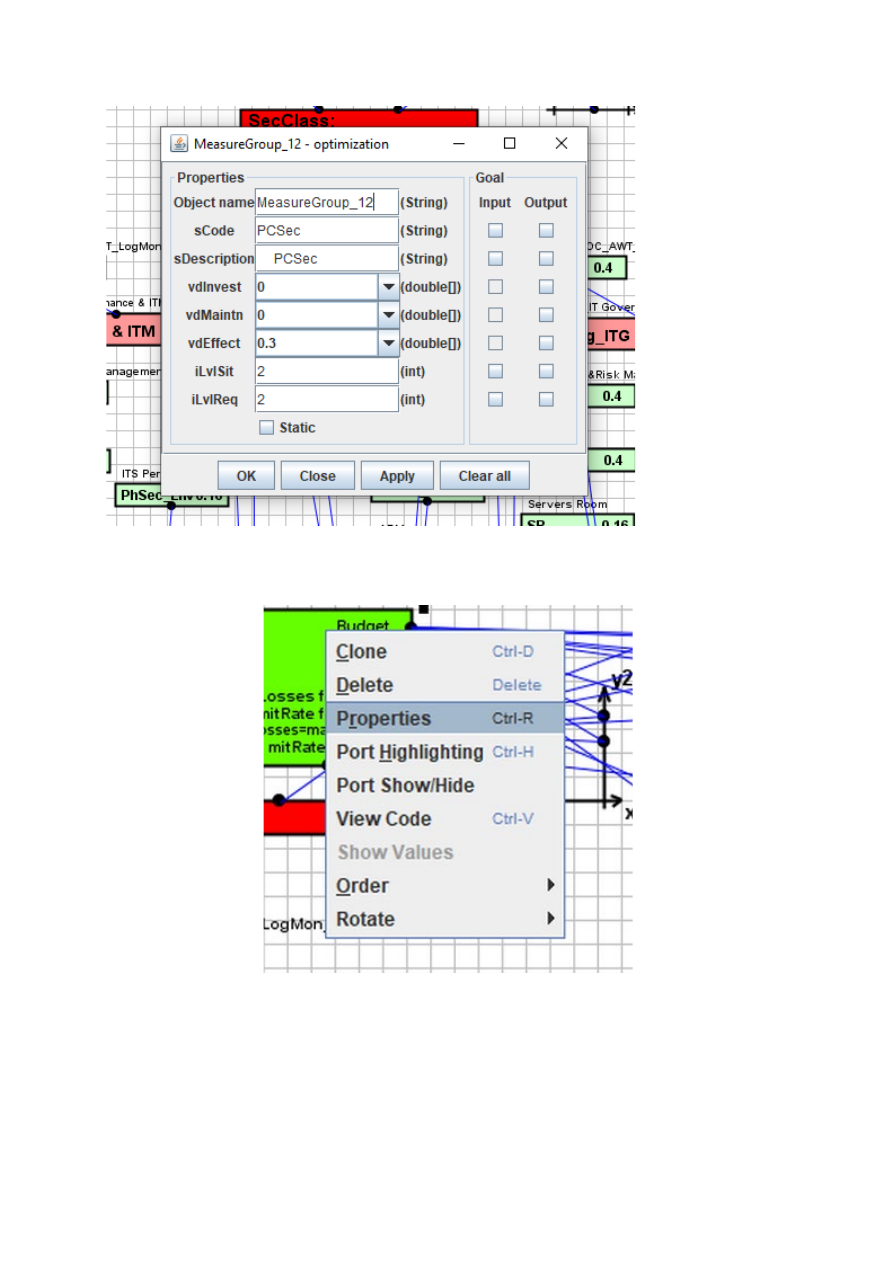
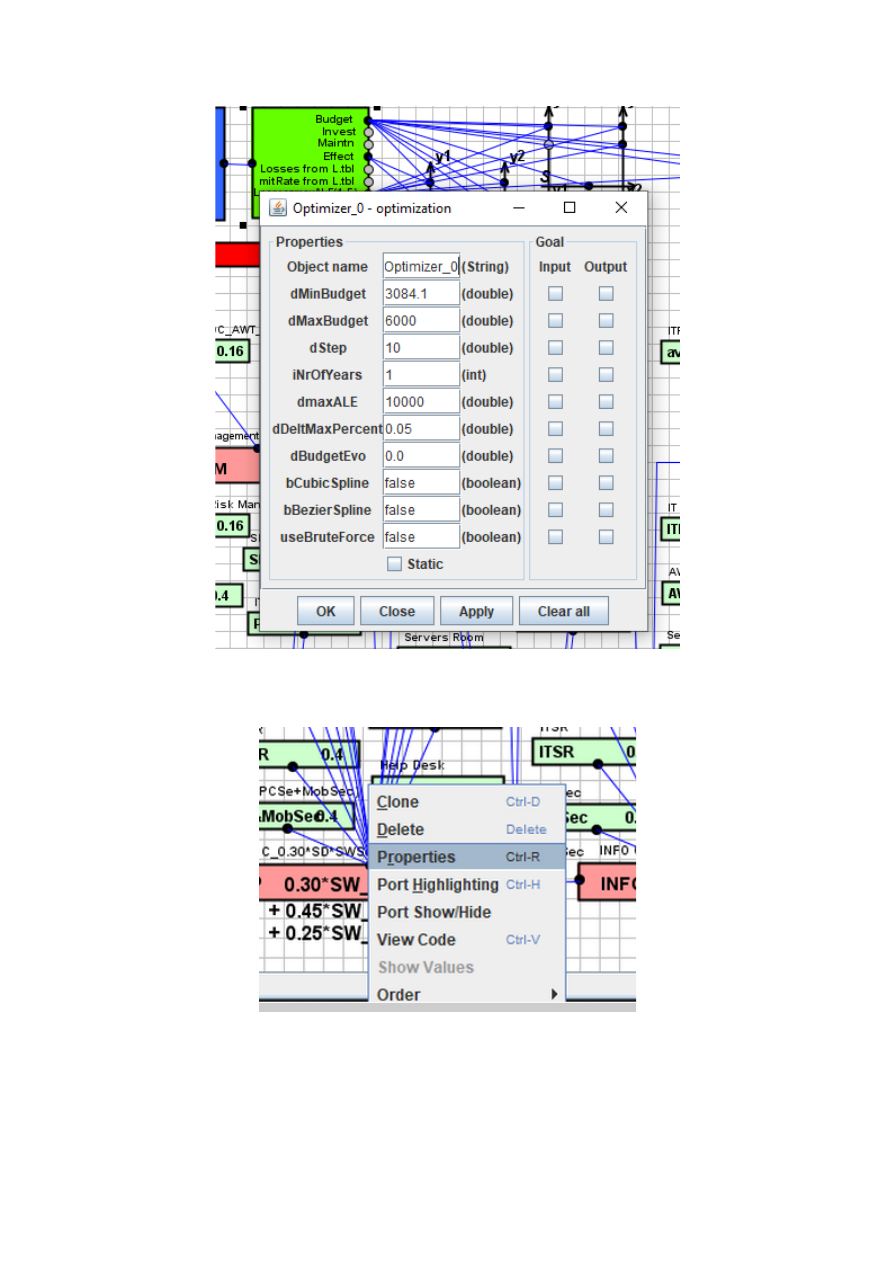
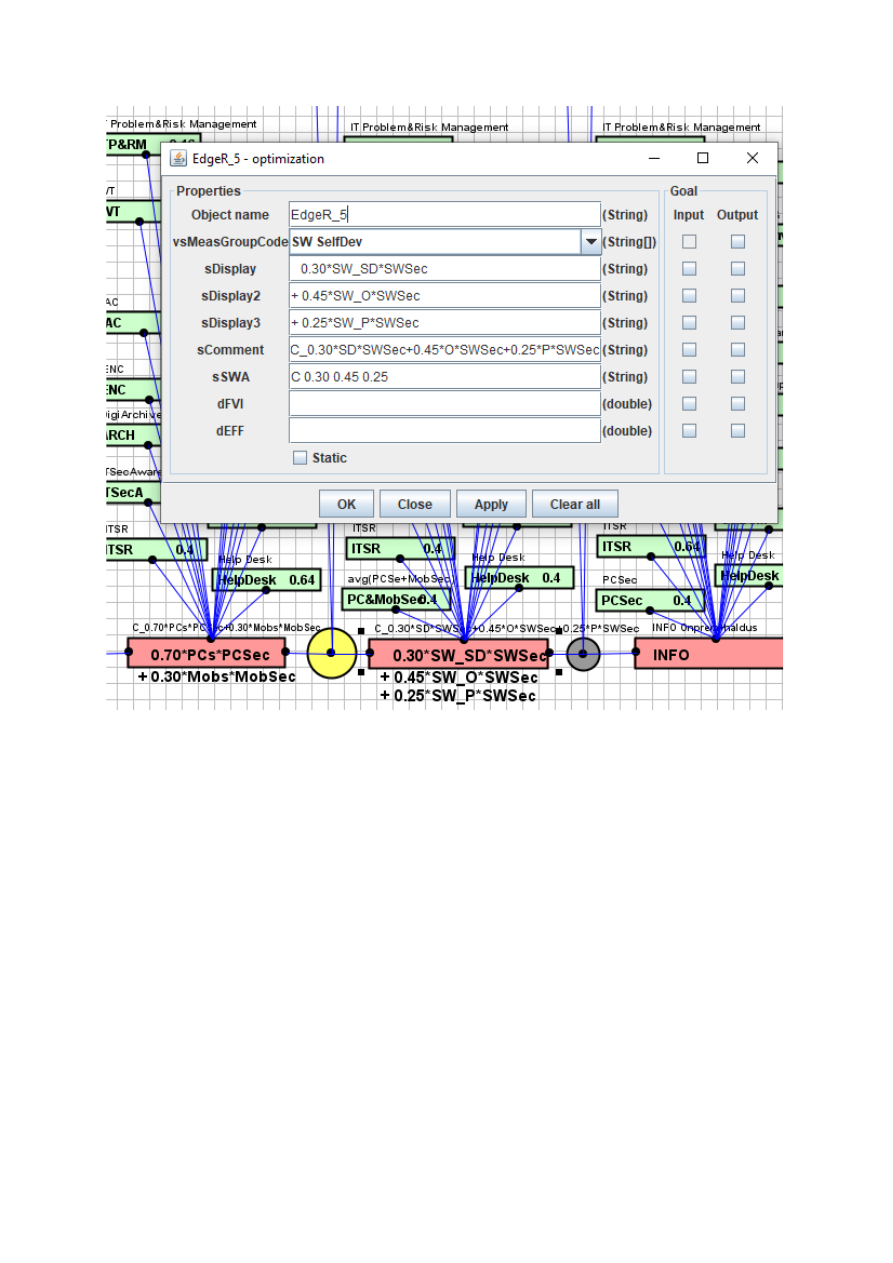

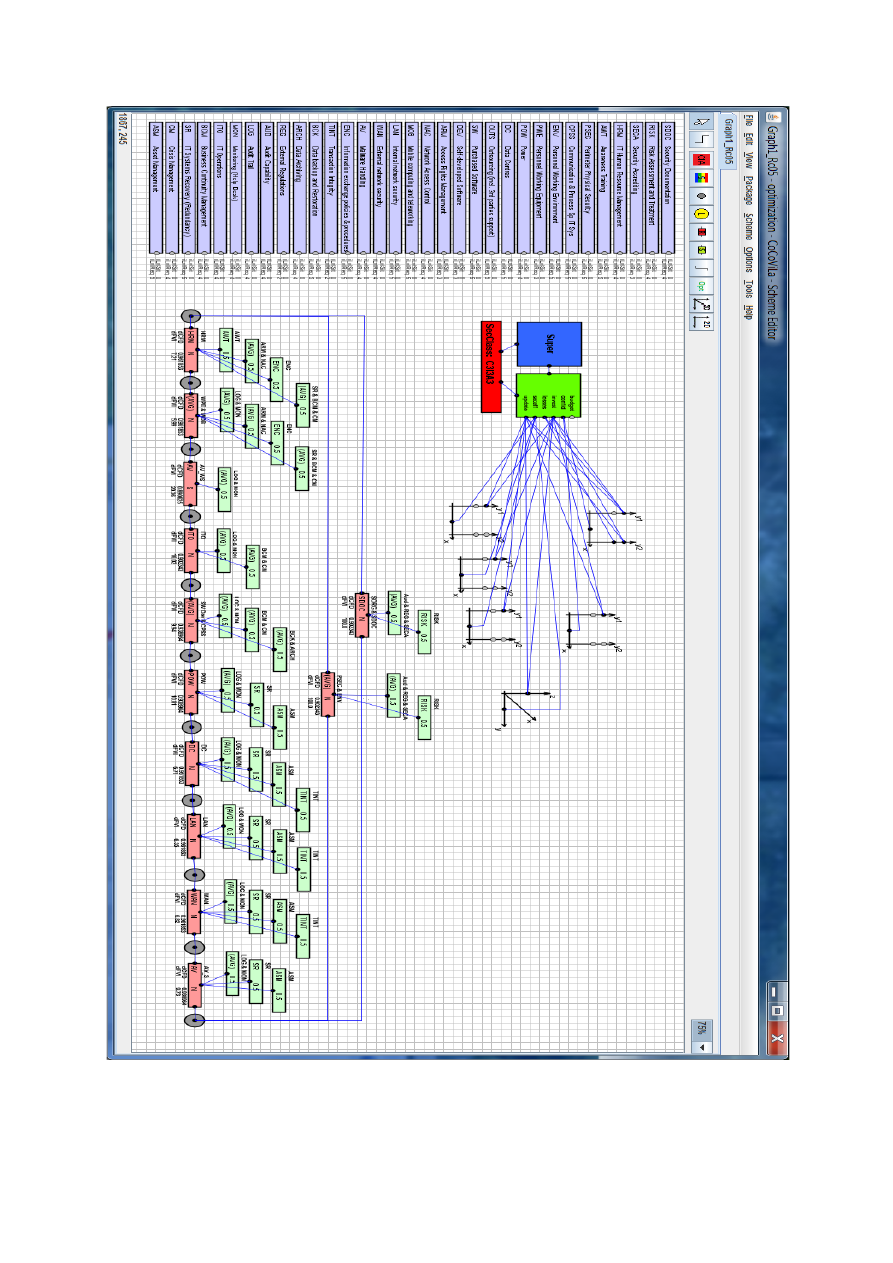
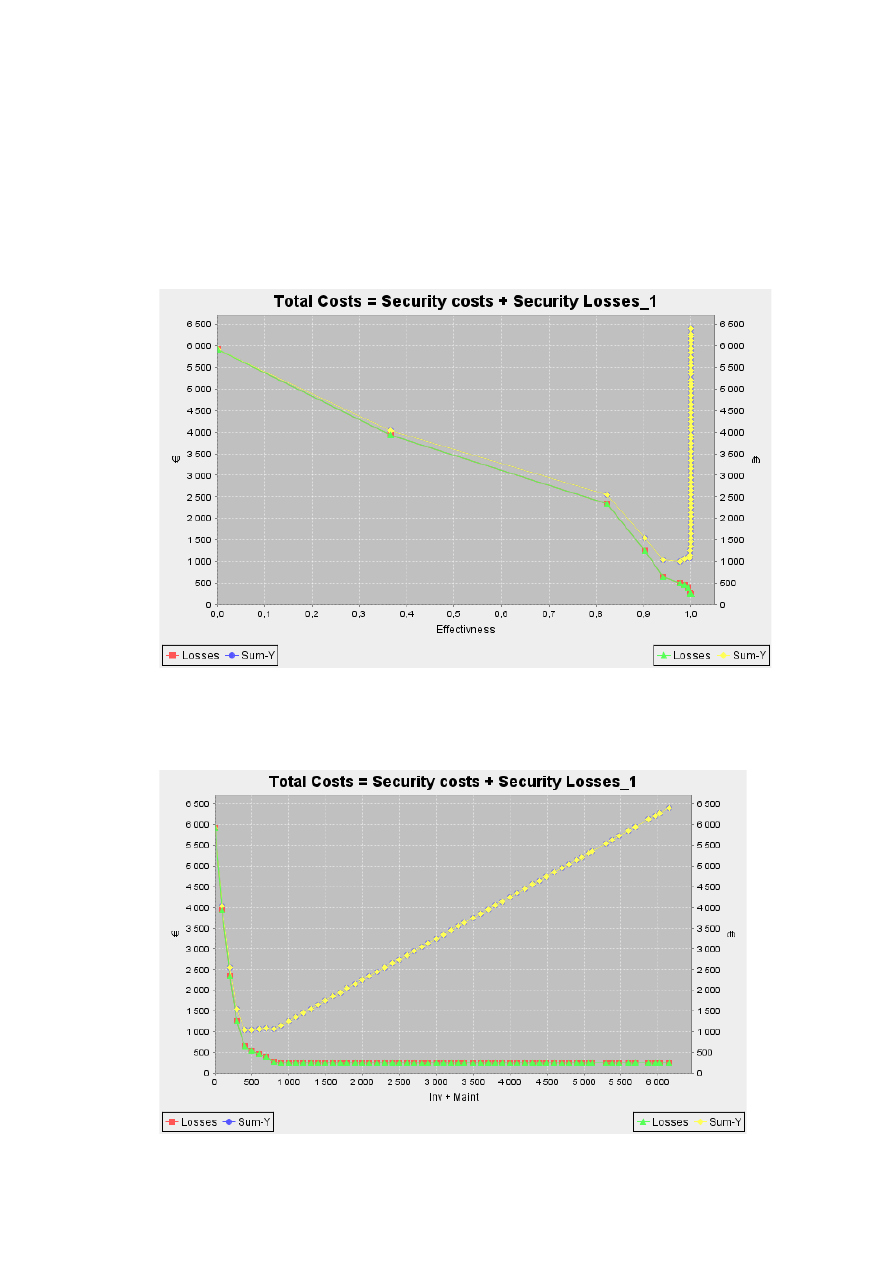
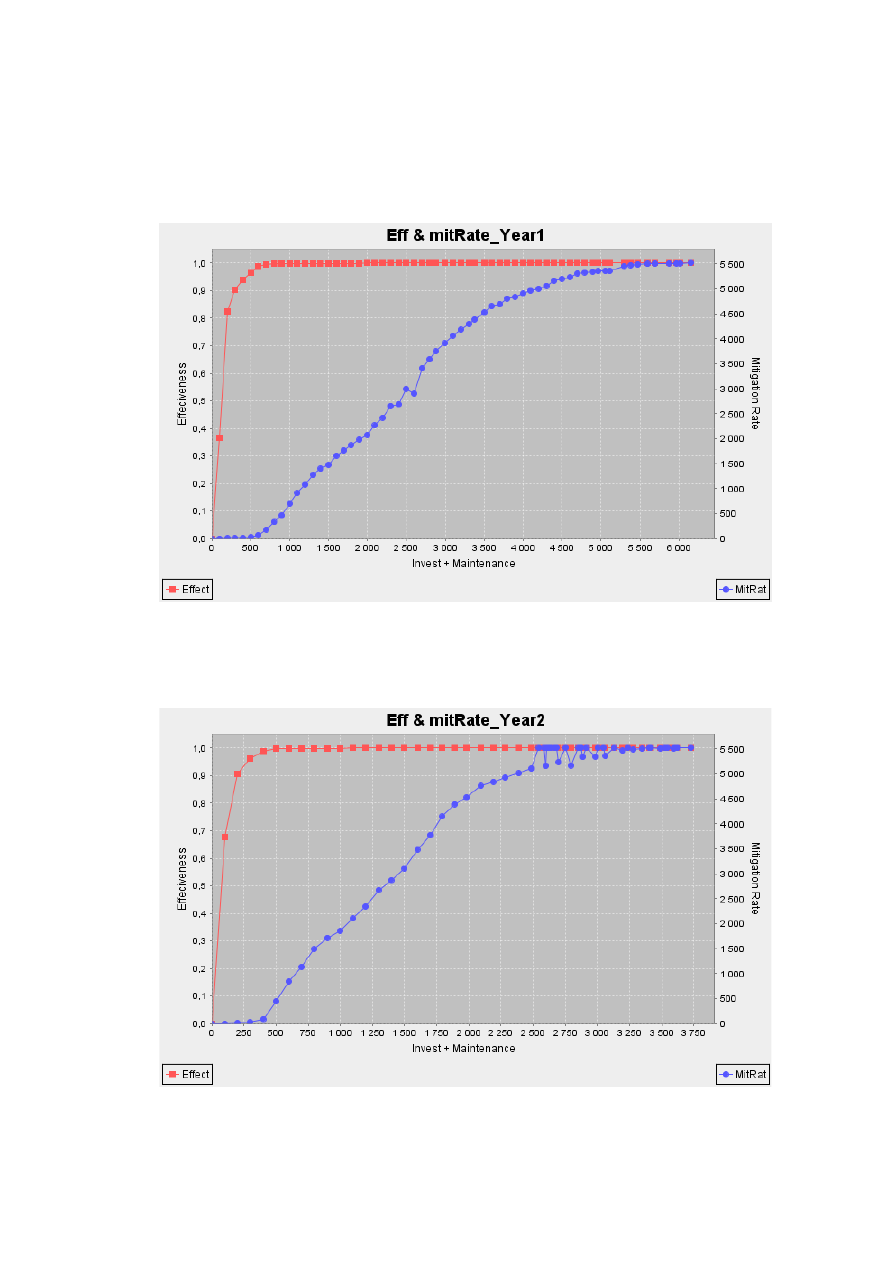
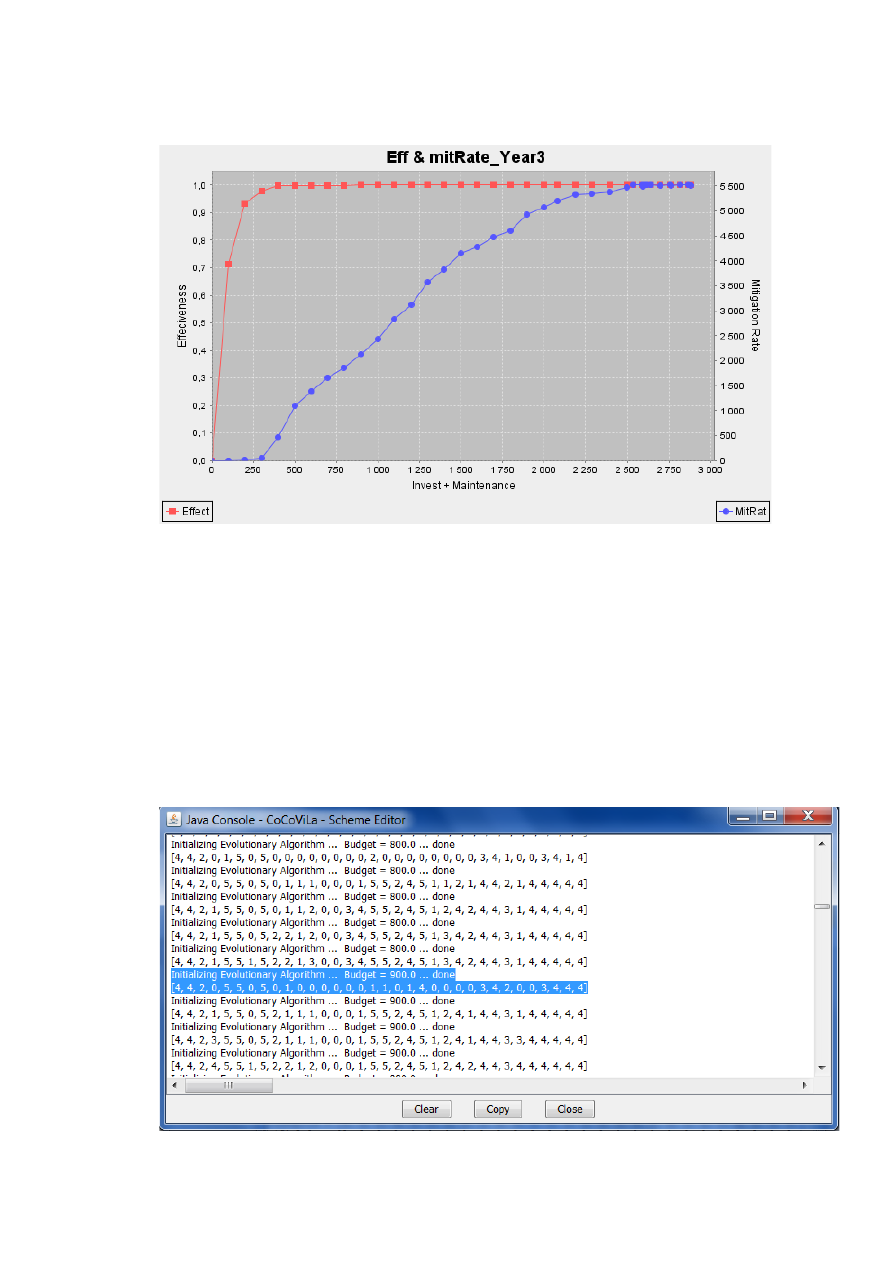
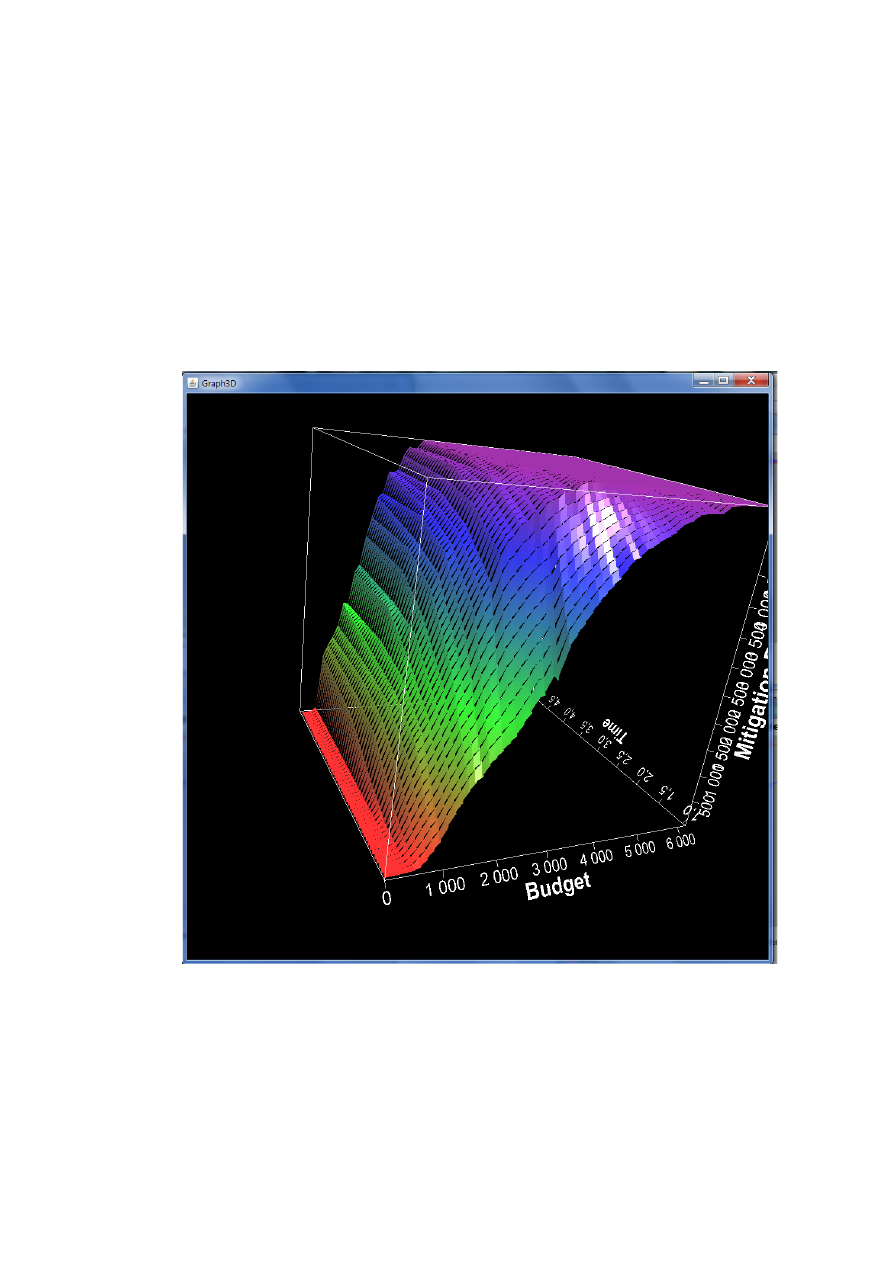
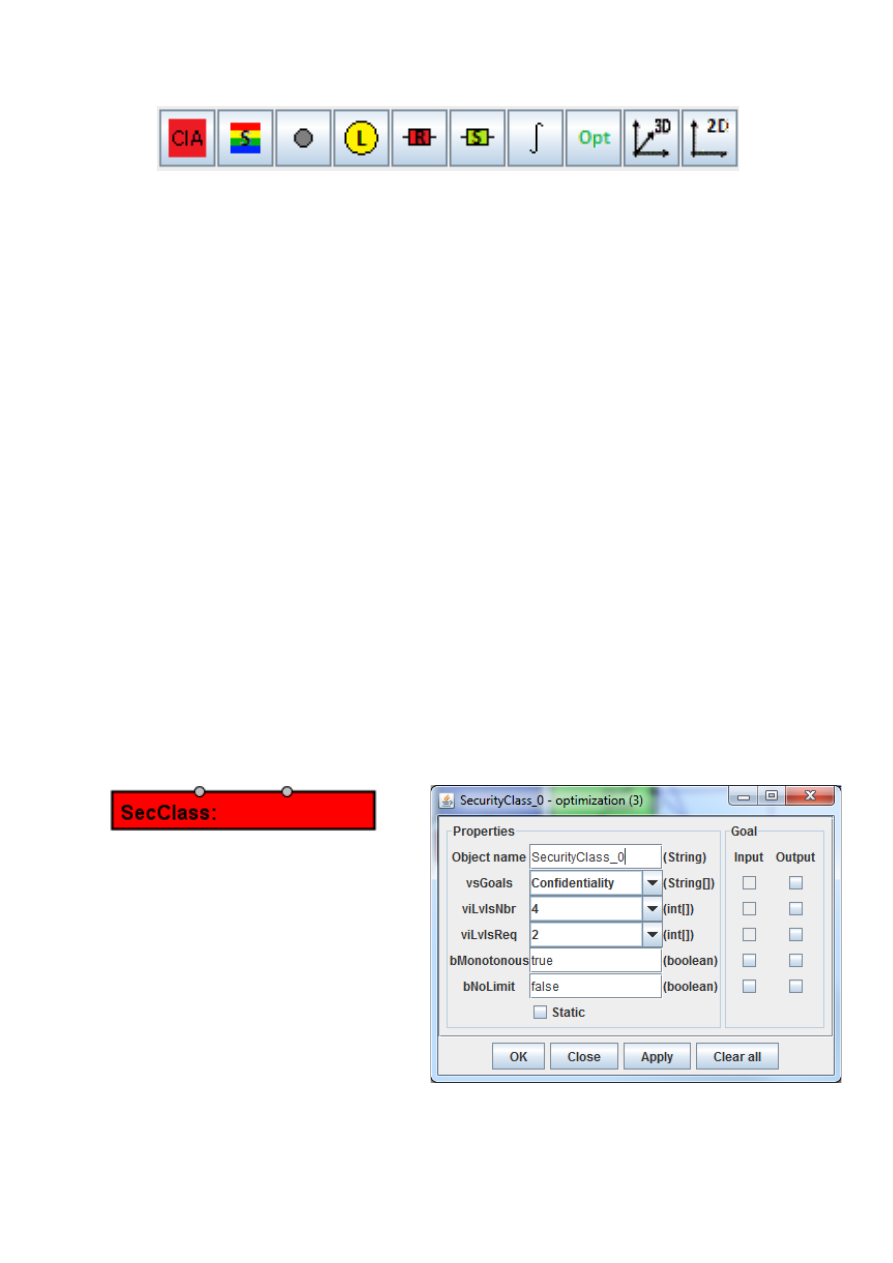
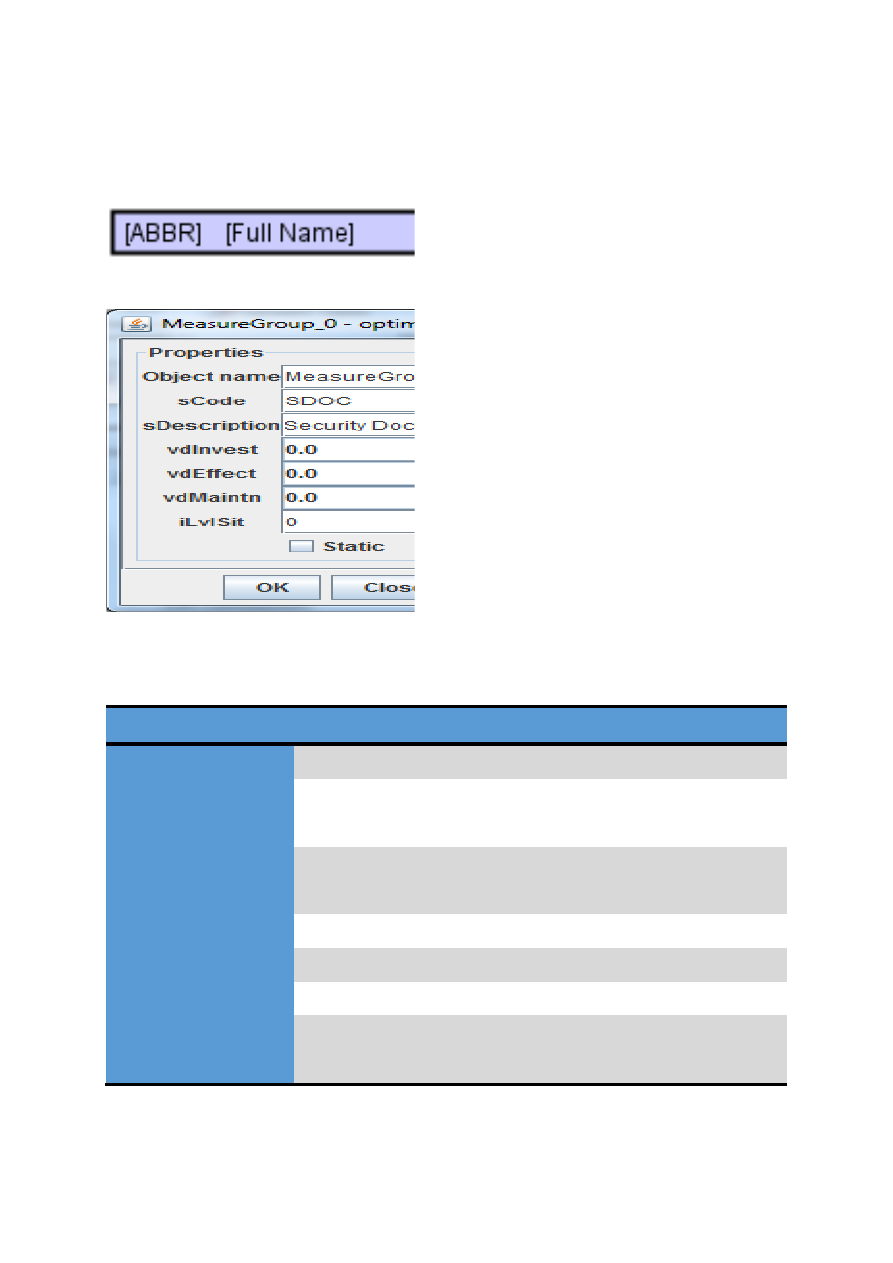
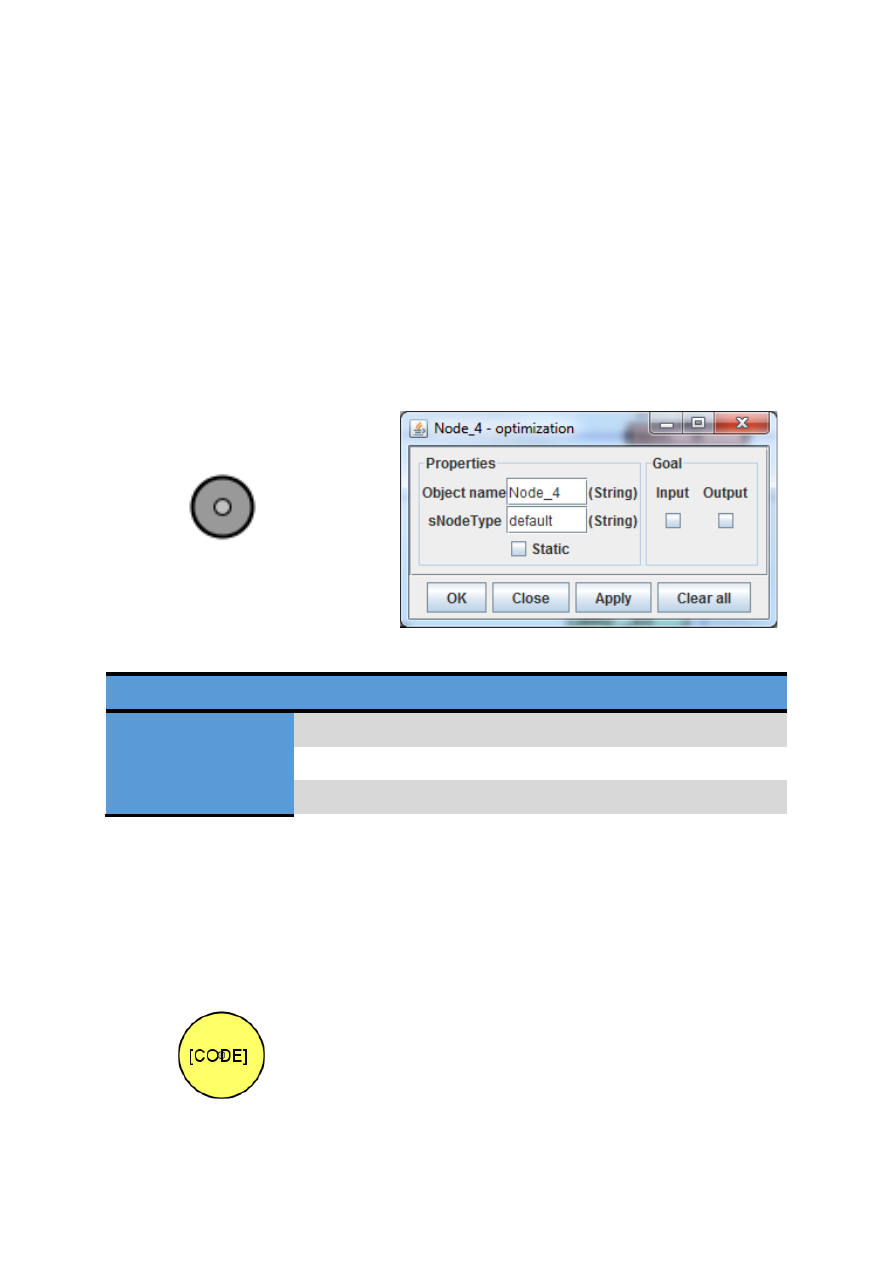
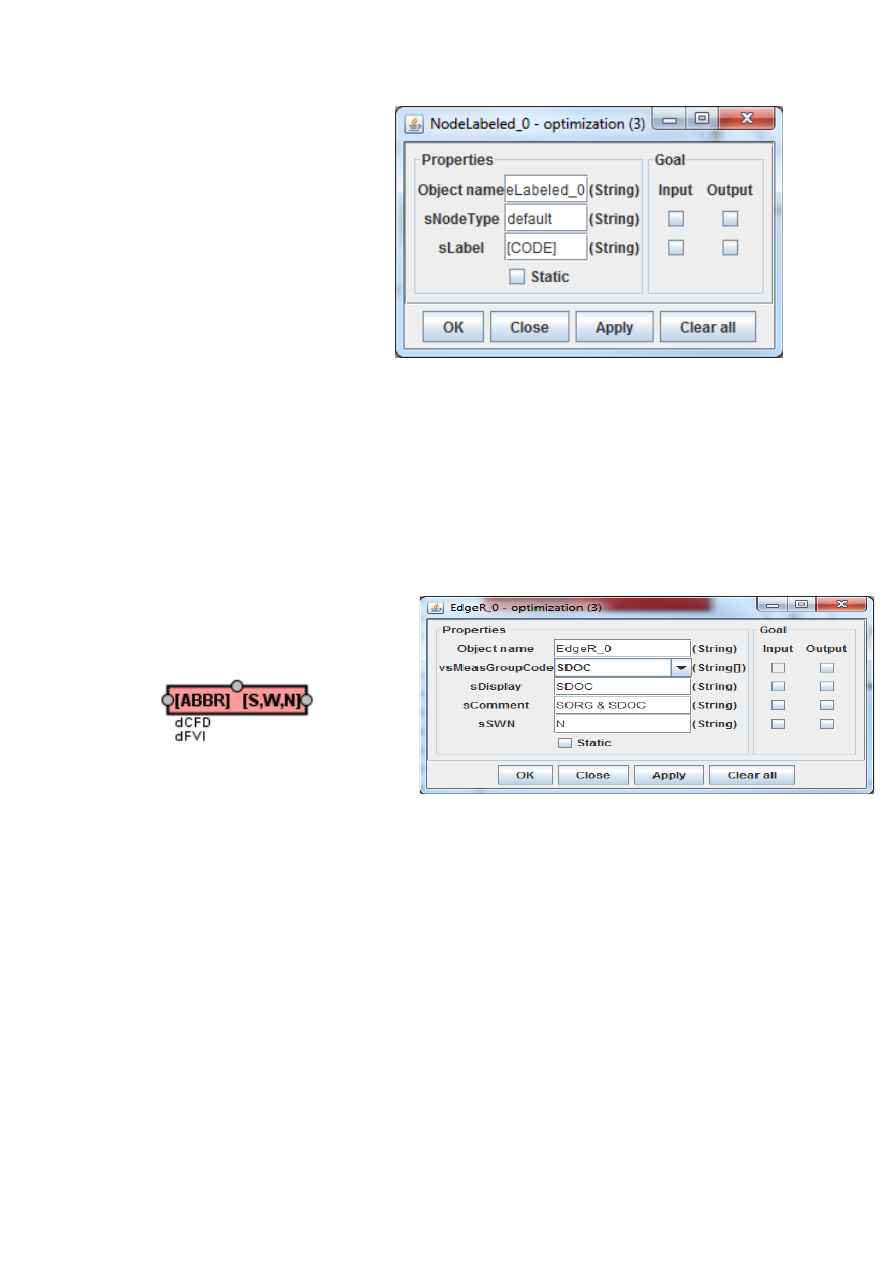
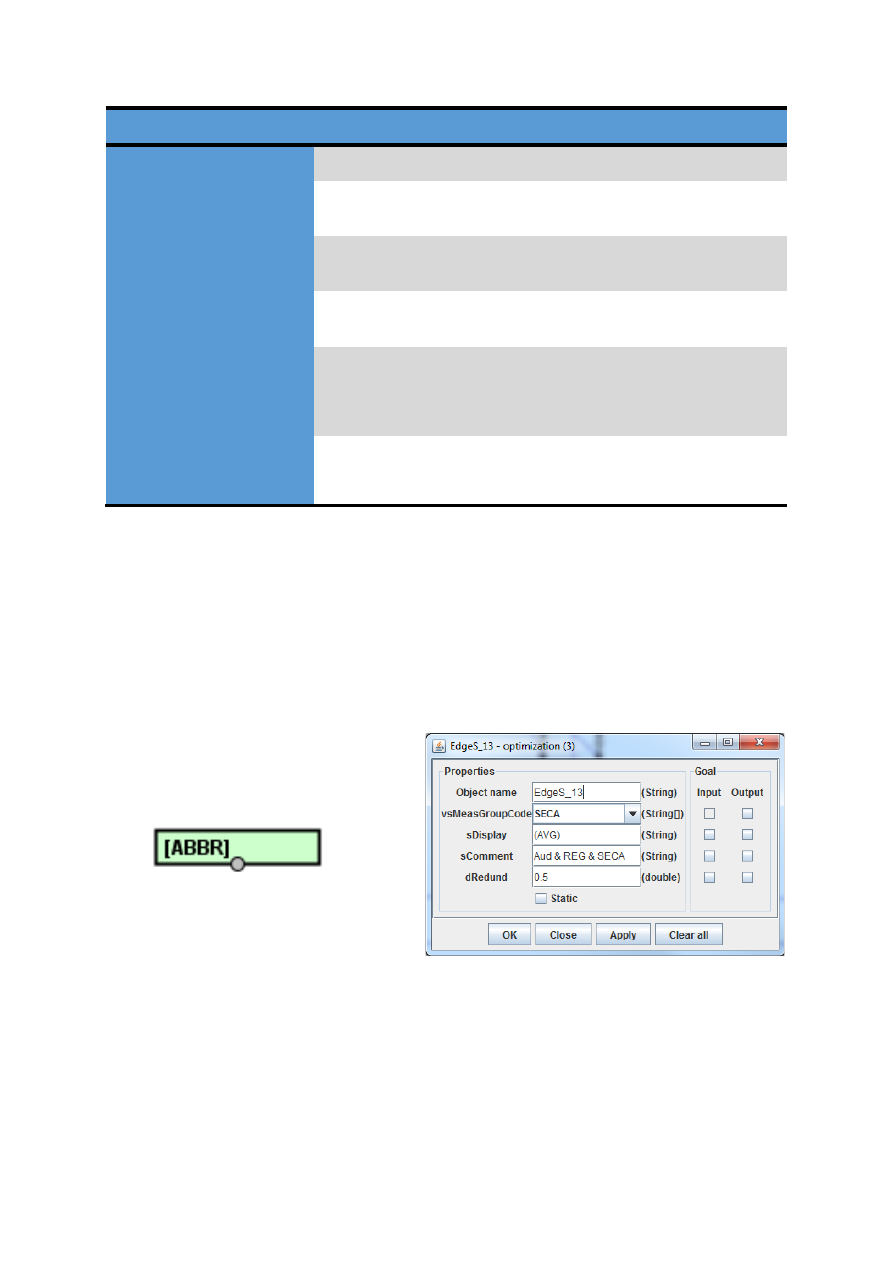
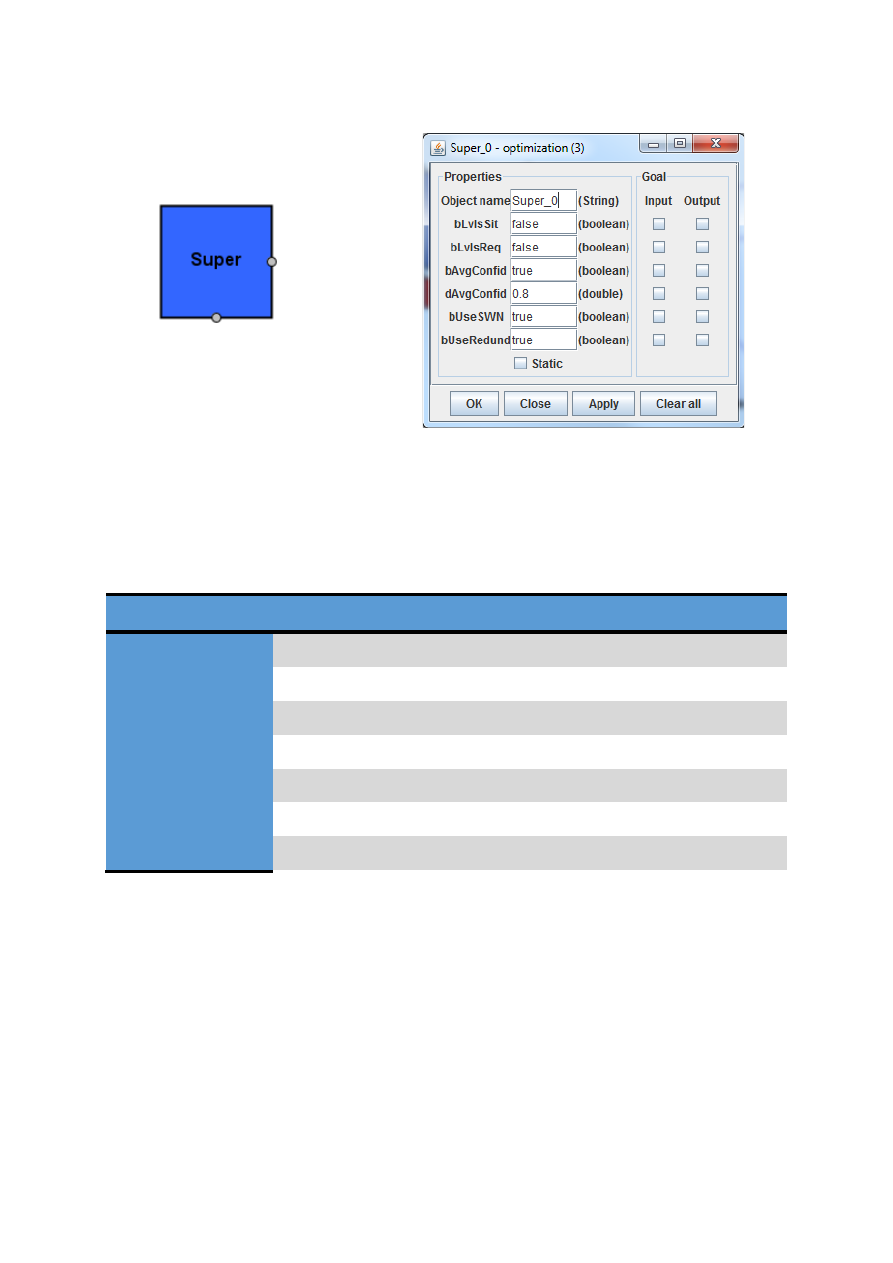
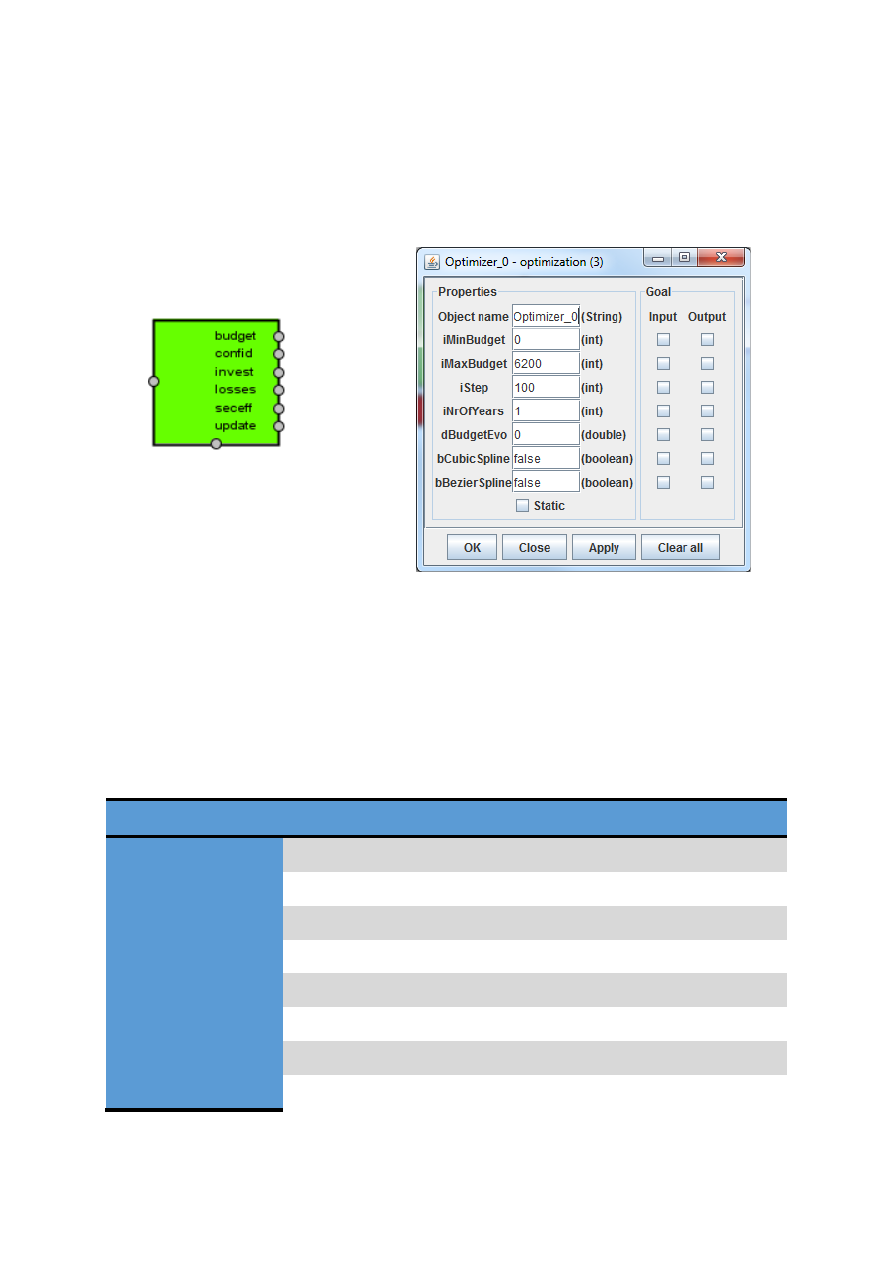
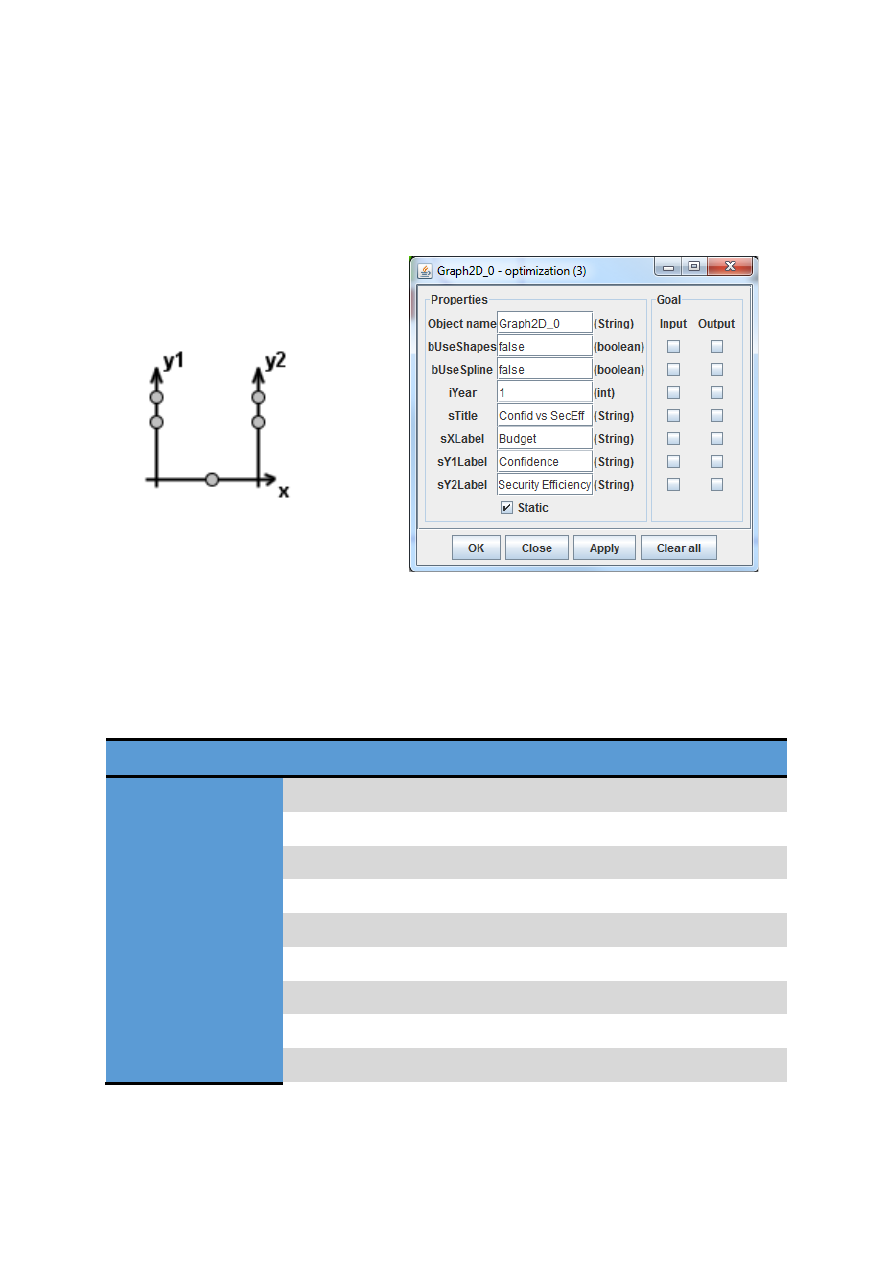
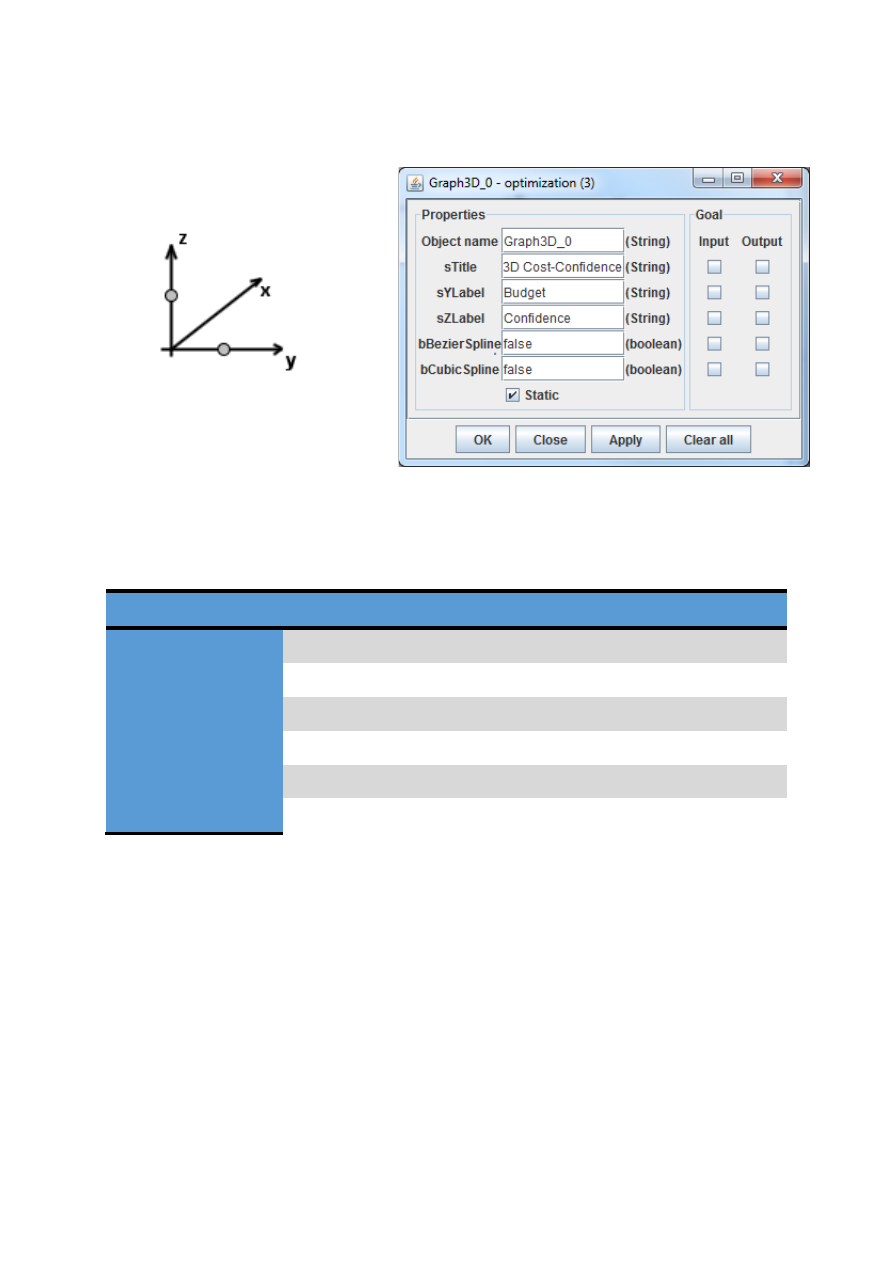
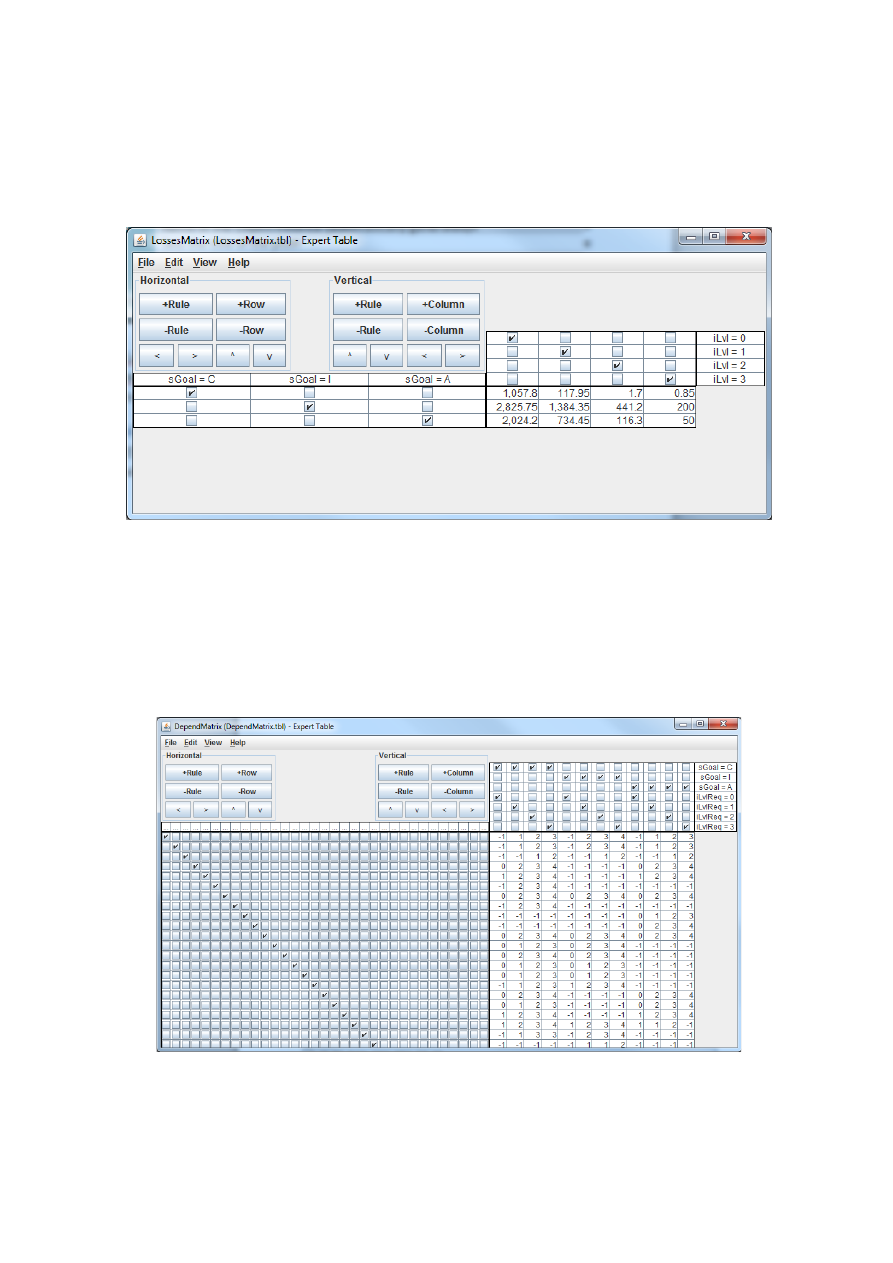
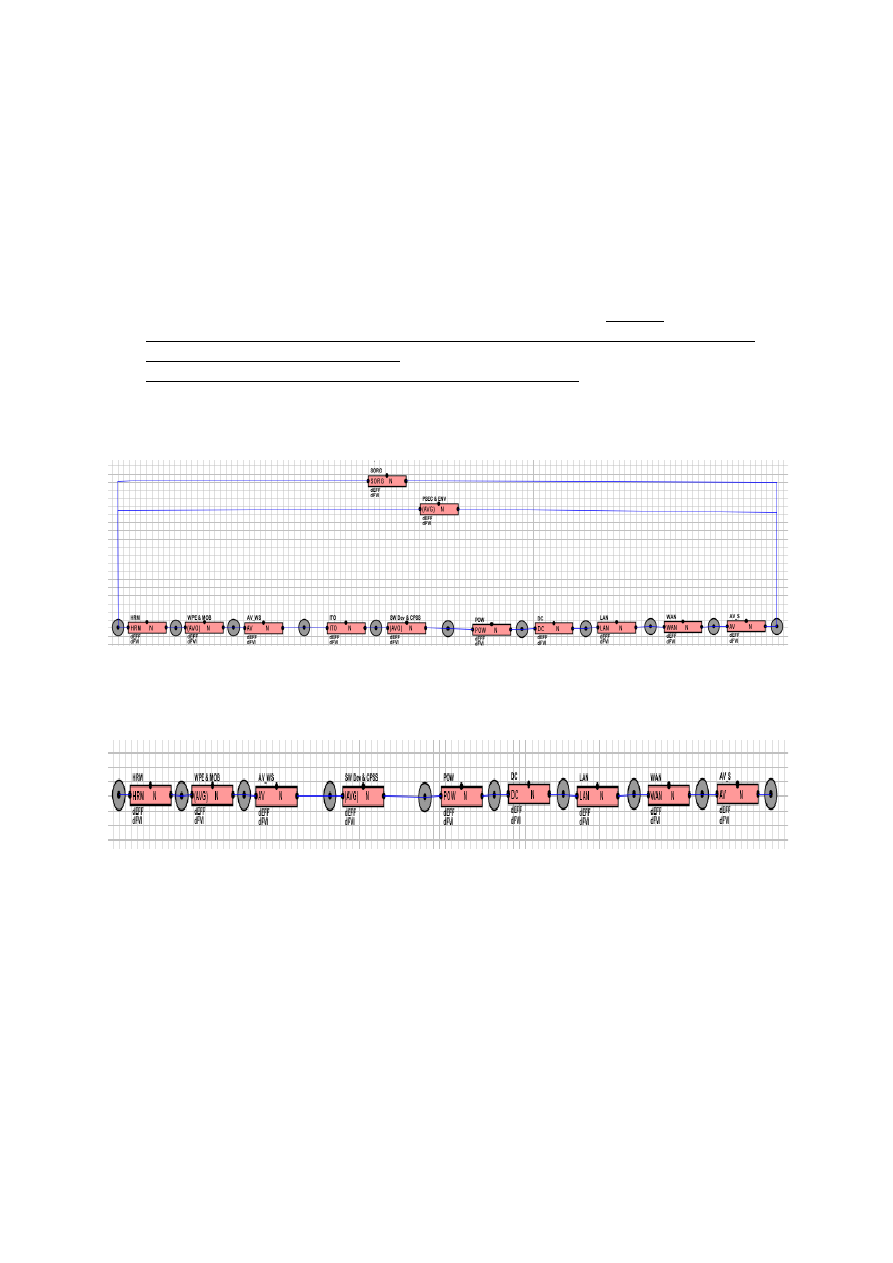


Kõik kommentaarid