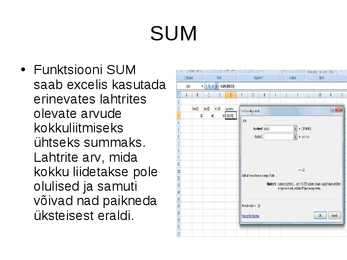
tuleb. · Vajuta Automaatsumma- nuppu standardribal. · Märgistatud lahtrisse ilmub summafunktsioon. Andmeplokile, mille summat leitakse, ilmub ümber punktiirjoon. Kontrolli, kas punktiirjoon on ümber õigete andmete, vajadusel lohista hiirega üle õigete andmete. · Vajuta Enter-klahvi. SUMIF · Liidab etteantud kriteeriumile vastavad lahtrid ning summeerib lahtrid, konkreetse andmete järgi. AVERAGE · Funktsiooni AVERAGE saab excelis kasutada erinevates lahtrites olevate arvude keskmise tulemuse leidmiseks. Lahtrite arv, mida kokku liidetakse pole olulised ja samuti võivad nad paikneda üksteisest eraldi. AVERAGE kasutamine · Märgista lahter, kuhu keskmine tuleb. · Vali Automaatsumma-nupu loendist Keskmine. · Märgistatud lahtrisse ilmub Average-funktsioon. Andmeplokile, mille keskmist leitakse, ilmub ümber punktiirjoon. Kontrolli, kas
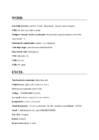
WORD Lehekülje häälestus (vasakult 3,5cm) : Page layout- margins-custom margins.. CTRL+A- teeb kogu teksti siniseks Üleliigsete tühjade ridade eemaldamine: Replace-more-special-paragraph mark-Otsi: ^p^p Asenda: ^p Nurksulgude eemaldamine: replace- [any character] Viide lõigu lõppu: year accessed-millal külastasid. Sõna tähtede vahe: font-spacing CTRL+D-dubleerib CTRL+c-copy CTRL+V paste EXCEL Tabeli andmete muutmine: Select data-edit Countif-(kogus palju mida on)-nt mehi kokku Mode-kõige sagedamini esinev hinne Ceiling-...=CEILING(B4*1,2;0,05) Averageif-keskmine (sugu,kriteerium, tunnus) IF-logical test (C1=D1) True,False Teksti ühendamine: =A1&" on sündinud "&C1&". Aastal ja ta on tähtkujult "&F1&" Sumif- nt hind kriteeriumite järgi (NIMI;KRIT,HIND) Suur täht =proper() Esitäht =left(A1) Format cels-custom- #" sorti"
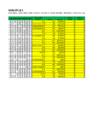
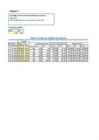
HARJUTUS 5 AVERAGE, SUM, MAX, MIN, COUNT, COUNTA, COUNTBLANK, PRODUCT, ROMAN, SQRT, ROUND, TOD Aritmeetiline Suurim Väiksem Lihtsamad funktsioonid keskmine Summa Korrutis number number 5 5 5 5 2 5 5 4 2 3 4.1 41 750000 5 2 5 3 5 4 2 3 4 4 4 3.777777778 34 115200 5 2 5 5 5 5 5 5 2 5 5 4.666666667 42 781250 5 2 5 5 5 4 4 5 4 4 4 4.444444444 40 640000 5 4 5 4 3 5 4 5 4 3 4 4 4.1 41 1152000 5 3 5 4 5 1 1 5 5 5 4 4 3.9 39 200000 5 1 5 5 5 5 5 5 4 2 ...
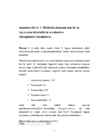
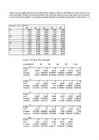
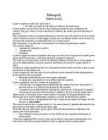
Iseseisev töö nr 1. Mõõtmistulemuste asendi- ja hajuvuskarakteristikute arvutamine. Histogrammi koostamine. Ülesanne 1. Arvutada ühele suunale tehtud 50 lugemi sekundiosade põhjal mõõtmistulemuste asendi- ja hajuvuskarakteristikud. Koosta mõõtmistulemuste kohta histogramm. Vastavalt tööjuhendile koostame ette antud andmetest variatsioonirea kasutades selleks Excel’is olevat Sort funktsiooni. Järgnevalt leiame valimi aritmeetilise keskmise Average käsuga. Lisaks tuleb leida valimi mood, mediaan, dispersioon ja standardhälve kasutades selleks Excel’i funktsioone. Järgnevalt antud valimile vastavad mainitud suurused: 1. Aritmeetiline keskmine- 37,8 2. Valimi mood- 32,1 3. Valimi mediaan- 37,9 4. Valimi dispersioon- 9,7 5. Valimi standardhälve- 3,1 Lisaks tuleb leida valimile vastavad asendi-ja
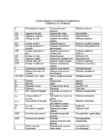
СОКРАЩЕНИЯ И СИМВОЛЫ В ЭКОНОМИКЕ LÜHENDID JA SÜMBOLID A Technological progress Технологический Tehniline progress прогресс AD Aggregate demand Совокупный спрос Kogunõudlus AE Aggregate expenses Совокупные затраты Kogukulutused AFC Average fix cost Средние постоянные Keskmine püsikulu затраты AP Average product Средний продукт Keskmine produkt, toodang APC Average propensity to Средняя склонность к Keskmine tarbimiskalduvus consume потреблению
Kogukulu on firma püsi- ja muutuvkulude summa antud tootmistasemel. TC=FC+VC VC(variable cost, muutuvkulud) on kulud, mille suurus muutub, kui firma tootmismaht muutub. FC(fixed cost, püsikulud) on kulud, mille suurus lühiperioodil ei muutu, sest ka püsiressursside suuurus ei muutu, kui firma muudab oma tootmismahtu. TR(total revenue, kogutulu) on tulu, mida firma saab oma toodangu müügist. Võrdub müügikoguse ja ühiku hinna korrutisega. TR=p*TP AP (average product, keskmine produkt) - on koguprodukti hulk muutuvressursi ühiku kohta. Keskmine produkt on koguprodukti ja selle toomiseks kasutatud ressursihulka jagatis. APL=TP/L või APK=TP/K ATC (average total cost, keskmine kogukulu või ühikukulu) on kogukulude ja toodetud koguse jagatis. ATC=TC/TP AVC (average variable cost, keskmine muutuvkulu) on muutuvkulude ja toodetud koguse jagatis. AVC=VC/TP AFC (average fixed cost, keskmine püsikulu) on püsikulude ja toodetud koguse jagatis.
3 080,30 6 324,80 Kauba nimetus Tüüp Mudel Hind Arv Maksumus Monitor 17" Viewsonic E7039,90 25 997,50 Monitor 17" Viewsonic E7149,90 20 998,00 Monitor 19" Viewsonic E9559,90 10 599,00 Monitor 19" Samsung 900IFT 65,00 10 650,00 Monitor Average 53,68 Printer Tindi Epson Stilus C20SX 29,90 20 598,00 Printer Tindi Epson Stilus C40UX 29,90 12 358,80 Printer Tindi HP DJ-930S 35,00 10 350,00 Printer Laser Epson EPL-5800L 69,90 8 559,20 Printer Tindi HP DJ-959S 35,00 8 280,00 Printer Laser HP LJ-1200 75,00 5 375,00
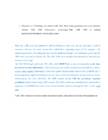
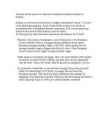
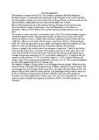
consensus between the main commercial stakeholders regarding many of the changes, with shipowning interests also taking the view that the proposed changes were premature, given that the 1994 rules were only a decade old. The 2004 YARs were therefore incorporated in relatively few contracts of carriage. The YAR 2016 largely reflect the YAR 1994, which BIMCO has to date recommended as the basis for general average adjustments, while containing some useful clarifications and additions such as on low value cargoes. Importantly, it has been agreed that an annual interest rate of LIBOR plus 4 percentage points applies according to the new rules, while the commission of 2 per cent on owners' disbursements has been abolished. The 1994 version of the YAR has previously remained prominent despite a more recent 2004 revision. The 2004 version was considered less favourable to
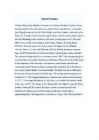
About Estonia Estonia, officially the Republic of Estonia is a country in Northern Europe. Estonia has land borders to the south with Latvia and to the east with Russia. It is separated from Finland in the north by the Gulf of Finland and from Sweden in the west by the Baltic Sea. Average elevation reaches only 50 meters and the country's highest peak is the Suur Munamägi in the southeast at 318 meters.Estonia boasts over 1,400 lakes. Most are very small, with the largest, Lake Peipus, (Peipsi in Estonian) being 3555 km². There are many rivers in the country. The largest are the Võhandu (162 km), Pärnu (144 km), and Põltsamaa (135 km). Estonia also boasts numerous bogs, and 3794 kilometers of coastline marked by numerous bays, straits, and inlets.
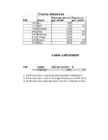
Clients database Average income Payments PIN Name per month per month 1311 Bill 800 0 1675 John 900 300 7455 Silvester 1500 0 9831 Mary 1200 700 4478 Matthias 2300 450 8732 Timothy 1900 0 9303 Daniel 2200 400 5761 Elias 3000 1000
given species or group of species can be killed There are seasonal bag limits in Estonia Open and closed hunting season. Big game 1. Brown Bear Ursus arctos 2. Wolf Canis lupus 3. Lynx Lynx lynx 4. Wild boar Sus scrofa 5. Moose Alces alces 6. Roe deer Capreolus capreolus Brown Bear (Ursus arctos) Hunting season 01.08-31.10 Biggest predator in Klõpsake juhtslaidi teksti laadide redigee Estonian forest. Teine tase Average weight 200kg Kolmas tase Neljas tase Record 370kg Viies tase Life-span 30 years Multiplicity - 700 Last hunting season 55 bear were caught. Moose (Alces alces) Hunting season 15.09-15.12 Biggest animal in our forests Klõpsake juhtslaidi teksti laadide redigeer Average weight 300-500 kg Teine tase (max 600kg) Kolmas tase Life-span 20 years. Neljas tase
8,00 6,95 8,50 8,65 8,62 Anova: Two-Factor With Replication SUMMARYB1 B2 B3 B4 B5 Total A1 Count 3 3 3 3 3 15 Sum 21,93 22,69 19,22 21,58 25,01 110,43 Average 7,31 7,563333 6,406667 7,193333 8,336667 7,362 Variance 0,0873 0,081633 0,032133 0,076133 0,176033 0,479246 A2 Count 3 3 3 3 3 15 Sum 20,3 18,85 22,41 19,46 25,25 106,27 Average 6,766667 6,283333 7,47 6,486667 8,416667 7,084667
Estonia is well known because for it's highly developed IT-sector. IT-sector is the fastest growing area. In the words of stat.ee about two-thirds of households have a broadband Internet connection. Due to more people go online to vote and do their business with the banks. As time goes by, more and more discoveries are made in the IT field. However, the income of estonians is one of the lowest in the European Union, therefore there is a big gap between different social layers. Estonians average monthly wage is 792 EUR, which means that the average monthly wage is bigger only than in Latvia. Other European Union countries have higher average monthly wages. Small salary is accompanie by aging. That is because families with smaller income do not want to have children, because they can not adequately care for them. That is the reason why the growth of population is so low. In conclusion I would like to say that even though Estonia has put much
46 Steve Ballmer 54 3 Warren Buffett 80 63,29032 63,59574 ekokkuvõtted, iga üks eraldi lehele: ine netovara väärtus; ärtus; _id=525125&in_page_id=2 Netovara (mlrd $) Riik 30 Brazil 13,3 Brazil 11,4 Brazil 18,2333 Brazil Average 23 Canda 23 Canda Average 10,4 Chile 10,5 Chile 19,2 Chile 13,3667 Chile Average 9,4 China 9,4 China Average 10,5 Colombia
drive them out of the industry. Further the size of the industry relative to the minimum efficient scale may limit the number of firms that can effectively compete within the industry. · If for example the industry is large enough to support one firm of minimum efficient scale then other firms entering the industry will operate at a size that is less than MES meaning that these firms cannot produce at an average cost that is competitive with the dominant industry Capital requirements: Production processes require large investments of capital, or large research and development costs or substantial sunk costs limit the number of firms in an industry. Large fixed costs also make it difficult for a small firm to enter an industry and expand. Technological Superiority: A monopoly may be better able to acquire, integrate
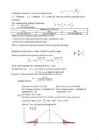
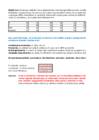
1) Üldkogumi keskmise µ hinnang on valimkeskmine: x tulu = 3 385,23 x kulu = 2 894,88 x palk = 5 937,23 , keskmiste saamiseks kasutatud valemit AVERAGE. 95% usaldusvahemik üldkogumi keskmisele: kus: n valimi maht valimstandardhälve Usaldusnivoo 0,95 puhul Tulu Kulu Palk (1842,85, 4927,61) (1700,49, 4089,27) (2877,88, 8996,58) Näiteks tulu puhul kasutatud valemit (AVERAGE(E2:E36) 1,96*(STDEV(E2:E36)/SQRT(COUNT(E2:E36)) , AVERAGE(E2:E36) +
- rent represents the cost of land - "normal profit [ P ]" represents the cost of entrepreneurial activity Normal profit includes risk Economic Costs Production and Costs COST CURVES: - Fixed Costs (TFC) = costs that do not vary with output (present even when output, q, = 0) - Variable Costs (TVC) = costs that vary with the rate of output - Total costs (TC) = TFC + TVC - Average Variable Cost (AVC) = total variable cost/ number of units produced - Average Fixed Cost (AFC) = fixed costs/ output (units produced) - Average Total Cost (ATC) = total cost (variable and fixed) / number of units produced - Marginal Cost (MC) = the change in total cost required to produce an additional unit of output. - Explicit Cost = payments by a firm to purchase the serviced of productive resources (wages, interest, rent, capital)
A stereotype The average Estonian is a woman (54%) between age 20 and 72 years old. She lives in a private house. The house is situated in town or near it. It has 4 bedrooms, 1 or 2 bathrooms, an utility room and a kitchen. The average Estonian is married. The average Estonian works 40-45 hours a week, and has at least 1 holiday for 4 weeks every year. Most of the holidays are spent with relatives or abroad. The man In the family works in the office of a company and earns 3000kr a week. He goes to work by car and starts at 8.30 in the morning. He likes his job and hopes to get promotion. Women work in service industry and go there by car. They sometimes earn more than men and they quite like their job. The children of a typical Estonian family go
Estonian geography The territory of Estonia covers 45,227 km2. Estonia is situated in the Baltic Region of Northern Europe. It is bordered to the north by the Gulf of Finland, to the west by the Baltic Sea. Its neighbor countries are to the south Latvia, to the east Russia, to the north and over the Gulf of Finland, Finland and to the west and over the Baltic Sea, Sweden. Most of the lowland areas are in the middle of Estonia. Average elevation reaches only 50 meters and the country's highest point is the Suur Munamägi in the southeast at 318 meters. There is 3,794 kilometers of coastline marked by numerous bays, straits, and inlets. The number of islands and islets is estimated at some 1,500. Two of them are large enough to constitute separate counties: Saaremaa and Hiiumaa. A small, recent cluster of meteorite craters, the largest of which is called Kaali is found on Saaremaa, Estonia. Estonia has over 1,400 lakes
adding the last drop. Read from the burette the consumed volume of hydrochloric acid for titration with a 0.05 cm3 precision. 4. Wash the conical flask carefully with distilled water and repeat the titration with a new aliquote of water. Repeat the titration process until the consumed amounts of at least three readings of HCl volume do not differ more than 0.10...0.15 cm3. 5. Put the data obtained from titration into the table and calculate the average volume of HCl solution used (cm 3). B Determination of total hardness 1. Pipette 100 cm3 of the test water into a conical flask which has been washed with distilled water, add ~5 cm 3 of buffer solution (measure it with a 25 cm 3 measuring cylinder), add a pinch (~0,1 g) of the indicator ET-00. The color of solution will change to purple. 2. Prepare the burette with 0,025 M trilon-B solution and titrate water while constantly swirling until the color of solution changes to blue
MIINA HÄRMA GYMNASIUM Deserts Saudi-Arabia Tartu 2007 Deserts In geography, a desert is a landscape form or region that receives very little precipitation. Generally, deserts are defined as areas that receive an average annual precipitation of less than 250 mm (10 inches). Deserts cover at least one-fourth of the Earth's land surface. Desert biomes can be classified according to several characteristics. There are four major types of deserts: · Hot and dry · Semiarid · Coastal · Cold Location The four major North American deserts of hot and dry deserts are the Chihuahuan, Sonoran, Mojave and Great Basin. Others outside the U.S
the Welsh economy the tenth largest of the UK's twelve regions (counting Wales, Scotland and Northern Ireland alongside the nine English Government Office Regions) ahead of only Northern Ireland and the North East of England. The modern Welsh economy is dominated by the service sector. In 2000, services contributed 66% to GVA, the manufacturing sector contributed 32%, while agriculture, forestry and fishing contributed 1.5%. In November 2008, the average price of a house in Wales was £126,181, a fall of 11.7% since the previous year. The average house price in England and Wales as a whole was £161,883.[24] In August 2008, average house prices in Wales ranged from £109,000 in Blaenau Gwent to £238,000 in Monmouthshire. Wales economy
Oliver Niinas Special Reports TTÜ TK Northern lights 1. What changes Sweden´s brought with the quiet revolution? the country was demoted from being the world's fourth-richest in 1970 to 14th-richest in 1993, when the average Swede was poorer than the average Briton or Italian. The two decades from 1990 were a period of recovery: GDP growth between 1993 and 2010 averaged 2.7% a year and productivity 2.1% a year, compared with 1.9% and 1% respectively for the main 15 EU countries. 2. Nordic country´s has joined with the same direction, how to they differ from each other? Denmark has one of the most liberal labour markets in Europe. It also allows parents to send children to private schools at public expense
81 Jacqueline Mars 71 63,29032 63,59574 ekokkuvõtted, iga üks eraldi lehele: ärtus; 1. _id=525125&in_page_id=2 Netovara (mlrd $) Riik 30 Brazil 13,3 Brazil 11,4 Brazil 18,2333333333 Brazil Average 23 Canda 23 Canda Average 19,2 Chile 10,5 Chile 10,4 Chile 13,3666666667 Chile Average 9,4 China 9,4 China Average 10,5 Colombia 10,5 Colombia
Output of non-deterministic algorithm may be different for different runs with the same input data Mittedetermineeritud algoritmi tulemus samade lähteandmete korral võib erinevatel lahenduskordadel olla erinev. Tõene Partial algorithm terminates for any set of input data. Osaline algoritm peatub mistahes sisendandmete korral. Väär Average time complexity of binary search is O(log n). Kahendotsimise keskmine ajaline keerukus on O(log n). Tõene Worst case time complexity of merge sort is O(n). Ühildusmeetodi (merge sort) halvima juhu ajaline keerukus on O(n). Väär (it is O(n log n)) Sorting method is quick if it has average time complexity O(n lon n). Järjestamismeetod on kiire, kui selle keskmine ajaline keerukus on O(n log n). Tõene Jah, üldjuhul ei saa kiiremini Last element added to the stack is removed first.
body is called the Abdomen. SpidersGettingBigger-GlobaW l armingtoBlame? A group of Danish scientists wondered whether global warming would make the hairy, meat-eating wolf spiders of northeastern Greenland bigger, since longer summers mean more hunting time. The spiders can live for at least two years, and the researchers found that, in years when spring came early, the animals grew larger, on average. For example, when spring came 30 days earlier than usual, some spiders grew exoskeletons that were 10 percent thicker than average, resulting in bigger bodies overall. http://www.youtube.com/watch?v=mA0u2J1bKAc Snakes There are around 3000 snake species in the world, and about 375 of these are venomous. Snakes can be found in all types of habitats. While some climb trees, others live underground, and still others are found in the waters of lakes and even seas.
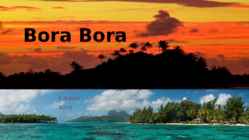
be seen from time to time. The ocean waters surrounding the island. The coral reef provides shelter to a large number of fish, sponge, and giant manta ray species. Climate data for Bora Bora Climate data for BoraBora Month Jan Feb Mar Apr May Jun Jul Aug Sep Oct Nov Dec Year Average high °C 30.2 30.8 30.5 30.3 29.5 28.6 28.1 28.1 28.6 29.1 29.4 29.6 29.3 (°F) Average low °C 25.1 25.3 25.5 25.5 25.1 24.2 23.8 23.8 24.0 24.3 24.6 24.8 24.7 (°F) Average rainfall 268.7 233.2 176.9 182.7 129.8 98.2 83.3 59.7 65.5 99.8 203.7 280.6 1,882.1 mm (10.579) (9.181) (6
The Greenhouse Effect: Scientists are sure about the greenhouse effect. They know that greenhouse gases make the Earth warmer by trapping energy in the atmosphere. Climate Change: Climate is the long-term average of a region's weather events lumped together. For example, it's possible that a winter day in Buffalo, New York, could be sunny and mild, but the average weather the climate tells us that Buffalo's winters will mainly be cold and include snow and rain. Climate change represents a change in these long-term weather patterns. They can become warmer or colder. Annual amounts of rainfall or snowfall can increase or decrease. Global Warming: Global warming refers to an average increase in the Earth's temperature, which in turn causes changes in climate. A warmer Earth may lead to
There are beautiful nature parks in West-Estonia. The inland is mainly agricultural. Estonia is known for its 1000 lakes and beautiful nature. One of the most interesting sight is Jägala Waterfall. Lake Peipus separates Estonia from Russia. The largest river basing is round the Pärnu eastern. In Estonia there are huge forest areas and wood is an important export article. Unfortunately Estonia is not rich on other natural resources. STATISTICS The average Estonian is a woman (54%) between age 20 and 72 years old. She lives in a private house. The house is situated in town or near it. It has 4 bedrooms, 1 or 2 bathrooms, an utility room and a kitchen. The average Estonian is married. The average Estonian works 40-45 hours a week, and has at least 1 holiday for 4 weeks every year. Most of the holidays are spent with relatives or abroad. The man In the family works in the office of a company and earns 3000kr a week
In my opinion "Educating Rita" was a pretty good movie and I enjoyed watching it. I think that "Educating Rita" is an educational film. In my opinion the principle of the film, is to say that learning and knowing literature can be useful, you will get smarter and more educated. The movie also says that literature is really not as uninteresting as it seems and it can be quite gripping. At the beginning of the film Rita didn't knew about literature, she knew much less than average person, but at the end, she was so fond of literature and she knew much more than average person and she was more educated than ever. Literature isn't as boring as it seems and it helps moving toward in life. "Educating Rita" was a good movie and I learned that literature has an important role in life.
Nunavut Tom Kaldre Nunavut is the newest and largest territory in Canada. The capital of Nunavut is Iqaluit. The fifth largest country subdivision in the world. Nunavut's license plates are shaped like polar bears. Iqaluit Muutke teksti laade Teine tase Kolmas tase Neljas tase Viies tase Nunavut is both most least populous and the largest area in Canada. It has population only about 31,906 and it has the lowest average annual temperature in Canada. In january there's an average temperatur about 30 degrees. Muutke teksti laade Teine tase Kolmas tase Neljas tase Viies tase Muutke teksti laade Teine tase Kolmas tase Neljas tase Viies tase
52 51 50 50 58 59 58 53 59 53 54 56 ogendite keskmised okka pikkused erinevad? gendite okka pikkuste keskväärtused ühesugused. ral on okka pikkuse keskväärtus teistest erinev. ata Analysis, Avova: Single Factor. Anova: Single Factor SUMMARY Groups Count Sum Average Variance iline väärtus, siis N 10 618 61.8 7.5111111111 e korral on vähema P 10 509 50.9 2.9888888889 NPK 10 560 56 4 Kontroll 10 569 56.9 10.7666666667 ANOVA =3,4968*10^-10
Standardhälve 22.61 17.78 Korrelatsioonikordaja Vastus: Korrelatsioon on positiivne ning tugev Füüsika tulemused on paremad kui matemaatika tulemused e tulemused. Leia korrelatsioonikordaja ( xi x)( yi y ) xy 3.4242 -0.0348 0.0647 1. Leidke keskväärtused ja paigutage hinnete alla [=AVERAGE 0.5375 2. Leidke standard hälve ja paigutage keskväärtuste alla [=ST 0.1269 3. Arvutage hinnetest parempoolsed lahtrid 1.5454 4. Kontrolliks leidke tabeli alla funktsioon [=CORREL] 0.8362 5. Leidke korrelatsiooniväli 0.1394 2.2297 0.1269
Range("c13") = m: Range("c14") = n: Range("c15") = r: Range("c16") = v ’ 4 käsku on ühte ritta pandud : märgiga. M tuleb lahtrisse C13 jne. If m > n Then ’ Kas ridu on rohkem kui veerge? Set myrange = Range(Cells(r, v), Cells(r + m - 1, v)) ’ lahtertüüpi muutuja, määratakse bloki suurust myrange.Interior.Color = vbRed ’ määratud lahtrid värvitakse punaseks myrange.Offset(myrange.Rows.Count).Rows(1).Select ’ 4 nihutatakse, 1 rida edasi ActiveCell.Formula = "=average(" & myrange.Columns(1).Address(False, False) & ")" Else Set myrange = Range(Cells(r, v), Cells(r, v + n - 1)) ’ myrange on veerg myrange.Interior.Color = vbBlue ’ värvitakse siniseks myrange.Offset(0, myrange.Columns.Count).Columns(v - 1).Select ActiveCell.Formula = "=average(" & myrange.Rows(1).Address(False, False) & ")" End If ’lõppeb IF funktsioon End Sub ’lõppeb programm
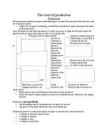
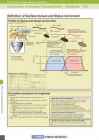
Surface TextureContour Measuring Instruments Explanation of Surface CharacteristicsStandards Basic surface texture parameters and curves Amplitude parameters (peak and valley) Amplitude average parameters Rp Rt Ra Pp Maximum profile peak height Pt Total height of profile Pa Arithmetical mean deviation
So you get the same education from any of the state schoole. Firstly, I'd like to say that the main problem is that the curriculum is too rigid. Although this gives all the students a fair change of getting a good and even better education, it doesn't take into consideration that some children just can't cope with all that knowledge. This makes the students restless and that leads to bad behaviour. Secondly, we can say that the education you get in Estonia is above average, cause Estonia is a highly developed country. This is mainly because of the National Curriculum that makes all schools give a good average education. A good thing about the state schools is that they are usually quite near to where u live. The teachers are well qualified. This makes the education even better. In conclusion i'd like to say that the state education has its pros and cons but the pros outnumber the cons.
Quebec has a large French speaking majority. There are substantial minorities who speak other European languages, such as German, Scandinavian and Polish. Inuit and Indians in the Northwest and Yukon were the first inhabitants of Canada, the Indians crossing from Asian more than 10 000 years ago, and the Inuit which has distributed all around the Arctic circle. After the First World War, Canada was one of the principal creators of the Commonwealth. Climate Average winter and summer high temperatures across Canada vary depending on the location. Winters can be very freeze in many regions of the country, particularly in the interior and Prairie provinces which experience a continental climate, where daily average temperatures are near -15 °C (5 °F) but can drop below -40 °C (-40 °F) with severe wind chills. In non-coastal regions, snow can cover the ground almost six months of the year (more in the north)
Most people live in or near cities.The largest cities are Sydney, Melbourne, Brisbane, Perth, Adelaide. Monetary unit is australian dollar. Australians speak English. Australia is made up of six states and two territories. It is about the size of the United States (not including Alaska.) 21.3 million people live there, about as many people as in New York. Canberra is the capital of Australia. The weather in Australia is warm and pleasant. January and February are the warmest months, with average temperatures between 65° and 70° F. June and July are the coldest months, with an average July temperature of about 50° F, except in the Australian Alps, where temperatures average 35° F. The middle part of the country is called the outback. The outback does not get very much rain and is very dry. Not very many people live in the outback. In the outback, there are some sheep and cattle ranches (property.) There are about ten times more sheep than people in Australia. Sheep
1. Key features for all studied biomes. Tundra The main seasons are winter and summer. The tundra is the world's coldest and driest biomes. The average annual temperature is -28° C. Nights can last for weeks when the sun barely rises during some months in the winter, and the temperature can drop to -70° C. During the summer the sun shines almost 24 hours a day. Summer are usually warm. Average summer temperatures range from 3° to 16°C. TaigaTaiga is the Russian word for forest and is the largest biome in the world. It stretches over Eurasia and North America. The taiga is located near the top of the world, just below the tundra biome. The winters in the taiga are very cold with only snowfall. The summers are warm, rainy, and humid. Some of the animals in the taiga hibernate in the winter, some fly south if they can, while some just cooperate with the environment.
Austraalia Kelly Sule ja Kätlin Siirak 7b Location · Australian continent · 7 neighbouring countries · 0°-40°S and 100°-160°E Climate · Affect the currents · Annual temperature is 20-30 degrees · The average annual rainfall is about 100-2000 millimeters · Southern australia is very dry People · Most of people are from Europe 6% are from Asia 2,2% are natives · Most discussed english · More languages are Italian Greek Cantonese Believe · Most of people faith is christianity · Others 1% muslim 1% buddhists 0,5% jewish Education · Australia has compulsory education 11 years
THE IMPACT OF THE MEDIA ON BAD BODY IMAGE IN CHILDREN Today's children grow up in a world flooded with the mass media. Statistics reveal that, on average, a child watches up to 5 h of television per day and spends an average of 6 to 7 h viewing the various media combined. Body image issues have been on the rise rince the introduction of social media websites that hoste the idea of ,,perfect" or ,,idealized" body sizes. Over the past 20 years, several articles have proposed a link between the thin female beauty ideal and the muscular male body ideal portrayed in the media with a range of psychological symptomatology including body dissatisfaction and eating disorders. Over time the cultural
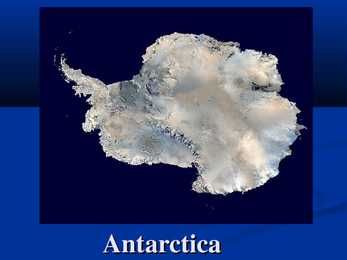
overlying the South Pole. It is situated in the southern hemisphere, almost entirely south of the Antarctic Circle, and is surrounded by the Southern Ocean. Antarctica area is 14,000,000 km² , icefree area is about 280,000 km² and icecovered is about 13,720,000 km² that means about 98% of Antarctica is covered by ice. Climate of Antarctica Antarctica is the coldest, driest and windiest continent, and has the highest average elevation of all the continents. The coldest natural temperature ever recorded on Earth was -89.2 °C at the Russian Vostok Station in Antarctica on 21 July 1983. Antarctica is also extremely dry, technically a desert, whit an average of only 166 mm of precipitation per year. Population of Antarctica The number of people conducting and supporting scientific research. The number of people varies about 1,000 humans in winter and to about 5,000 humans un the summer.
Estonia is a small country in Northern Europe with an area of about 45 000 sq km. The country's climate is determined by the proximity of the Atlantic Ocean. The summer temperatures are a little lower than the average of that latitude, but the winters are considerably warmer. As a part of the East-European Plain, the country has a rather flat surface. The highest and most topographically variagated region in Estonia is in the south-eastern part of the country. The Sakala Upland plains offer contrast to the hills of Ottepää, Karula and Haanja. At 318 metres, Suur Munamägi ('Great Egg Hill') is not only the highest point in Estonia, but of all the Baltic countries.
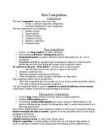
There are not enough fresh water in some parts of the world. Fossil fuels are used too much and most of its reserves will be used up by 2050. Endangered species 40 percent of all organisms are endangered All the different species are important for biodiversity Habitat loss and hunting are the most widespread cause of species endangerment . Climate change Climate change is a change in the statistical distribution of weather over periods of time. The Earth's average surface temperature has risen by 0.76° C since 1850. Most of the warming that has occurred over the last 50 years is very likely to have been caused by human activities. Weapon of mass destruction A weapon of mass destruction (WMD) is a weapon that can kill large numbers of humans and/or cause great damage to man-made structures (e.g. buildings), natural structures (e.g. mountains), or the biosphere in general. There are eight countries that have
Graphically - perfectly elastic demand for single firm - horizontal line. ONLY ONE MARKET PRICE Firm's Output The firm's choice of method and level of the costs of output is dependent on costs and revenue associated with each output alternative. · Productions are reflected in the supply side of the model. The revenue of the firm is reflected in the demand functions. Average, Total and Marginal Revenue Average Revenue (AR) schedule = demand schedule Price per unit to buyer = revenue per unit to seller average revenue=price Total Revenue (TR)= Price x Quantity (increases by constant amount constant price) TR = P x Q · Straight upward sloping line constant slope (= price) · The area formed by the rectangle with coordinates (0,0), (0,P), (0,Q), (P,Q)
Temperate deciduous forests, woodlands and shrub Tartu 2008 Location: Temperate forests are typical of all European continent, the Eastern region of Asia (in special, Chinese and Japan) and North America. Also are finded in tempered areas of South America. Climate: The average temperature in temperate forests is 50° F. Summers are mild, and average about 70° F, while winter temperatures are often well blow freezing. The average yearly precipitation is 30-60 inches. This precipitation falls throughout the year, but in the winter it falls as snow. There are four seasons in this biome, with warm summers and cold winters, often snowy. In autumn, the leaves change color and fall from the trees. The leaves decay on the forest floor, so the soil is very rich. Because of this, and because of the long growing season, many deciduous forests have been cut down for farming purposes. Plants:
hotel are men. The women occupancy seems to peak at three points: April, October and December. The latter is probably due to couples and families (influx of people aged under 20 is in December and October too) going on vacation for Christmas, New Year's Eve and other seasonal holidays. The length of the stay is the shortest in December, which may serve as further proof for the above theory of families coming in for the winter holidays. The average length of stay also tends to drop significantly as tourists gain in occupancy percentage, which may indicate that the location of the hotel is not very favourable to tourism business as the area can probably be explored quickly. The conventions seem to affect the average length of stay positively. This may be due to the fact that conventions attract a notable number of occupants that are bound to stay for the
Form 10A 2009 Introduction The climate is cyclical England is in the middle latitude The English weather changes frequently 52% of the year is overcast England is washed by the warm Gulf Stream Spring March, April, May Wild areas may still be cold and muddy Animals start emerging from their hibernation Plants start blooming Sun and showers Summer Plants and animals start breeding Warm weathers The landscapes are covered with flowers Warm rain The average temperature ranges from 10 0C 150C Britain's highest temperature recorded is 38.5°C in August 2003 Autumn Birds are returning after migrating from the north Birds start growing their winter plumage. Many flowers fade Trees reveal their autumn colours It rains more often Winter Animals start hibernating Flowers are rare Not much snow because of the Gulf Stream The average temperature ranges from 0 0C 5 0C; The lowest temperature recorded is -27.2°C in 1895 Flora
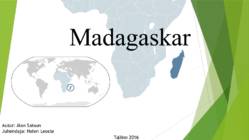
Toiduainete töötlemine ja eksport. Keskkonnaprobleemid MAA KURNATAKSE VÄLJA RAHVAARVU KASV LOODUSLIK TAIMKATE HÄVIB METSADE MAHARAIUMINE ÜLEKARJATAMINE SALAKÜTTIMINE PÕUD TULEKAHJUD Kasutatud materjalid https://et.wikipedia.org/wiki/Madagaskar#Loodus http://listverse.com/2013/10/05/10-weird-and-wonderful-creatures-from-madagascar/ https://et.wikipedia.org/wiki/Ahvileivapuu https:// weather-and-climate.com/average-monthly-Rainfall-Temperature-Sunshine,antananariv o,Madagascar https://et.wikipedia.org/wiki/Savann Apinanleipäpuu Wikipedia Climate Change Knowledge Portal 2.0 Average Temperatures in Antananarivo, Madagascar Temperature http://www.worldatlas.com/webimage/countrys/africa/madagascar/mgland.htm#page Tänan lugemast!
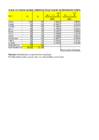
Kasutage funktsiooni IF. Valemid sisestage sinistesse lahtritesse, teistesse kopeerige. Vajadusel kasutage abilahtreid. Joonistage diagramm (tüüp Bar, stiil Style 26) Tehke diagrammis järgmised muudatused: lisage pealkiri; määrake väärtuste telje sammuks 100; + Above / - Below Company Sales ($bil) Sales/Max. Sales (%) Average Sales BP 239,27 59% + Chevron 159,29 39% - ExxonMobil 275,56 68% + General Electric 156,78 38% - PetroChina 157,22 39% - Royal Dutch Shell 278,19 68% +