wood properties (0)
Wood Handbook--Chapter 4--Mechanical Properties of Wood
4–1
Chapter
4
Mechanical Properties of Wood
David W. Green, Jerrold E. Winandy, and David E. Kretschmann
Contents
Orthotropic Nature of Wood 4–1
Elastic Properties 4–2
Modulus of Elasticity 4–2
Poisson’s Ratio 4–2
Modulus of Rigidity 4–3
Strength Properties 4–3
Common Properties 4–3
Less Common Properties 4–24
Vibration Properties 4–25
Speed of Sound 4–25
Internal Friction 4–26
Mechanical Properties of Clear Straight-Grained Wood 4–26
Natural Characteristics Affecting Mechanical Properties 4–27
Specific Gravity 4–27
Knots 4–27
Slope of Grain 4–28
Annual Ring Orientation 4–30
Reaction Wood 4–31
Juvenile Wood 4–32
Compression Failures 4–33
Pitch Pockets 4–33
Bird Peck 4–33
Extractives 4–33
Properties of Timber From Dead Trees 4–33
Effects of Manufacturing and Service Environments 4–34
Moisture Content 4–34
Temperature 4–35
Time Under Load 4–37
Aging 4–41
Exposure to Chemicals 4–41
Chemical Treatment 4–41
Nuclear Radiation 4–43
Mold and Stain Fungi 4–43
Decay 4–43
Insect Damage 4–43
References 4–44
he mechanical properties presented in this chapter
were obtained from tests of small pieces of wood
termed “clear” and “straight grained” because they
did not contain characteristics such as knots, cross grain,
checks, and splits. These test pieces did have anatomical
characteristics such as growth rings that occurred in consis-
tent patterns within each piece. Clear wood specimens are
usually considered “homogeneous” in wood mechanics.
Many of the mechanical properties of wood tabulated in this
chapter were derived from extensive sampling and analysis
procedures. These properties are represented as the average
mechanical properties of the species. Some properties, such
as tension parallel to the grain, and all properties for some
imported species are based on a more limited number of
specimens that were not subjected to the same sampling and
analysis procedures. The appropriateness of these latter prop-
erties to represent the average properties of a species is uncer-
tain; nevertheless, the properties represent the best informa-
tion available.
Variability, or variation in properties, is common to all
materials. Because wood is a natural material and the tree is
subject to many constantly changing influences (such as
moisture, soil conditions, and growing space), wood proper-
ties vary considerably, even in clear material. This chapter
provides information, where possible, on the nature and
magnitude of variability in properties.
This chapter also includes a discussion of the effect of growth
features, such as knots and slope of grain, on clear wood
properties. The effects of manufacturing and service environ-
ments on mechanical properties are discussed, and their
effects on clear wood and material containing growth features
are compared. Chapter 6 discusses how these research results
have been implemented in engineering standards.
Orthotropic Nature of Wood
Wood may be described as an orthotropic material; that is, it
has unique and independent mechanical properties in the
directions of three mutually perpendicular axes: longitudinal,
radial, and tangential. The longitudinal axis L is parallel to
the fiber (grain); the radial axis R is normal to the growth
rings (perpendicular to the grain in the radial direction); and
4–2
the tangential axis T is perpendicular to the grain but tangent
to the growth rings. These axes are shown in Figure 4–1.
Elastic Properties
Twelve constants (nine are independent) are needed to de-
scribe the elastic behavior of wood: three moduli of elasticity
E, three moduli of rigidity G, and six Poisson’s ratios µ.
The moduli of elasticity and Poisson’s ratios are related by
expressions of the form
µ
µ
ij
i
ji
j
E
E
i j i, j L,R,T
=
≠
=
,
(4–1)
General relations between stress and strain for a homogene-
ous orthotropic material can be found in texts on anisotropic
elasticity.
Modulus of Elasticity
Elasticity implies that deformations produced by low stress
are completely recoverable after loads are removed. When
loaded to higher stress levels, plastic deformation or failure
occurs. The three moduli of elasticity, which are denoted by
EL, ER, and ET, respectively, are the elastic moduli along the
longitudinal, radial, and tangential axes of wood. These
moduli are usually obtained from compression tests; how-
ever, data for ER and ET are not extensive. Average values of
ER and ET for samples from a few species are presented in
Table 4–1 as ratios with EL; the Poisson’s ratios are shown
in Table 4–2. The elastic ratios, as well as the elastic con-
stants themselves, vary within and between species and with
moisture content and specific gravity.
The modulus of elasticity determined from bending, EL,
rather than from an axial test, may be the only modulus of
elasticity available for a species. Average EL values obtained
from bending tests are given in Tables 4–3 to 4–5. Represen-
tative coefficients of variation of EL determined with bending
tests for clear wood are reported in Table 4–6. As tabulated,
EL includes an effect of shear deflection; EL from bending can
be increased by 10% to remove this effect approximately.
This adjusted bending EL can be used to determine ER and ET
based on the ratios in Table 4–1.
Poisson’s Ratio
When a member is loaded axially, the deformation perpen-
dicular to the direction of the load is proportional to the
deformation parallel to the direction of the load. The ratio of
the transverse to axial strain is called Poisson’s ratio. The
Poisson’s ratios are denoted by µLR, µRL, µLT, µTL, µRT, and
µTR
. The first letter of the subscript refers to direction of
applied stress and the second letter to direction of lateral
deformation. For example, µLR is the Poisson’s ratio for
deformation along the radial axis caused by stress along the
longitudinal axis. Average values of Poisson’s ratios for
samples of a few species are given in Table 4–2. Values for
µRL
and µTL are less precisely determined than are those for
the other Poisson’s ratios. Poisson’s ratios vary within and
between species and are affected by moisture content and
specific gravity.
Radial
Tangential
Longitudinal
Fiber direction
Figure 4–1. Three principal axes of wood with
respect to grain direction and growth rings.
Table 4–1. Elastic ratios for various species at
approximately 12% moisture contenta
Species
ET/EL
ER/EL GLR/EL GLT/EL GRT/EL
Hardwoods
Ash, white
0.080
0.125
0.109
0.077
—
Balsa
0.015
0.046
0.054
0.037
0.005
Basswood
0.027
0.066
0.056
0.046
—
Birch, yellow
0.050
0.078
0.074
0.068
0.017
Cherry, black
0.086
0.197
0.147
0.097
—
Cottonwood, eastern
0.047
0.083
0.076
0.052
—
Mahogany, African
0.050
0.111
0.088
0.059
0.021
Mahogany, Honduras
0.064
0.107
0.066
0.086
0.028
Maple, sugar
0.065
0.132
0.111
0.063
—
Maple, red
0.067
0.140
0.133
0.074
—
Oak, red
0.082
0.154
0.089
0.081
—
Oak, white
0.072
0.163
0.086
—
—
Sweet gum
0.050
0.115
0.089
0.061
0.021
Walnut, black
0.056
0.106
0.085
0.062
0.021
Yellow-poplar
0.043
0.092
0.075
0.069
0.011
Softwoods
Baldcypress
0.039
0.084
0.063
0.054
0.007
Cedar, northern white
0.081
0.183
0.210
0.187
0.015
Cedar, western red
0.055
0.081
0.087
0.086
0.005
Douglas-fir
0.050
0.068
0.064
0.078
0.007
Fir, subalpine
0.039
0.102
0.070
0.058
0.006
Hemlock, western
0.031
0.058
0.038
0.032
0.003
Larch, western
0.065
0.079
0.063
0.069
0.007
Pine
Loblolly
0.078
0.113
0.082
0.081
0.013
Lodgepole
0.068
0.102
0.049
0.046
0.005
Longleaf
0.055
0.102
0.071
0.060
0.012
Pond
0.041
0.071
0.050
0.045
0.009
Ponderosa
0.083
0.122
0.138
0.115
0.017
Red
0.044
0.088
0.096
0.081
0.011
Slash
0.045
0.074
0.055
0.053
0.010
Sugar
0.087
0.131
0.124
0.113
0.019
Western white
0.038
0.078
0.052
0.048
0.005
Redwood
0.089
0.087
0.066
0.077
0.011
Spruce, Sitka
0.043
0.078
0.064
0.061
0.003
Spruce, Engelmann
0.059
0.128
0.124
0.120
0.010
aEL may be approximated by increasing modulus of elasticity values
in Table 4–3 by 10%.
4–3
Modulus of Rigidity
The modulus of rigidity, also called shear modulus, indi-
cates the resistance to deflection of a member caused by shear
stresses. The three moduli of rigidity denoted by GLR, GLT,
and GRT are the elastic constants in the LR, LT, and RT
planes, respectively. For example, GLR is the modulus of
rigidity based on shear strain in the LR plane and shear
stresses in the LT and RT planes. Average values of shear
moduli for samples of a few species expressed as ratios with
EL are given in Table 4–1. As with moduli of elasticity, the
moduli of rigidity vary within and between species and with
moisture content and specific gravity.
Strength Properties
Common Properties
Mechanical properties most commonly measured and repre-
sented as “strength properties” for design include modulus of
rupture in bending, maximum stress in compression parallel
to grain, compressive stress perpendicular to grain, and shear
strength parallel to grain. Additional measurements are often
made to evaluate work to maximum load in bending, impact
bending strength, tensile strength perpendicular to grain, and
hardness. These properties, grouped according to the broad
forest tree categories of hardwood and softwood (not corre-
lated with hardness or softness), are given in Tables 4–3 to
4–5 for many of the commercially important species. Average
coefficients of variation for these properties from a limited
sampling of specimens are reported in Table 4–6.
Modulus of rupture—Reflects the maximum load-
carrying capacity of a member in bending and is propor-
tional to maximum moment borne by the specimen.
Modulus of rupture is an accepted criterion of strength, al-
though it is not a true stress because the formula by which
it is computed is valid only to the elastic limit.
Work to maximum load in bending—Ability to absorb
shock with some permanent deformation and more or less
injury to a specimen. Work to maximum load is a meas-
ure of the combined strength and toughness of wood under
bending stresses.
Compressive strength parallel to grain—Maximum
stress sustained by a compression parallel-to-grain speci-
men having a ratio of length to least dimension of less
than 11.
Compressive stress perpendicular to grain—Reported
as stress at proportional limit. There is no clearly defined
ultimate stress for this property.
Shear strength parallel to grain—Ability to resist inter-
nal slipping of one part upon another along the grain.
Values presented are average strength in radial and tangen-
tial shear planes.
Impact bending—In the impact bending test, a hammer
of given weight is dropped upon a beam from successively
increased heights until rupture occurs or the beam deflects
152 mm (6 in.) or more. The height of the maximum
drop, or the drop that causes failure, is a comparative value
that represents the ability of wood to absorb shocks that
cause stresses beyond the proportional limit.
Tensile strength perpendicular to grain—Resistance of
wood to forces acting across the grain that tend to split a
member. Values presented are the average of radial and
tangential observations.
Hardness—Generally defined as resistance to indentation
using a modified Janka hardness test, measured by the load
required to embed a 11.28-mm (0.444-in.) ball to one-half
its diameter. Values presented are the average of radial and
tangential penetrations.
Tensile strength parallel to grain—Maximum tensile
stress sustained in direction parallel to grain. Relatively
few data are available on the tensile strength of various
species of clear wood parallel to grain. Table 4–7 lists av-
erage tensile strength values for a limited number of
specimens of a few species. In the absence of sufficient ten-
sion test data, modulus of rupture values are sometimes
substituted for tensile strength of small, clear, straight-
grained pieces of wood. The modulus of rupture is consid-
ered to be a low or conservative estimate of tensile strength
for clear specimens (this is not true for lumber).
Table 4–2. Poisson’s ratios for various species at
approximately 12% moisture content
Species
µLR
µLT
µRT
µTR
µRL
µTL
Hardwoods
Ash, white
0.371 0.440
0.684 0.360 0.059 0.051
Aspen, quaking
0.489 0.374
—
0.496 0.054 0.022
Balsa
0.229 0.488
0.665 0.231 0.018 0.009
Basswood
0.364 0.406
0.912 0.346 0.034 0.022
Birch, yellow
0.426 0.451
0.697 0.426 0.043 0.024
Cherry, black
0.392 0.428
0.695 0.282 0.086 0.048
Cottonwood, eastern
0.344 0.420
0.875 0.292 0.043 0.018
Mahogany, African
0.297 0.641
0.604 0.264 0.033 0.032
Mahogany, Honduras
0.314 0.533
0.600 0.326 0.033 0.034
Maple, sugar
0.424 0.476
0.774 0.349 0.065 0.037
Maple, red
0.434 0.509
0.762 0.354 0.063 0.044
Oak, red
0.350 0.448
0.560 0.292 0.064 0.033
Oak, white
0.369 0.428
0.618 0.300 0.074 0.036
Sweet gum
0.325 0.403
0.682 0.309 0.044 0.023
Walnut, black
0.495 0.632
0.718 0.378 0.052 0.035
Yellow-poplar
0.318 0.392
0.703 0.329 0.030 0.019
Softwoods
Baldcypress
0.338 0.326
0.411 0.356
—
—
Cedar, northern white 0.337 0.340
0.458 0.345
—
—
Cedar, western red
0.378 0.296
0.484 0.403
—
—
Douglas-fir
0.292 0.449
0.390 0.374 0.036 0.029
Fir, subalpine
0.341 0.332
0.437 0.336
—
—
Hemlock, western
0.485 0.423
0.442 0.382
—
—
Larch, western
0.355 0.276
0.389 0.352
—
—
Pine
Loblolly
0.328 0.292
0.382 0.362
—
—
Lodgepole
0.316 0.347
0.469 0.381
—
—
Longleaf
0.332 0.365
0.384 0.342
—
—
Pond
0.280 0.364
0.389 0.320
—
—
Ponderosa
0.337 0.400
0.426 0.359
—
—
Red
0.347 0.315
0.408 0.308
—
—
Slash
0.392 0.444
0.447 0.387
—
—
Sugar
0.356 0.349
0.428 0.358
—
—
Western white
0.329 0.344
0.410 0.334
—
—
Redwood
0.360 0.346
0.373 0.400
—
—
Spruce, Sitka
0.372 0.467
0.435 0.245 0.040 0.025
Spruce, Engelmann
0.422 0.462
0.530 0.255 0.083 0.058
4–4
Table 4–3a. Strength properties of some commercially important woods grown in the United States (metric)a
Static bending
Com-
Modulus
of
Modulus
of
Work to
maxi-
mum Impact
Com-
pression
parallel
pression
perpen-
dicular
Shear
parallel
to
Tension
perpen-
dicular
Side
hard-
Common species
names
Moisture
content
Specific
gravityb
rupture
(kPa)
elasticityc
(MPa)
load
(kJ/m3)
bending
(mm)
to grain
(kPa)
to grain
(kPa)
grain
(kPa)
to grain
(kPa)
ness
(N)
Hardwoods
Alder, red
Green
0.37
45,000
8,100
55
560 20,400 1,700
5,300 2,700 2,000
12%
0.41
68,000
9,500
58
510 40,100 3,000
7,400 2,900 2,600
Ash
Black
Green
0.45
41,000
7,200
83
840 15,900 2,400
5,900 3,400 2,300
12%
0.49
87,000 11,000
103
890 41,200 5,200 10,800 4,800 3,800
Blue
Green
0.53
66,000
8,500
101
—
24,800 5,600 10,600 —
—
12%
0.58
95,000
9,700
99
—
48,100 9,800 14,000 —
—
Green
Green
0.53
66,000
9,700
81
890 29,000 5,000
8,700 4,100 3,900
12%
0.56
97,000 11,400
92
810 48,800 9,000 13,200 4,800 5,300
Oregon
Green
0.50
52,000
7,800
84
990 24,200 3,700
8,200 4,100 3,500
12%
0.55
88,000
9,400
99
840 41,600 8,600 12,300 5,000 5,200
White
Green
0.55
66,000
9,900
108
970 27,500 4,600
9,300 4,100 4,300
12%
0.60 103,000 12,000
115
1,090 51,100 8,000 13,200 6,500 5,900
Aspen
Bigtooth
Green
0.36
37,000
7,700
39
—
17,200 1,400
5,000 —
—
12%
0.39
63,000
9,900
53
—
36,500 3,100
7,400 —
—
Quaking
Green
0.35
35,000
5,900
44
560 14,800 1,200
4,600 1,600 1,300
12%
0.38
58,000
8,100
52
530 29,300 2,600
5,900 1,800 1,600
Basswood, American Green
0.32
34,000
7,200
37
410 15,300 1,200
4,100 1,900 1,100
12%
0.37
60,000 10,100
50
410 32,600 2,600
6,800 2,400 1,800
Beech, American
Green
0.56
59,000
9,500
82
1,090 24,500 3,700
8,900 5,000 3,800
12%
0.64 103,000 11,900
104
1,040 50,300 7,000 13,900 7,000 5,800
Birch
Paper
Green
0.48
44,000
8,100
112
1,240 16,300
1,900 5,800 2,600 2,500
12%
0.55
85,000 11,000
110
860 39,200
4,100 8,300 — 4,000
Sweet
Green
0.60
65,000 11,400
108
1,220 25,800
3,200 8,500 3,000 4,300
12%
0.65 117,000 15,000
124
1,190 58,900
7,400 15,400 6,600 6,500
Yellow
Green
0.55
57,000 10,300
111
1,220 23,300
3,000 7,700 3,000 3,600
12%
0.62 114,000 13,900
143
1,400 56,300
6,700 13,000 6,300 5,600
Butternut
Green
0.36
37,000
6,700
57
610 16,700
1,500 5,200 3,000 1,700
12%
0.38
56,000
8,100
57
610 36,200
3,200 8,100 3,000 2,200
Cherry, black
Green
0.47
55,000
9,000
88
840 24,400
2,500 7,800 3,900 2,900
12%
0.50
85,000 10,300
79
740 49,000
4,800 11,700 3,900 4,200
Chestnut, American
Green
0.40
39,000
6,400
48
610 17,000
2,100 5,500 3,000 1,900
12%
0.43
59,000
8,500
45
480 36,700
4,300 7,400 3,200 2,400
Cottonwood
Balsam poplar
Green
0.31
27,000
5,200
29
—
11,700 1,000
3,400 —
—
12%
0.34
47,000
7,600
34
—
27,700 2,100
5,400 —
—
Black
Green
0.31
34,000
7,400
34
510 15,200 1,100
4,200 1,900 1,100
12%
0.35
59,000
8,800
46
560 31,000 2,100
7,200 2,300 1,600
Eastern
Green
0.37
37,000
7,000
50
530 15,700 1,400
4,700 2,800 1,500
12%
0.40
59,000
9,400
51
510 33,900 2,600
6,400 4,000 1,900
Elm
American
Green
0.46
50,000
7,700
81
970 20,100 2,500
6,900 4,100 2,800
12%
0.50
81,000
9,200
90
990 38,100 4,800 10,400 4,600 3,700
Rock
Green
0.57
66,000
8,200
137
1,370 26,100 4,200
8,800 —
—
12%
0.63 102,000 10,600
132
1,420 48,600 8,500 13,200 —
—
Slippery
Green
0.48
55,000
8,500
106
1,190 22,900 2,900
7,700 4,400 2,900
12%
0.53
90,000 10,300
117
1,140 43,900 5,700 11,200 3,700 3,800
Hackberry
Green
0.49
45,000
6,600
100
1,220 18,300 2,800
7,400 4,300 3,100
12%
0.53
76,000
8,200
88
1,090 37,500 6,100 11,000 4,000 3,900
4–5
Table 4–3a. Strength properties of some commercially important woods grown in the United States (metric)a—con.
Static bending
Com-
Modulus
of
Modulus
of
Work to
maxi-
mum Impact
Com-
pression
parallel
pression
perpen-
dicular
Shear
parallel
to
Tension
perpen-
dicular
Side
hard-
Common species
names
Moisture
content
Specific
gravityb
rupture
(kPa)
elasticityc
(MPa)
load
(kJ/m3)
bending
(mm)
to grain
(kPa)
to grain
(kPa)
grain
(kPa)
to grain
(kPa)
ness
(N)
Hickory, pecan
Bitternut
Green
0.60
71,000
9,700
138
1,680 31,500 5,500
8,500 —
—
12%
0.66 118,000 12,300
125
1,680 62,300 11,600
—
—
—
Nutmeg
Green
0.56
63,000
8,900
157
1,370 27,400 5,200
7,100 —
—
12%
0.60 114,000 11,700
173
—
47,600 10,800
—
—
—
Pecan
Green
0.60
68,000
9,400
101
1,350 27,500 5,400 10,200 4,700 5,800
12%
0.66
94,000 11,900
95
1,120 54,100 11,900 14,300 —
8,100
Water
Green
0.61
74,000 10,800
130
1,420 32,100 6,100
9,900 —
—
12%
0.62 123,000 13,900
133
1,350 59,300 10,700
—
—
—
Hickory, true
Mockernut
Green
0.64
77,000 10,800
180
2,240 30,900 5,600
8,800 —
—
12%
0.72 132,000 15,300
156
1,960 61,600 11,900 12,000 —
—
Pignut
Green
0.66
81,000 11,400
219
2,260 33,200 6,300
9,400 —
—
12%
0.75 139,000 15,600
210
1,880 63,400 13,700 14,800 —
—
Shagbark
Green
0.64
76,000 10,800
163
1,880 31,600 5,800 10,500 —
—
12%
0.72 139,000 14,900
178
1,700 63,500 12,100 16,800 —
—
Shellbark
Green
0.62
72,000
9,200
206
2,640 27,000 5,600
8,200 —
—
12%
0.69 125,000 13,000
163
2,240 55,200 12,400 14,500 —
—
Honeylocust
Green
0.60
70,000
8,900
87
1,190 30,500 7,900 11,400 6,400 6,200
12%
—
101,000 11,200
92
1,190 51,700 12,700 15,500 6,200 7,000
Locust, black
Green
0.66
95,000 12,800
106
1,120 46,900 8,000 12,100 5,300 7,000
12%
0.69 134,000 14,100
127
1,450 70,200 12,600 17,100 4,400 7,600
Magnolia
Cucumber tree
Green
0.44
51,000 10,800
69
760 21,600 2,300
6,800 3,000 2,300
12%
0.48
85,000 12,500
84
890 43,500 3,900
9,200 4,600 3,100
Southern
Green
0.46
47,000
7,700
106
1,370 18,600 3,200
7,200 4,200 3,300
12%
0.50
77,000
9,700
88
740 37,600 5,900 10,500 5,100 4,500
Maple
Bigleaf
Green
0.44
51,000
7,600
60
580 22,300 3,100
7,700 4,100 2,800
12%
0.48
74,000 10,000
54
710 41,000 5,200 11,900 3,700 3,800
Black
Green
0.52
54,000
9,200
88
1,220 22,500 4,100
7,800 5,000 3,700
12%
0.57
92,000 11,200
86
1,020 46,100 7,000 12,500 4,600 5,200
Red
Green
0.49
53,000
9,600
79
810 22,600 2,800
7,900 —
3,100
12%
0.54
92,000 11,300
86
810 45,100 6,900 12,800 —
4,200
Silver
Green
0.44
40,000
6,500
76
740 17,200 2,600
7,200 3,900 2,600
12%
0.47
61,000
7,900
57
640 36,000 5,100 10,200 3,400 3,100
Sugar
Green
0.56
65,000 10,700
92
1,020 27,700 4,400 10,100 —
4,300
12%
0.63 109,000 12,600
114
990 54,000 10,100 16,100 —
6,400
Oak, red
Black
Green
0.56
57,000
8,100
84
1,020 23,900 4,900
8,400 —
4,700
12%
0.61
96,000 11,300
94
1,040 45,000 6,400 13,200 —
5,400
Cherrybark
Green
0.61
74,000 12,300
101
1,370 31,900 5,200
9,100 5,500 5,500
12%
0.68 125,000 15,700
126
1,240 60,300 8,600 13,800 5,800 6,600
Laurel
Green
0.56
54,000
9,600
77
990 21,900 3,900
8,100 5,300 4,400
12%
0.63
87,000 11,700
81
990 48,100 7,300 12,600 5,400 5,400
Northern red
Green
0.56
57,000
9,300
91
1,120 23,700 4,200
8,300 5,200 4,400
12%
0.63
99,000 12,500
100
1,090 46,600 7,000 12,300 5,500 5,700
Pin
Green
0.58
57,000
9,100
97
1,220 25,400 5,000
8,900 5,500 4,800
12%
0.63
97,000 11,900
102
1,140 47,000 7,000 14,300 7,200 6,700
Scarlet
Green
0.60
72,000 10,200
103
1,370 28,200 5,700
9,700 4,800 5,300
12%
0.67 120,000 13,200
141
1,350 57,400 7,700 13,000 6,000 6,200
Southern red
Green
0.52
48,000
7,900
55
740 20,900 3,800
6,400 3,300 3,800
12%
0.59
75,000 10,300
65
660 42,000 6,000
9,600 3,500 4,700
Water
Green
0.56
61,000 10,700
77
990 25,800 4,300
8,500 5,700 4,500
12%
0.63 106,000 13,900
148
1,120 46,700 7,000 13,900 6,300 5,300
4–6
Table 4–3a. Strength properties of some commercially important woods grown in the United States (metric)a—con.
Static bending
Com-
Modulus
of
Modulus
of
Work to
maxi-
mum Impact
Com-
pression
parallel
pression
perpen-
dicular
Shear
parallel
to
Tension
perpen-
dicular
Side
hard-
Common species
names
Moisture
content
Specific
gravityb
rupture
(kPa)
elasticityc
(MPa)
load
(kJ/m3)
bending
(mm)
to grain
(kPa)
to grain
(kPa)
grain
(kPa)
to grain
(kPa)
ness
(N)
Oak, red—con.
Willow
Green
0.56
51,000
8,900
61
890 20,700 4,200
8,100 5,200 4,400
12%
0.69 100,000 13,100
101
1,070 48,500 7,800 11,400 —
6,500
Oak, white
Bur
Green
0.58
50,000
6,100
74
1,120 22,700 4,700
9,300 5,500 4,900
12%
0.64
71,000
7,100
68
740 41,800 8,300 12,500 4,700 6,100
Chestnut
Green
0.57
55,000
9,400
65
890 24,300 3,700
8,300 4,800 4,000
12%
0.66
92,000 11,000
76
1,020 47,100 5,800 10,300 —
5,000
Live
Green
0.80
82,000 10,900
85
—
37,400 14,100 15,200 —
—
12%
0.88 127,000 13,700
130
—
61,400 19,600 18,300 —
—
Overcup
Green
0.57
55,000
7,900
87
1,120 23,200 3,700
9,100 5,000 4,300
12%
0.63
87,000
9,800
108
970 42,700 5,600 13,800 6,500 5,300
Post
Green
0.60
56,000
7,500
76
1,120 24,000 5,900
8,800 5,400 5,000
12%
0.67
91,000 10,400
91
1,170 45,300 9,900 12,700 5,400 6,000
Swamp chestnut
Green
0.60
59,000
9,300
88
1,140 24,400 3,900
8,700 4,600 4,900
12%
0.67
96,000 12,200
83
1,040 50,100 7,700 13,700 4,800 5,500
Swamp white
Green
0.64
68,000 11,000
100
1,270 30,100 5,200
9,000 5,900 5,200
12%
0.72 122,000 14,100
132
1,240 59,300 8,200 13,800 5,700 7,200
White
Green
0.60
57,000
8,600
80
1,070 24,500 4,600
8,600 5,300 4,700
12%
0.68 105,000 12,300
102
940 51,300 7,400 13,800 5,500 6,000
Sassafras
Green
0.42
41,000
6,300
49
—
18,800 2,600
6,600 —
—
12%
0.46
62,000
7,700
60
—
32,800 5,900
8,500 —
—
Sweetgum
Green
0.46
49,000
8,300
70
910 21,000 2,600
6,800 3,700 2,700
12%
0.52
86,000 11,300
82
810 43,600 4,300 11,000 5,200 3,800
Sycamore, American
Green
0.46
45,000
7,300
52
660 20,100 2,500
6,900 4,300 2,700
12%
0.49
69,000
9,800
59
660 37,100 4,800 10,100 5,000 3,400
Tanoak
Green
0.58
72,000 10,700
92
—
32,100
—
—
—
—
12%
—
—
—
—
—
—
—
—
—
—
Tupelo
Black
Green
0.46
48,000
7,100
55
760 21,000 3,300
7,600 3,900 2,800
12%
0.50
66,000
8,300
43
560 38,100 6,400
9,200 3,400 3,600
Water
Green
0.46
50,000
7,200
57
760 23,200 3,300
8,200 4,100 3,200
12%
0.50
66,000
8,700
48
580 40,800 6,000 11,000 4,800 3,900
Walnut, black
Green
0.51
66,000
9,800
101
940 29,600 3,400
8,400 3,900 4,000
12%
0.55 101,000 11,600
74
860 52,300 7,000
9,400 4,800 4,500
Willow, black
Green
0.36
33,000
5,400
76
—
14,100 1,200
4,700 —
—
12%
0.39
54,000
7,000
61
—
28,300 3,000
8,600 —
—
Yellow-poplar
Green
0.40
41,000
8,400
52
660 18,300 1,900
5,400 3,500 2,000
12%
0.42
70,000 10,900
61
610 38,200 3,400
8,200 3,700 2,400
Softwoods
Baldcypress
Green
0.42
46,000
8,100
46
640 24,700 2,800
5,600 2,100 1,700
12%
0.46
73,000
9,900
57
610 43,900 5,000
6,900 1,900 2,300
Cedar
Atlantic white
Green
0.31
32,000
5,200
41
460 16,500 1,700
4,800 1,200 1,300
12%
0.32
47,000
6,400
28
330 32,400 2,800
5,500 1,500 1,600
Eastern redcedar
Green
0.44
48,000
4,500
103
890 24,600 4,800
7,000 2,300 2,900
12%
0.47
61,000
6,100
57
560 41,500 6,300
—
—
4,000
Incense
Green
0.35
43,000
5,800
44
430 21,700 2,600
5,700 1,900 1,700
12%
0.37
55,000
7,200
37
430 35,900 4,100
6,100 1,900 2,100
Northern white
Green
0.29
29,000
4,400
39
380 13,700 1,600
4,300 1,700 1,000
12%
0.31
45,000
5,500
33
300 27,300 2,100
5,900 1,700 1,400
4–7
Table 4–3a. Strength properties of some commercially important woods grown in the United States (metric)a—con.
Static bending
Com-
Modulus
of
Modulus
of
Work to
maxi-
mum Impact
Com-
pression
parallel
pression
perpen-
dicular
Shear
parallel
to
Tension
perpen-
dicular
Side
hard-
Common species
names
Moisture
content
Specific
gravityb
rupture
(kPa)
elasticityc
(MPa)
load
(kJ/m3)
bending
(mm)
to grain
(kPa)
to grain
(kPa)
grain
(kPa)
to grain
(kPa)
ness
(N)
Cedar—con.
Port-Orford
Green
0.39
45,000
9,000
51
530 21,600 2,100
5,800 1,200 1,700
12%
0.43
88,000 11,700
63
710 43,100 5,000
9,400 2,800 2,800
Western redcedar
Green
0.31
35,900
6,500
34
430 19,100 1,700
5,300 1,600 1,200
12%
0.32
51,700
7,700
40
430 31,400 3,200
6,800 1,500 1,600
Yellow
Green
0.42
44,000
7,900
63
690 21,000 2,400
5,800 2,300 2,000
12%
0.44
77,000
9,800
72
740 43,500 4,300
7,800 2,500 2,600
Douglas-fird
Coast
Green
0.45
53,000 10,800
52
660 26,100 2,600
6,200 2,100 2,200
12%
0.48
85,000 13,400
68
790 49,900 5,500
7,800 2,300 3,200
Interior West
Green
0.46
53,000 10,400
50
660 26,700 2,900
6,500 2,000 2,300
12%
0.50
87,000 12,600
73
810 51,200 5,200
8,900 2,400 2,900
Interior North
Green
0.45
51,000
9,700
56
560 23,900 2,500
6,600 2,300 1,900
12%
0.48
90,000 12,300
72
660 47,600 5,300
9,700 2,700 2,700
Interior South
Green
0.43
47,000
8,000
55
380 21,400 2,300
6,600 1,700 1,600
12%
0.46
82,000 10,300
62
510 43,000 5,100 10,400 2,300 2,300
Fir
Balsam
Green
0.33
38,000
8,600
32
410 18,100 1,300
4,600 1,200 1,300
12%
0.35
63,000 10,000
35
510 36,400 2,800
6,500 1,200 1,800
California red
Green
0.36
40,000
8,100
44
530 19,000 2,300
5,300 2,600 1,600
12%
0.38
72,400 10,300
61
610 37,600 4,200
7,200 2,700 2,200
Grand
Green
0.35
40,000
8,600
39
560 20,300 1,900
5,100 1,700 1,600
12%
0.37
61,400 10,800
52
710 36,500 3,400
6,200 1,700 2,200
Noble
Green
0.37
43,000
9,500
41
480 20,800 1,900
5,500 1,600 1,300
12%
0.39
74,000 11,900
61
580 42,100 3,600
7,200 1,500 1,800
Pacific silver
Green
0.40
44,000
9,800
41
530 21,600 1,500
5,200 1,700 1,400
12%
0.43
75,800 12,100
64
610 44,200 3,100
8,400 —
1,900
Subalpine
Green
0.31
34,000
7,200
—
—
15,900 1,300
4,800 —
1,200
12%
0.32
59,000
8,900
—
—
33,500 2,700
7,400 —
1,600
White
Green
0.37
41,000
8,000
39
560 20,000 1,900
5,200 2,100 1,500
12%
0.39
68,000 10,300
50
510 40,000 3,700
7,600 2,100 2,100
Hemlock
Eastern
Green
0.38
44,000
7,400
46
530 21,200 2,500
5,900 1,600 1,800
12%
0.40
61,000
8,300
47
530 37,300 4,500
7,300 —
2,200
Mountain
Green
0.42
43,000
7,200
76
810 19,900 2,600
6,400 2,300 2,100
12%
0.45
79,000
9,200
72
810 44,400 5,900 10,600 —
3,000
Western
Green
0.42
46,000
9,000
48
560 23,200 1,900
5,900 2,000 1,800
12%
0.45
78,000 11,300
57
580 49,000 3,800
8,600 2,300 2,400
Larch, western
Green
0.48
53,000 10,100
71
740 25,900 2,800
6,000 2,300 2,300
12%
0.52
90,000 12,900
87
890 52,500 6,400
9,400 3,000 3,700
Pine
Eastern white
Green
0.34
34,000
6,800
36
430 16,800 1,500
4,700 1,700 1,300
12%
0.35
59,000
8,500
47
460 33,100 3,000
6,200 2,100 1,700
Jack
Green
0.40
41,000
7,400
50
660 20,300 2,100
5,200 2,500 1,800
12%
0.43
68,000
9,300
57
690 39,000 4,000
8,100 2,900 2,500
Loblolly
Green
0.47
50,000
9,700
57
760 24,200 2,700
5,900 1,800 2,000
12%
0.51
88,000 12,300
72
760 49,200 5,400
9,600 3,200 3,100
Lodgepole
Green
0.38
38,000
7,400
39
510 18,000 1,700
4,700 1,500 1,500
12%
0.41
65,000
9,200
47
510 37,000 4,200
6,100 2,000 2,100
Longleaf
Green
0.54
59,000 11,000
61
890 29,800 3,300
7,200 2,300 2,600
12%
0.59 100,000 13,700
81
860 58,400 6,600 10,400 3,200 3,900
Pitch
Green
0.47
47,000
8,300
63
—
20,300 2,500
5,900 —
—
12%
0.52
74,000
9,900
63
—
41,000 5,600
9,400 —
—
4–8
Table 4–3a. Strength properties of some commercially important woods grown in the United States (metric)a—con.
Static bending
Com-
Modulus
of
Modulus
of
Work to
maxi-
mum Impact
Com-
pression
parallel
pression
perpen-
dicular
Shear
parallel
to
Tension
perpen-
dicular
Side
hard-
Common species
names
Moisture
content
Specific
gravityb
rupture
(kPa)
elasticityc
(MPa)
load
(kJ/m3)
bending
(mm)
to grain
(kPa)
to grain
(kPa)
grain
(kPa)
to grain
(kPa)
ness
(N)
Pine—con.
Pond
Green
0.51
51,000
8,800
52
—
25,200
3,000 6,500 —
—
12%
0.56
80,000 12,100
59
—
52,000
6,300 9,500 —
—
Ponderosa
Green
0.38
35,000
6,900
36
530 16,900
1,900 4,800 2,100 1,400
12%
0.40
65,000
8,900
49
480 36,700
4,000 7,800 2,900 2,000
Red
Green
0.41
40,000
8,800
42
660 18,800
1,800 4,800 2,100 1,500
12%
0.46
76,000 11,200
68
660 41,900
4,100 8,400 3,200 2,500
Sand
Green
0.46
52,000
7,000
66
—
23,700
3,100 7,900 —
—
12%
0.48
80,000
9,700
66
—
47,700
5,800
—
—
—
Shortleaf
Green
0.47
51,000
9,600
57
760 24,300
2,400 6,300 2,200 2,000
12%
0.51
90,000 12,100
76
840 50,100
5,700 9,600 3,200 3,100
Slash
Green
0.54
60,000 10,500
66
—
26,300
3,700 6,600 —
—
12%
0.59 112,000 13,700
91
—
56,100
7,000 11,600 —
—
Spruce
Green
0.41
41,000
6,900
—
—
19,600
1,900 6,200 —
2,000
12%
0.44
72,000
8,500
—
—
39,000
5,000 10,300 —
2,900
Sugar
Green
0.34
34,000
7,100
37
430 17,000
1,400 5,000 1,900 1,200
12%
0.36
57,000
8,200
38
460 30,800
3,400 7,800 2,400 1,700
Virginia
Green
0.45
50,000
8,400
75
860 23,600
2,700 6,100 2,800 2,400
12%
0.48
90,000 10,500
94
810 46,300
6,300 9,300 2,600 3,300
Western white
Green
0.36
32,000
8,200
34
480 16,800
1,300 4,700 1,800 1,200
12%
0.38
67,000 10,100
61
580 34,700
3,200 7,200 —
1,900
Redwood
Old-growth
Green
0.38
52,000
8,100
51
530 29,000
2,900 5,500 1,800 1,800
12%
0.40
69,000
9,200
48
480 42,400
4,800 6,500 1,700 2,100
Young-growth
Green
0.34
41,000
6,600
39
410 21,400
1,900 6,100 2,100 1,600
12%
0.35
54,000
7,600
36
380 36,000
3,600 7,600 1,700 1,900
Spruce
Black
Green
0.38
42,000
9,500
51
610 19,600
1,700 5,100
700 1,600
12%
0.46
74,000 11,100
72
580 41,100
3,800 8,500 —
2,300
Engelmann
Green
0.33
32,000
7,100
35
410 15,000
1,400 4,400 1,700 1,150
12%
0.35
64,000
8,900
44
460 30,900
2,800 8,300 2,400 1,750
Red
Green
0.37
41,000
9,200
48
460 18,800
1,800 5,200 1,500 1,600
12%
0.40
74,000 11,100
58
640 38,200
3,800 8,900 2,400 2,200
Sitka
Green
0.33
34,000
7,900
43
610 16,200
1,400 4,400 1,700 1,600
12%
0.36
65,000
9,900
65
640 35,700
3,000 6,700 2,600 2,300
White
Green
0.37
39,000
7,400
41
560 17,700
1,700 4,800 1,500 1,400
12%
0.40
68,000
9,200
53
510 37,700
3,200 7,400 2,500 2,100
Tamarack
Green
0.49
50,000
8,500
50
710 24,000
2,700 5,900 1,800 1,700
12%
0.53
80,000 11,300
49
580 49,400
5,500 8,800 2,800 2,600
aResults of tests on small clear specimens in the green and air-dried conditions, converted to metric units directly from
Table 4–3b. Definition of properties: impact bending is height of drop that causes complete failure, using
0.71-kg (50-lb) hammer; compression parallel to grain is also called maximum crushing strength; compression
perpendicular to grain is fiber stress at proportional limit; shear is maximum shearing strength; tension is maximum
tensile strength; and side hardness is hardness measured when load is perpendicular to grain.
bSpecific gravity is based on weight when ovendry and volume when green or at 12% moisture content.
cModulus of elasticity measured from a simply supported, center-loaded beam, on a span depth ratio of 14/1. To correct
for shear deflection, the modulus can be increased by 10%.
dCoast Douglas-fir is defined as Douglas-fir growing in Oregon and Washington State west of the Cascade Mountains
summit. Interior West includes California and all counties in Oregon and Washington east of, but adjacent to, the
Cascade summit; Interior North, the remainder of Oregon and Washington plus Idaho, Montana, and Wyoming; and
Interior South, Utah, Colorado, Arizona, and New Mexico.
4–9
Table 4–3b. Strength properties of some commercially important woods grown in the United States (inch–pound)a
Static bending
Com-
Modulus
of
Modulus
of
Work to
maximum Impact
Com-
pression
parallel
pression
perpen-
dicular
Shear
parallel
to
Tension
perpen-
dicular
Side
hard-
Common species
names
Moisture
content
Specific
gravityb
rupture
(lbf/in2)
elasticityc
(×106 lbf/in2)
load
(in-lbf/in3)
bending
(in.)
to grain
(lbf/in2)
to grain
(lbf/in2)
grain
(lbf/in2)
to grain
(lbf/in2)
ness
(lbf)
Hardwoods
Alder, red
Green
0.37
6,500
1.17
8.0
22
2,960
250
770 390
440
12%
0.41
9,800
1.38
8.4
20
5,820
440
1,080 420
590
Ash
Black
Green
0.45
6,000
1.04
12.1
33
2,300
350
860 490
520
12%
0.49 12,600
1.60
14.9
35
5,970
760
1,570 700
850
Blue
Green
0.53
9,600
1.24
14.7
—
4,180
810
1,540 —
—
12%
0.58 13,800
1.40
14.4
—
6,980 1,420
2,030 —
—
Green
Green
0.53
9,500
1.40
11.8
35
4,200
730
1,260 590
870
12%
0.56 14,100
1.66
13.4
32
7,080 1,310
1,910 700
1,200
Oregon
Green
0.50
7,600
1.13
12.2
39
3,510
530
1,190 590
790
12%
0.55 12,700
1.36
14.4
33
6,040 1,250
1,790 720
1,160
White
Green
0.55
9,500
1.44
15.7
38
3,990
670
1,350 590
960
12%
0.60 15,000
1.74
16.6
43
7,410 1,160
1,910 940
1,320
Aspen
Bigtooth
Green
0.36
5,400
1.12
5.7
—
2,500
210
730 —
—
12%
0.39
9,100
1.43
7.7
—
5,300
450
1,080 —
—
Quaking
Green
0.35
5,100
0.86
6.4
22
2,140
180
660 230
300
12%
0.38
8,400
1.18
7.6
21
4,250
370
850 260
350
Basswood, American
Green
0.32
5,000
1.04
5.3
16
2,220
170
600 280
250
12%
0.37
8,700
1.46
7.2
16
4,730
370
990 350
410
Beech, American
Green
0.56
8,600
1.38
11.9
43
3,550
540
1,290 720
850
12%
0.64 14,900
1.72
15.1
41
7,300 1,010
2,0101,010 1,300
Birch
Paper
Green
0.48
6,400
1.17
16.2
49
2,360
270
840 380
560
12%
0.55 12,300
1.59
16.0
34
5,690
600
1,210 —
910
Sweet
Green
0.60
9,400
1.65
15.7
48
3,740
470
1,240 430
970
12%
0.65 16,900
2.17
18.0
47
8,540 1,080
2,240 950
1,470
Yellow
Green
0.55
8,300
1.50
16.1
48
3,380
430
1,110 430
780
12%
0.62 16,600
2.01
20.8
55
8,170
970
1,880 920
1,260
Butternut
Green
0.36
5,400
0.97
8.2
24
2,420
220
760 430
390
12%
0.38
8,100
1.18
8.2
24
5,110
460
1,170 440
490
Cherry, black
Green
0.47
8,000
1.31
12.8
33
3,540
360
1,130 570
660
12%
0.50 12,300
1.49
11.4
29
7,110
690
1,700 560
950
Chestnut, American
Green
0.40
5,600
0.93
7.0
24
2,470
310
800 440
420
12%
0.43
8,600
1.23
6.5
19
5,320
620
1,080 460
540
Cottonwood
Balsam, poplar
Green
0.31
3,900
0.75
4.2
—
1,690
140
500 —
—
12%
0.34
6,800
1.10
5.0
—
4,020
300
790 —
—
Black
Green
0.31
4,900
1.08
5.0
20
2,200
160
610 270
250
12%
0.35
8,500
1.27
6.7
22
4,500
300
1,040 330
350
Eastern
Green
0.37
5,300
1.01
7.3
21
2,280
200
680 410
340
12%
0.40
8,500
1.37
7.4
20
4,910
380
930 580
430
Elm
American
Green
0.46
7,200
1.11
11.8
38
2,910
360
1,000 590
620
12%
0.50 11,800
1.34
13.0
39
5,520
690
1,510 660
830
Rock
Green
0.57
9,500
1.19
19.8
54
3,780
610
1,270 —
940
12%
0.63 14,800
1.54
19.2
56
7,050 1,230
1,920 —
1,320
Slippery
Green
0.48
8,000
1.23
15.4
47
3,320
420
1,110 640
660
12%
0.53 13,000
1.49
16.9
45
6,360
820
1,630 530
860
Hackberry
Green
0.49
6,500
0.95
14.5
48
2,650
400
1,070 630
700
12%
0.53 11,000
1.19
12.8
43
5,440
890
1,590 580
880
4–10
Table 4–3b. Strength properties of some commercially important woods grown in the United States (inch–pound)a—con.
Static bending
Com-
Modulus
of
Modulus
of
Work to
maximum Impact
Com-
pression
parallel
pression
perpen-
dicular
Shear
parallel
to
Tension
perpen-
dicular
Side
hard-
Common species
names
Moisture
content
Specific
gravityb
rupture
(lbf/in2)
elasticityc
(×106 lbf/in2)
load
(in-lbf/in3)
bending
(in.)
to grain
(lbf/in2)
to grain
(lbf/in2)
grain
(lbf/in2)
to grain
(lbf/in2)
ness
(lbf)
Hickory, pecan
Bitternut
Green
0.60 10,300
1.40
20.0
66
4,570
800 1,240
—
—
12%
0.66 17,100
1.79
18.2
66
9,040 1,680
—
—
—
Nutmeg
Green
0.56
9,100
1.29
22.8
54
3,980
760 1,030
—
—
12%
0.60 16,600
1.70
25.1
—
6,910 1,570
—
—
—
Pecan
Green
0.60
9,800
1.37
14.6
53
3,990
780 1,480 680 1,310
12%
0.66 13,700
1.73
13.8
44
7,850 1,720 2,080
—
1,820
Water
Green
0.61 10,700
1.56
18.8
56
4,660
880 1,440
—
—
12%
0.62 17,800
2.02
19.3
53
8,600 1,550
—
—
—
Hickory, true
Mockernut
Green
0.64 11,100
1.57
26.1
88
4,480
810 1,280
—
—
12%
0.72 19,200
2.22
22.6
77
8,940 1,730 1,740
—
—
Pignut
Green
0.66 11,700
1.65
31.7
89
4,810
920 1,370
—
—
12%
0.75 20,100
2.26
30.4
74
9,190 1,980 2,150
—
—
Shagbark
Green
0.64 11,000
1.57
23.7
74
4,580
840 1,520
—
—
12%
0.72 20,200
2.16
25.8
67
9,210 1,760 2,430
—
—
Shellbark
Green
0.62 10,500
1.34
29.9
104
3,920
810 1,190
—
—
12%
0.69 18,100
1.89
23.6
88
8,000 1,800 2,110
—
—
Honeylocust
Green
0.60 10,200
1.29
12.6
47
4,420 1,150 1,660 930 1,390
12%
—
14,700
1.63
13.3
47
7,500 1,840 2,250 900 1,580
Locust, black
Green
0.66 13,800
1.85
15.4
44
6,800 1,160 1,760 770 1,570
12%
0.69 19,400
2.05
18.4
57
10,180 1,830 2,480 640 1,700
Magnolia
Cucumbertree
Green
0.44
7,400
1.56
10.0
30
3,140
330
990 440
520
12%
0.48 12,300
1.82
12.2
35
6,310
570 1,340 660
700
Southern
Green
0.46
6,800
1.11
15.4
54
2,700
460 1,040 610
740
12%
0.50 11,200
1.40
12.8
29
5,460
860 1,530 740 1,020
Maple
Bigleaf
Green
0.44
7,400
1.10
8.7
23
3,240
450 1,110 600
620
12%
0.48 10,700
1.45
7.8
28
5,950
750 1,730 540
850
Black
Green
0.52
7,900
1.33
12.8
48
3,270
600 1,130 720
840
12%
0.57 13,300
1.62
12.5
40
6,680 1,020 1,820 670 1,180
Red
Green
0.49
7,700
1.39
11.4
32
3,280
400 1,150
—
700
12%
0.54 13,400
1.64
12.5
32
6,540 1,000 1,850
—
950
Silver
Green
0.44
5,800
0.94
11.0
29
2,490
370 1,050 560
590
12%
0.47
8,900
1.14
8.3
25
5,220
740 1,480 500
700
Sugar
Green
0.56
9,400
1.55
13.3
40
4,020
640 1,460
—
970
12%
0.63 15,800
1.83
16.5
39
7,830 1,470 2,330
—
1,450
Oak, red
Black
Green
0.56
8,200
1.18
12.2
40
3,470
710 1,220
—
1,060
12%
0.61 13,900
1.64
13.7
41
6,520
930 1,910
—
1,210
Cherrybark
Green
0.61 10,800
1.79
14.7
54
4,620
760 1,320 800 1,240
12%
0.68 18,100
2.28
18.3
49
8,740 1,250 2,000 840 1,480
Laurel
Green
0.56
7900
1.39
11.2
39
3,170
570 1,180 770 1,000
12%
0.63 12,600
1.69
11.8
39
6,980 1,060 1,830 790 1,210
Northern red
Green
0.56
8300
1.35
13.2
44
3,440
610 1,210 750 1,000
12%
0.63 14,300
1.82
14.5
43
6,760 1,010 1,780 800 1,290
Pin
Green
0.58
8300
1.32
14.0
48
3,680
720 1,290 800 1,070
12%
0.63
14000
1.73
14.8
45
6,820 1,020 2,080 1,050 1,510
Scarlet
Green
0.60 10,400
1.48
15.0
54
4,090
830 1,410 700 1,200
12%
0.67
17400
1.91
20.5
53
8,330 1,120 1,890 870 1,400
Southern red
Green
0.52
6,900
1.14
8.0
29
3,030
550
930 480
860
12%
0.59 10,900
1.49
9.4
26
6,090
870 1,390 510 1,060
4–11
Table 4–3b. Strength properties of some commercially important woods grown in the United States (inch–pound)a—con.
Static bending
Com-
Modulus
of
Modulus
of
Work to
maximum Impact
Com-
pression
parallel
pression
perpen-
dicular
Shear
parallel
to
Tension
perpen-
dicular
Side
hard-
Common species
names
Moisture
content
Specific
gravityb
rupture
(lbf/in2)
elasticityc
(×106 lbf/in2)
load
(in-lbf/in3)
bending
(in.)
to grain
(lbf/in2)
to grain
(lbf/in2)
grain
(lbf/in2)
to grain
(lbf/in2)
ness
(lbf)
Oak, red—con.
Water
Green
0.56
8,900
1.55
11.1
39
3,740
620 1,240 820 1,010
12%
0.63 15,400
2.02
21.5
44
6,770
1,020 2,020 920 1,190
Willow
Green
0.56
7400
1.29
8.8
35
3,000
610 1,180 760
980
12%
0.69 14,500
1.90
14.6
42
7,040
1,130 1,650
—
1,460
Oak, white
Bur
Green
0.58
7,200
0.88
10.7
44
3,290
680 1,350 800 1,110
12%
0.64 10,300
1.03
9.8
29
6,060
1,200 1,820 680 1,370
Chestnut
Green
0.57
8,000
1.37
9.4
35
3,520
530 1,210 690
890
12%
0.66 13,300
1.59
11.0
40
6,830
840 1,490
—
1,130
Live
Green
0.80 11,900
1.58
12.3
—
5,430
2,040 2,210
—
—
12%
0.88 18,400
1.98
18.9
—
8,900
2,840 2,660
—
—
Overcup
Green
0.57
8,000
1.15
12.6
44
3,370
540 1,320 730
960
12%
0.63 12,600
1.42
15.7
38
6,200
810 2,000 940 1,190
Post
Green
0.60
8,100
1.09
11.0
44
3,480
860 1,280 790 1,130
12%
0.67 13,200
1.51
13.2
46
6,600
1,430 1,840 780 1,360
Swamp chestnut
Green
0.60
8,500
1.35
12.8
45
3,540
570 1,260 670 1,110
12%
0.67 13,900
1.77
12.0
41
7,270
1,110 1,990 690 1,240
Swamp white
Green
0.64
9,900
1.59
14.5
50
4,360
760 1,300 860 1,160
12%
0.72 17,700
2.05
19.2
49
8,600
1,190 2,000 830 1,620
White
Green
0.60
8,300
1.25
11.6
42
3,560
670 1,250 770 1,060
12%
0.68 15,200
1.78
14.8
37
7,440
1,070 2,000 800 1,360
Sassafras
Green
0.42
6,000
0.91
7.1
—
2,730
370
950
—
—
12%
0.46
9,000
1.12
8.7
—
4,760
850 1,240
—
—
Sweetgum
Green
0.46
7,100
1.20
10.1
36
3,040
370
990 540
600
12%
0.52 12,500
1.64
11.9
32
6,320
620 1,600 760
850
Sycamore, American
Green
0.46
6,500
1.06
7.5
26
2,920
360 1,000 630
610
12%
0.49 10,000
1.42
8.5
26
5,380
700 1,470 720
770
Tanoak
Green
0.58 10,500
1.55
13.4
—
4,650
—
—
—
—
12%
—
—
—
—
—
—
—
—
—
—
Tupelo
Black
Green
0.46
7,000
1.03
8.0
30
3,040
480 1,100 570
640
12%
0.50
9,600
1.20
6.2
22
5,520
930 1,340 500
810
Water
Green
0.46
7,300
1.05
8.3
30
3,370
480 1,190 600
710
12%
0.50
9,600
1.26
6.9
23
5,920
870 1,590 700
880
Walnut, Black
Green
0.51
9,500
1.42
14.6
37
4,300
490 1,220 570
900
12%
0.55 14,600
1.68
10.7
34
7,580
1,010 1,370 690 1,010
Willow, Black
Green
0.36
4,800
0.79
11.0
—
2,040
180
680
—
—
12%
0.39
7,800
1.01
8.8
—
4,100
430 1,250
—
—
Yellow-poplar
Green
0.40
6,000
1.22
7.5
26
2,660
270
790 510
440
12%
0.42 10,100
1.58
8.8
24
5,540
500 1,190 540
540
Softwoods
Baldcypress
Green
0.42
6,600
1.18
6.6
25
3,580
400
810 300
390
12%
0.46 10,600
1.44
8.2
24
6,360
730 1,000 270
510
Cedar
Atlantic white
Green
0.31
4,700
0.75
5.9
18
2,390
240
690 180
290
12%
0.32
6,800
0.93
4.1
13
4,700
410
800 220
350
Eastern redcedar
Green
0.44
7,000
0.65
15.0
35
3,570
700 1,010 330
650
12%
0.47
8,800
0.88
8.3
22
6,020
920
—
—
—
Incense
Green
0.35
6,200
0.84
6.4
17
3,150
370
830 280
390
12%
0.37
8,000
1.04
5.4
17
5,200
590
880 270
470
Northern White
Green
0.29
4,200
0.64
5.7
15
1,990
230
620 240
230
12%
0.31
6,500
0.80
4.8
12
3,960
310
850 240
320
4–12
Table 4–3b. Strength properties of some commercially important woods grown in the United States (inch–pound)a—con.
Static bending
Com-
Modulus
of
Modulus
of
Work to
maximum Impact
Com-
pression
parallel
pression
perpen-
dicular
Shear
parallel
to
Tension
perpen-
dicular
Side
hard-
Common species
names
Moisture
content
Specific
gravityb
rupture
(lbf/in2)
elasticityc
(×106 lbf/in2)
load
(in-lbf/in3)
bending
(in.)
to grain
(lbf/in2)
to grain
(lbf/in2)
grain
(lbf/in2)
to grain
(lbf/in2)
ness
(lbf)
Cedar—con.
Port-Orford
Green
0.39
6,600
1.30
7.4
21
3,140
300
840 180
380
12%
0.43 12,700
1.70
9.1
28
6,250
720
1,370 400
630
Western redcedar
Green
0.31
5,200
0.94
5.0
17
2,770
240
770 230
260
12%
0.32
7,500
1.11
5.8
17
4,560
460
990 220
350
Yellow
Green
0.42
6,400
1.14
9.2
27
3,050
350
840 330
440
12%
0.44 11,100
1.42
10.4
29
6,310
620
1,130 360
580
Douglas-fird
Coast
Green
0.45
7,700
1.56
7.6
26
3,780
380
900 300
500
12%
0.48 12,400
1.95
9.9
31
7,230
800
1,130 340
710
Interior West
Green
0.46
7,700
1.51
7.2
26
3,870
420
940 290
510
12%
0.50 12,600
1.83
10.6
32
7,430
760
1,290 350
660
Interior North
Green
0.45
7,400
1.41
8.1
22
3,470
360
950 340
420
12%
0.48 13,100
1.79
10.5
26
6,900
770
1,400 390
600
Interior South
Green
0.43
6,800
1.16
8.0
15
3,110
340
950 250
360
12%
0.46 11,900
1.49
9.0
20
6,230
740
1,510 330
510
Fir
Balsam
Green
0.33
5,500
1.25
4.7
16
2,630
190
662 180
290
12%
0.35
9,200
1.45
5.1
20
5,280
404
944 180
400
California red
Green
0.36
5,800
1.17
6.4
21
2,760
330
770 380
360
12%
0.38 10,500
1.50
8.9
24
5,460
610
1,040 390
500
Grand
Green
0.35
5,800
1.25
5.6
22
2,940
270
740 240
360
12%
0.37
8,900
1.57
7.5
28
5,290
500
900 240
490
Noble
Green
0.37
6,200
1.38
6.0
19
3,010
270
800 230
290
12%
0.39 10,700
1.72
8.8
23
6,100
520
1,050 220
410
Pacific silver
Green
0.40
6,400
1.42
6.0
21
3,140
220
750 240
310
12%
0.43 11,000
1.76
9.3
24
6,410
450
1,220
—
430
Subalpine
Green
0.31
4,900
1.05
—
—
2,300
190
700
—
260
12%
0.32
8,600
1.29
—
—
4,860
390
1,070
—
350
White
Green
0.37
5,900
1.16
5.6
22
2,900
280
760 300
340
12%
0.39
9,800
1.50
7.2
20
5,800
530
1,100 300
480
Hemlock
Eastern
Green
0.38
6,400
1.07
6.7
21
3,080
360
850 230
400
12%
0.40
8,900
1.20
6.8
21
5,410
650
1,060
—
500
Mountain
Green
0.42
6,300
1.04
11.0
32
2,880
370
930 330
470
12%
0.45 11,500
1.33
10.4
32
6,440
860
1,540
—
680
Western
Green
0.42
6,600
1.31
6.9
22
3,360
280
860 290
410
12%
0.45 11,300
1.63
8.3
23
7,200
550
1,290 340
540
Larch, western
Green
0.48
7,700
1.46
10.3
29
3,760
400
870 330
510
12%
0.52 13,000
1.87
12.6
35
7,620
930
1,360 430
830
Pine
Eastern white
Green
0.34
4,900
0.99
5.2
17
2,440
220
680 250
290
12%
0.35
8,600
1.24
6.8
18
4,800
440
900 310
380
Jack
Green
0.40
6,000
1.07
7.2
26
2,950
300
750 360
400
12%
0.43
9,900
1.35
8.3
27
5,660
580
1,170 420
570
Loblolly
Green
0.47
7,300
1.40
8.2
30
3,510
390
860 260
450
12%
0.51 12,800
1.79
10.4
30
7,130
790
1,390 470
690
Lodgepole
Green
0.38
5,500
1.08
5.6
20
2,610
250
680 220
330
12%
0.41
9,400
1.34
6.8
20
5,370
610
880 290
480
Longleaf
Green
0.554
8,500
1.59
8.9
35
4,320
480
1,040 330
590
12%
0.59 14,500
1.98
11.8
34
8,470
960
1,510 470
870
Pitch
Green
0.47
6,800
1.20
9.2
—
2,950
360
860
—
—
12%
0.52 10,800
1.43
9.2
—
5,940
820
1,360
—
—
4–13
Table 4–3b. Strength properties of some commercially important woods grown in the United States (inch–pound)a—con.
Static bending
Com-
Modulus
of
Modulus
of
Work to
maximum Impact
Com-
pression
parallel
pression
perpen-
dicular
Shear
parallel
to
Tension
perpen-
dicular
Side
hard-
Common species
names
Moisture
content
Specific
gravityb
rupture
(lbf/in2)
elasticityc
(×106 lbf/in2)
load
(in-lbf/in3)
bending
(in.)
to grain
(lbf/in2)
to grain
(lbf/in2)
grain
(lbf/in2)
to grain
(lbf/in2)
ness
(lbf)
Pine—con.
Pond
Green
0.51
7,400
1.28
7.5
—
3,660
440
940
—
—
12%
0.56 11,600
1.75
8.6
—
7,540
910 1,380
—
—
Ponderosa
Green
0.38
5,100
1.00
5.2
21
2,450
280
700 310
320
12%
0.40
9,400
1.29
7.1
19
5,320
580 1,130 420
460
Red
Green
0.41
5,800
1.28
6.1
26
2,730
260
690 300
340
12%
0.46 11,000
1.63
9.9
26
6,070
600 1,210 460
560
Sand
Green
0.46
7,500
1.02
9.6
—
3,440
450 1,140
—
—
12%
0.48 11,600
1.41
9.6
—
6,920
836
—
—
—
Shortleaf
Green
0.47
7,400
1.39
8.2
30
3,530
350
910 320
440
12%
0.51 13,100
1.75
11.0
33
7,270
820 1,390 470
690
Slash
Green
0.54
8,700
1.53
9.6
—
3,820
530
960
—
—
12%
0.59 16,300
1.98
13.2
—
8,140
1020 1,680
—
—
Spruce
Green
0.41
6,000
1.00
—
—
2,840
280
900
—
450
12%
0.44 10,400
1.23
—
—
5,650
730 1,490
—
660
Sugar
Green
0.34
4,900
1.03
5.4
17
2,460
210
720 270
270
12%
0.36
8,200
1.19
5.5
18
4,460
500 1,130 350
380
Virginia
Green
0.45
7,300
1.22
10.9
34
3,420
390
890 400
540
12%
0.48 13,000
1.52
13.7
32
6,710
910 1,350 380
740
Western white
Green
0.35
4,700
1.19
5.0
19
2,430
190
680 260
260
12%
0.38
9,700
1.46
8.8
23
5,040
470 1,040
—
420
Redwood
Old-growth
Green
0.38
7,500
1.18
7.4
21
4,200
420
800 260
410
12%
0.40 10,000
1.34
6.9
19
6,150
700
940 240
480
Young-growth
Green
0.34
5,900
0.96
5.7
16
3,110
270
890 300
350
12%
0.35
7,900
1.10
5.2
15
5,220
520 1,110 250
420
Spruce
Black
Green
0.38
6,100
1.38
7.4
24
2,840
240
739 100
370
12%
0.42 10,800
1.61
10.5
23
5,960
550 1,230
—
520
Engelmann
Green
0.33
4,700
1.03
5.1
16
2,180
200
640 240
260
12%
0.35
9,300
1.30
6.4
18
4,480
410 1,200 350
390
Red
Green
0.37
6,000
1.33
6.9
18
2,720
260
750 220
350
12%
0.40 10,800
1.61
8.4
25
5,540
550 1,290 350
490
Sitka
Green
0.37
5,700
1.23
6.3
24
2,670
280
760 250
350
12%
0.40 10,200
1.57
9.4
25
5,610
580 1,150 370
510
White
Green
0.33
5,000
1.14
6.0
22
2,350
210
640 220
320
12%
0.36
9,400
1.43
7.7
20
5,180
430
970 360
480
Tamarack
Green
0.49
7,200
1.24
7.2
28
3,480
390
860 260
380
12%
0.53 11,600
1.64
7.1
23
7,160
800 1,280 400
590
aResults of tests on small clear specimens in the green and air-dried conditions. Definition of properties: impact bending is
height of drop that causes complete failure, using 0.71-kg (50-lb) hammer; compression parallel to grain is also called maxi-
mum crushing strength; compression perpendicular to grain is fiber stress at proportional limit; shear is maximum shearing
strength; tension is maximum tensile strength; and side hardness is hardness measured when load is perpendicular to grain.
bSpecific gravity is based on weight when ovendry and volume when green or at 12% moisture content.
cModulus of elasticity measured from a simply supported, center-loaded beam, on a span depth ratio of 14/1. To correct for
shear deflection, the modulus can be increased by 10%.
dCoast Douglas-fir is defined as Douglas-fir growing in Oregon and Washington State west of the Cascade Mountains summit.
Interior West includes California and all counties in Oregon and Washington east of, but adjacent to, the Cascade summit;
Interior North, the remainder of Oregon and Washington plus Idaho, Montana, and Wyoming; and Interior South, Utah,
Colorado, Arizona, and New Mexico.
4–14
Table 4–4a. Mechanical properties of some commercially important woods grown in Canada and imported into
the United States (metric)a
Static bending
Compression
Compression
Shear
Common species
names
Moisture
content
Specific
gravity
Modulus of
rupture (kPa)
Modulus of
elasticity (MPa)
parallel to
grain (kPa)
perpendicular
to grain (kPa)
parallel to
grain (kPa)
Hardwoods
Aspen
Quaking
Green
0.37
38,000
9,000
16,200
1,400
5,000
12%
68,000
11,200
36,300
3,500
6,800
Big-toothed
Green
0.39
36,000
7,400
16,500
1,400
5,400
12%
66,000
8,700
32,800
3,200
7,600
Cottonwood
Black
Green
0.30
28,000
6,700
12,800
700
3,900
12%
49,000
8,800
27,700
1,800
5,900
Eastern
Green
0.35
32,000
6,000
13,600
1,400
5,300
12%
52,000
7,800
26,500
3,200
8,000
Balsam, poplar
Green
0.37
34,000
7,900
14,600
1,200
4,600
12%
70,000
11,500
34,600
2,900
6,100
Softwoods
Cedar
Northern white
Green
0.30
27,000
3,600
13,000
1,400
4,600
12%
42,000
4,300
24,800
2,700
6,900
Western redcedar
Green
0.31
36,000
7,200
19,200
1,900
4,800
12%
54,000
8,200
29,600
3,400
5,600
Yellow
Green
0.42
46,000
9,200
22,300
2,400
6,100
12%
80,000
11,000
45,800
4,800
9,200
Douglas-fir
Green
0.45
52,000
11,100
24,900
3,200
6,300
12%
88,000
13,600
50,000
6,000
9,500
Fir
Subalpine
Green
0.33
36,000
8,700
17,200
1,800
4,700
12%
56,000
10,200
36,400
3,700
6,800
Pacific silver
Green
0.36
38,000
9,300
19,100
1,600
4,900
12%
69,000
11,300
40,900
3,600
7,500
Balsam
Green
0.34
36,000
7,800
16,800
1,600
4,700
12%
59,000
9,600
34,300
3,200
6,300
Hemlock
Eastern
Green
0.40
47,000
8,800
23,600
2,800
6,300
12%
67,000
9,700
41,200
4,300
8,700
Western
Green
0.41
48,000
10,200
24,700
2,600
5,200
12%
81,000
12,300
46,700
4,600
6,500
Larch, western
Green
0.55
60,000
11,400
30,500
3,600
6,300
12%
107,000
14,300
61,000
7,300
9,200
Pine
Eastern white
Green
0.36
35,000
8,100
17,900
1,600
4,400
12%
66,000
9,400
36,000
3,400
6,100
Jack
Green
0.42
43,000
8,100
20,300
2,300
5,600
12%
78,000
10,200
40,500
5,700
8,200
Lodgepole
Green
0.40
39,000
8,800
19,700
1,900
5,000
12%
76,000
10,900
43,200
3,600
8,500
Ponderosa
Green
0.44
39,000
7,800
19,600
2,400
5,000
12%
73,000
9,500
42,300
5,200
7,000
Red
Green
0.39
34,000
7,400
16,300
1,900
4,900
12%
70,000
9,500
37,900
5,200
7,500
Western white
Green
0.36
33,000
8,200
17,400
1,600
4,500
12%
64,100
10,100
36,100
3,200
6,300
Spruce
Black
Green
0.41
41,000
9,100
19,000
2,100
5,500
12%
79,000
10,500
41,600
4,300
8,600
Engelmann
Green
0.38
39,000
8,600
19,400
1,900
4,800
12%
70,000
10,700
42,400
3,700
7,600
Red
Green
0.38
41,000
9,100
19,400
1,900
5,600
12%
71,000
11,000
38,500
3,800
9,200
Sitka
Green
0.35
37,000
9,400
17,600
2,000
4,300
12%
70,000
11,200
37,800
4,100
6,800
White
Green
0.35
35,000
7,900
17,000
1,600
4,600
12%
63,000
10,000
37,000
3,400
6,800
Tamarack
Green
0.48
47,000
8,600
21,600
2,800
6,300
12%
76,000
9,400
44,900
6,200
9,000
aResults of tests on small, clear, straight-grained specimens. Property values based on ASTM Standard D2555–88. Information on additional
properties can be obtained from Department of Forestry, Canada, Publication No. 1104. For each species, values in the first line are from
tests of green material; those in the second line are adjusted from the green condition to 12% moisture content using dry to green clear wood
property ratios as reported in ASTM D2555–88. Specific gravity is based on weight when ovendry and volume when green.
4–15
Table 4–4b. Mechanical properties of some commercially important woods grown in Canada and imported into the
United States (inch–pound)a
Static bending
Compression
Compression
Shear
Common species
names
Moisture
content
Specific
gravity
Modulus of
rupture (lbf/in2)
Modulus of elas-
ticity (×106 lbf/in2)
parallel to
grain (lbf/in2)
perpendicular
to grain (lbf/in2)
parallel to
grain (lbf/in2)
Hardwoods
Aspen
Quaking
Green
0.37
5,500
1.31
2,350
200
720
12%
9,800
1.63
5,260
510
980
Bigtooth
Green
0.39
5,300
1.08
2,390
210
790
12%
9,500
1.26
4,760
470
1,100
Cottonwood
Balsam, poplar
Green
0.37
5,000
1.15
2,110
180
670
12%
10,100
1.67
5,020
420
890
Black
Green
0.30
4,100
0.97
1,860
100
560
12%
7,100
1.28
4,020
260
860
Eastern
Green
0.35
4,700
0.87
1,970
210
770
12%
7,500
1.13
3,840
470
1,160
Softwoods
Cedar
Northern white
Green
0.30
3,900
0.52
1,890
200
660
12%
6,100
0.63
3,590
390
1,000
Western redcedar
Green
0.31
5,300
1.05
2,780
280
700
12%
7,800
1.19
4,290
500
810
Yellow
Green
0.42
6,600
1.34
3,240
350
880
12%
11,600
1.59
6,640
690
1,340
Douglas-fir
Green
0.45
7,500
1.61
3,610
460
920
12%
12,800
1.97
7,260
870
1,380
Fir
Balsam
Green
0.34
5,300
1.13
2,440
240
680
12%
8,500
1.40
4,980
460
910
Pacific silver
Green
0.36
5,500
1.35
2,770
230
710
12%
10,000
1.64
5,930
520
1,190
Subalpine
Green
0.33
5,200
1.26
2,500
260
680
12%
8,200
1.48
5,280
540
980
Hemlock
Eastern
Green
0.40
6,800
1.27
3,430
400
910
12%
9,700
1.41
5,970
630
1,260
Western
Green
0.41
7,000
1.48
3,580
370
750
12%
11,800
1.79
6,770
660
940
Larch, western
Green
0.55
8,700
1.65
4,420
520
920
12%
15,500
2.08
8,840
1,060
1,340
Pine
Eastern white
Green
0.36
5,100
1.18
2,590
240
640
12%
9,500
1.36
5,230
490
880
Jack
Green
0.42
6,300
1.17
2,950
340
820
12%
11,300
1.48
5,870
830
1,190
Lodgepole
Green
0.40
5,600
1.27
2,860
280
720
12%
11,000
1.58
6,260
530
1,240
Ponderosa
Green
0.44
5,700
1.13
2,840
350
720
12%
10,600
1.38
6,130
760
1,020
Red
Green
0.39
5,000
1.07
2,370
280
710
12%
10,100
1.38
5,500
720
1,090
Western white
Green
0.36
4,800
1.19
2,520
240
650
12%
9,300
1.46
5,240
470
920
Spruce
Black
Green
0.41
5,900
1.32
2,760
300
800
12%
11,400
1.52
6,040
620
1,250
Engelmann
Green
0.38
5,700
1.25
2,810
270
700
12%
10,100
1.55
6,150
540
1,100
Red
Green
0.38
5,900
1.32
2,810
270
810
12%
10,300
1.60
5,590
550
1,330
Sitka
Green
0.35
5,400
1.37
2,560
290
630
12%
10,100
1.63
5,480
590
980
White
Green
0.35
5,100
1.15
2,470
240
670
12%
9,100
1.45
5,360
500
980
Tamarack
Green
0.48
6,800
1.24
3,130
410
920
12%
11,000
1.36
6,510
900
1,300
aResults of tests on small, clear, straight-grained specimens. Property values based on ASTM Standard D2555–88. Information on additional
properties can be obtained from Department of Forestry, Canada, Publication No. 1104. For each species, values in the first line are from
tests of green material; those in the second line are adjusted from the green condition to 12% moisture content using dry to green clear wood
property ratios as reported in ASTM D2555–88. Specific gravity is based on weight when ovendry and volume when green.
4–16
Table 4–5a. Mechanical properties of some woods imported into the United States other than Canadian
imports (metric)a
Static bending
Com-
Common and botanical
Moisture Specific
Modulus
of
rupture
Modulus
of
elasticity
Work to
maximum
load
pression
parallel
to grain
Shear
parallel
to grain
Side
hard-
ness Sample
names of species
content gravity
(kPa)
(MPa)
(kJ/m3)
(kPa)
(kPa)
(N)
originb
Afrormosia (Pericopsis elata)
Green
0.61 102,000 12,200
135
51,600 11,500
7,100
AF
12%
126,900 13,400
127
68,500 14,400
6,900
Albarco (Cariniana spp.)
Green
0.48
—
—
—
—
—
—
AM
12%
100,000 10,300
95
47,000 15,900
4,500
Andiroba (Carapa guianensis) Green
0.54
71,000 11,700
68
33,000
8,400
3,900
AM
12%
—
106,900 13,800
97
56,000 10,400
5,000
Angelin (Andira inermis)
Green
0.65
—
—
—
—
—
—
AF
12%
124,100 17,200
—
63,400 12,700
7,800
Angelique (Dicorynia
Green
0.6
78,600 12,700
83
38,500
9,200
4,900
AM
guianensis)
12%
—
120,000 15,100
105
60,500 11,400
5,700
Avodire (Turraeanthus
Green
0.48
—
—
—
—
—
—
AF
africanus)
12%
87,600 10,300
65
49,300 14,000
4,800
Azobe (Lophira alata)
Green
0.87 116,500 14,900
83
65,600 14,100 12,900
AF
12%
168,900 17,000
—
86,900 20,400 14,900
Balsa (Ochroma pyramidale)
Green
0.16
—
—
—
—
—
—
AM
12%
21,600 3,400
14
14,900
2,100
—
Banak (Virola spp.)
Green
0.42
38,600 11,300
28
16,500
5,000
1,400
AM
12%
—
75,200 14,100
69
35,400
6,800
2,300
Benge (Guibourtia arnoldiana) Green
0.65
—
—
—
—
—
—
AF
12%
147,500 14,100
—
78,600 14,400
7,800
Bubinga (Guibourtia spp.)
Green
0.71
—
—
—
—
—
—
AF
12%
155,800 17,100
—
72,400 21,400 12,000
Bulletwood (Manilkara
Green
0.85 119,300 18,600
94
59,900 13,100
9,900
AM
bidentata)
12%
188,200 23,800
197
80,300 17,200 14,200
Cativo (Prioria copaifera)
Green
0.4
40,700
6,500
37
17,000
5,900
2,000
AM
12%
—
59,300 7,700
50
29,600
7,300
2,800
Ceiba (Ceiba pentandra)
Green
0.25
15,200 2,800
8
7,300
2,400
1,000
AM
12%
29,600 3,700
19
16,400
3,800
1,100
Courbaril (Hymenaea
Green
0.71
88,900 12,700
101
40,000 12,200
8,800
AM
courbaril)
12%
—
133,800 14,900
121
65,600 17,000 10,500
Cuangare (Dialyanthera spp.) Green
0.31
27,600 7,000
—
14,300
4,100
1,000
AM
12%
50,300 10,500
—
32,800
5,700
1,700
Cypress, Mexican (Cupressus Green
0.93
42,700 6,300
—
19,900
6,600
1,500
AF
lustianica)
12%
71,000 7,000
—
37,100 10,900
2,000
Degame (Calycophyllum
Green
0.67
98,600 13,300
128
42,700 11,400
7,300
AM
candidissimum)
12%
153,800 15,700
186
66,700 14,600
8,600
Determa (Ocotea rubra)
Green
0.52
53,800 10,100
33
25,900
5,900
2,300
AM
12%
72,400 12,500
44
40,000
6,800
2,900
Ekop (Tetraberlinia
Green
0.6
—
—
—
—
—
—
AF
tubmaniana)
12%
115,100 15,200
—
62,100
—
—
Goncalo alves (Astronium
Green
0.84
83,400 13,400
46
45,400 12,100
8,500
AM
graveolens)
12%
—
114,500 15,400
72
71,200 13,500
9,600
Greenheart (Chlorocardium
Green
0.8
133,100 17,000
72
64,700 13,300
8,400
AM
rodiei)
12%
171,700 22,400
175
86,300 18,100 10,500
Hura (Hura crepitans)
Green
0.38
43,400 7,200
41
19,200
5,700
2,000
AM
12%
60,000 8,100
46
33,100
7,400
2,400
4–17
Table 4–5a. Mechanical properties of some woods imported into the United States other than Canadian
imports (metric)a—con.
Static bending
Com-
Common and botanical
Moisture Specific
Modulus
of
rupture
Modulus
of
elasticity
Work to
maximum
load
pression
parallel
to grain
Shear
parallel
to grain
Side
hard-
ness Sample
names of species
content gravity
(kPa)
(MPa)
(kJ/m3)
(kPa)
(kPa)
(N)
originb
llomba (Pycnanthus
Geen
0.4
37,900
7,900
—
20,000 5,800
2,100
AF
angolensis)
12%
68,300 11,000
—
38,300 8,900
2,700
Ipe (Tabebuia spp.,
Green
0.92 155,800 20,100
190
71,400 14,600
13,600
AM
lapacho group)
12%
175,100 21,600
152
89,700 14,200
16,400
Iroko (Chlorophora spp.)
Green
0.54
70,300 8,900
72
33,900 9,000
4,800
AF
12%
85,500 10,100
62
52,300 12,400
5,600
Jarrah (Eucalyptus marginata)
Green
0.67
68,300 10,200
—
35,800 9,100
5,700
AS
12%
—
111,700 13,000
—
61,200 14,700
8,500
Jelutong (Dyera costulata)
Green
0.36
38,600 8,000
39
21,000 5,200
1,500
AS
15%
50,300 8,100
44
27,000 5,800
1,700
Kaneelhart (Licaria spp.)
Green
0.96 153,800 26,300
94
92,300 11,600
9,800
AM
12%
206,200 28,000
121
120,000 13,600
12,900
Kapur (Dryobalanops spp.)
Green
0.64
88,300 11,000
108
42,900 8,100
4,400
AS
12%
126,200 13,000
130
69,600 13,700
5,500
Karri (Eucalyptus diversicolor)
Green
0.82
77,200 13,400
80
37,600 10,400
6,000
AS
12%
139,000 17,900
175
74,500 16,700
9,100
Kempas (Koompassia
Green
0.71 100,000 16,600
84
54,700 10,100
6,600
AS
malaccensis)
12%
122,000 18,500
106
65,600 12,300
7,600
Keruing (Dipterocarpus spp.)
Green
0.69
82,000 11,800
96
39,200 8,100
4,700
AS
12%
137,200 14,300
162
72,400 14,300
5,600
Lignumvitae (Guaiacum spp.)
Green
1.05
—
—
—
—
—
—
AM
12%
—
—
—
—
78,600
—
20,000
Limba (Terminalia superba)
Green
0.38
41,400 5,300
53
19,200
600
1,800
AF
12%
60,700 7,000
61
32,600 9,700
2,200
Macawood (Platymiscium spp.) Green
0.94 153,800 20,800
—
72,700 12,700
14,800
AM
12%
190,300 22,100
—
111,000 17,500
14000
Mahogany, African
Green
0.42
51,000 7,900
49
25,700 6,400
2,800
AF
(Khaya spp.)
12%
73,800 9,700
57
44,500 10,300
3,700
Mahogany, true
Green
0.45
62,100 9,200
63
29,900 8,500
3,300
AM
(Swietenia macrophylla)
12%
—
79,300 10,300
52
46,700 8,500
3,600
Manbarklak (Eschweilera spp.)
Green
0.87 117,900 18,600
120
50,600 11,200
10,100
AM
12%
182,700 21,600
230
77,300 14,300
15,500
Manni (Symphonia globulifera)
Green
0.58
77,200 13,500
77
35,600 7,900
4,200
AM
12%
116,500 17,000
114
60,800 9,800
5,000
Marishballi (Lincania spp.)
Green
0.88 117,900 20,200
92
52,300 11,200
10,000
AM
12%
191,000 23,000
98
92,300 12,100
15,900
Merbau (Intsia spp.)
Green
0.64
88,900 13,900
88
46,700 10,800
6,100
AS
15%
—
115,800 15,400
102
58,200 12,500
6,700
Mersawa (Anisoptera spp.)
Green
0.52
55,200 12,200
—
27,300 5,100
3,900
AS
12%
95,100 15,700
—
50,800 6,100
5,700
Mora (Mora spp.)
Green
0.78
86,900 16,100
93
44,100 9,700
6,400
AM
12%
152,400 20,400
128
81,600 13,100
10,200
Oak (Quercus spp.)
Green
0.76
—
—
—
—
—
—
AM
12%
158,600 20,800
114
—
—
11,100
Obeche (Triplochiton
Green
0.3
35,200
5,000
43
17,700 4,600
1,900
AF
scleroxylon)
12%
51,000 5,900
48
27,100 6,800
1,900
4–18
Table 4–5a. Mechanical properties of some woods imported into the United States other than Canadian
imports (metric)a—con.
Static bending
Com-
Common and botanical
Moisture Specific
Modulus
of
rupture
Modulus
of
elasticity
Work to
maximum
load
pression
parallel
to grain
Shear
parallel
to grain
Side
hard-
ness Sample
names of species
content gravity
(kPa)
(MPa)
(kJ/m3)
(kPa)
(kPa)
(N)
originb
Okoume (Aucoumea
Green
0.33
—
—
—
—
—
—
AF
klaineana)
12%
51,000
7,900
—
27,400
6,700
1,700
Opepe (Nauclea diderrichii)
Green
0.63
93,800 11,900
84
51,600 13,100
6,800
AF
12%
120,000 13,400
99
71,700 17,100
7,300
Ovangkol (Guibourtia ehie)
Green
0.67
—
—
—
—
—
—
AF
12%
116,500 17,700
—
57,200
—
—
Para-angelim (Hymenolobium
Green
0.63 100,700 13,400
88
51,400 11,000
7,700
AM
excelsum)
12%
121,300 14,100
110
62,000 13,900
7,700
Parana-pine (Araucaria
Green
0.46
49,600
9,300
67
27,600
6,700
2,500
AM
augustifolia)
12%
—
93,100 11,100
84
52,800 11,900
3,500
Pau marfim (Balfourodendron
Green
0.73
99,300 11,400
—
41,900
—
—
AM
riedelianum)
15%
130,300
—
—
56,500
—
—
Peroba de campos
Green
0.62
—
—
—
—
—
—
AM
(Paratecoma peroba)
12%
106,200 12,200
70
61,200 14,700
7,100
Peroba rosa (Aspidosperma
Green
0.66
75,200
8,900
72
38,200 13,000
7,000
AM
spp., peroba group)
12%
83,400 10,500
63
54,600 17,200
7,700
Pilon (Hyeronima spp.)
Green
0.65
73,800 13,000
57
34,200
8,300
5,400
AM
12%
125,500 15,700
83
66,300 11,900
7,600
Pine, Caribbean (Pinus
Green
0.68
77,200 13,000
74
33,800
8,100
4,400
AM
caribaea)
12%
—
115,100 15,400
119
58,900 14,400
5,500
Pine, ocote (Pinus oocarpa)
Green
0.55
55,200 12,000
48
25,400
7,200
2,600
AM
12%
—
102,700 15,500
75
53,000 11,900
4,000
Pine, radiata (Pinus radiata)
Green
0.42
42,100
8,100
—
19,200
5,200
2,100
AS
12%
—
80,700 10,200
—
41,900 11,000
3,300
Piquia (Caryocar spp.)
Green
0.72
85,500 12,500
58
43,400 11,300
7,700
AM
12%
117,200 14,900
109
58,000 13,700
7,700
Primavera (Tabebuia
Green
0.4
49,600
6,800
50
24,200
7,100
3,100
AM
donnell–smithii)
12%
65,500
7,200
44
38,600
9,600
2,900
Purpleheart (Peltogyne spp.)
Green
0.67
9,400 13,800
102
48,400 11,300
8,100
AM
12%
132,400 15,700
121
71,200 15,300
8,300
Ramin (Gonystylus bancanus) Green
0.52
67,600 10,800
62
37,200
6,800
2,800
AS
12%
—
127,600 15,000
117
69,500 10,500
5,800
Robe (Tabebuia spp.,
Green
0.52
74,500 10,000
81
33,900
8,600
4,000
AM
roble group)
12%
95,100 11,000
86
50,600 10,000
4,300
Rosewood, Brazilian
Green
0.8
97,200 12,700
91
38,000 16,300 10,900
AM
(Dalbergia nigra)
12%
—
131,000 13,000
—
66,200 14,500 12,100
Rosewood, Indian (Dalbergia
Green
0.75
63,400
8,200
80
31,200
9,700
6,900
AS
latifolia)
12%
116,500 12,300
90
63,600 14,400 14,100
Sande (Brosimum spp.,
Green
0.49
58,600 13,400
—
31,000
7,200
2,700
AM
utile group)
12%
98,600 16,500
—
56,700
8,900
4,000
Santa Maria (Calophyllum
Green
0.52
72,400 11,000
88
31,400
8,700
4,000
AM
brasiliense)
12%
—
100,700 12,600
111
47,600 14,300
5,100
Sapele (Entandrophragma
Green
0.55
70,300 10,300
72
34,500
8,600
4,500
AF
cylindricum)
12%
—
105,500 12,500
108
56,300 15,600
6,700
Sepetir (Pseudosindora
Green
0.56
77,200 10,800
92
37,600
9,000
4,200
AS
palustris)
12%
118,600 13,600
92
61,200 14,000
6,300
4–19
Table 4–5a. Mechanical properties of some woods imported into the United States other than Canadian
imports (metric)a—con.
Static bending
Com-
Common and botanical
Moisture Specific
Modulus
of
rupture
Modulus
of
elasticity
Work to
maximum
load
pression
parallel
to grain
Shear
parallel
to grain
Side
hard-
ness Sample
names of species
content gravity
(kPa)
(MPa)
(kJ/m3)
(kPa)
(kPa)
(N)
originb
Shorea (Shorea spp.,
Green
0.68
80,700 14,500
—
37,100
9,900
6,000
AS
baulau group)
12%
129,600 18,000
—
70,200 15,100
7,900
Shorea, lauan–meranti group
Dark red meranti
Green
0.46
64,800 10,300
59
32,500
7,700
3,100
AS
12%
87,600 12,200
95
50,700 10,000
3,500
Light red meranti
Green
0.34
45,500 7,200
43
23,000
4,900
2,000
AS
12%
65,500 8,500
59
40,800
6,700
2,000
White meranti
Green
0.55
67,600 9,000
57
37,900
9,100
4,400
AS
15%
85,500 10,300
79
43,800 10,600
5,100
Yellow meranti
Green
0.46
55,200 9,000
56
26,800
7,100
3,300
AS
12%
78,600 10,700
70
40,700 10,500
3,400
Spanish-cedar (Cedrela spp.)
Green
0.41
51,700 9,000
49
23,200
6,800
2,400
AM
12%
—
79,300 9,900
65
42,800
7,600
2,700
Sucupira (Bowdichia spp.)
Green
0.74 118,600 15,700
—
67,100
—
—
AM
15%
133,800
—
—
76,500
—
—
Sucupira (Diplotropis purpurea) Green
0.78 120,000 18,500
90
55,300 12,400
8,800
AM
12%
142,000 19,800
102
83,700 13,500
9,500
Teak (Tectona grandis)
Green
0.55
80,000 9,400
92
41,100
8,900
4,100
AS
12%
100,700 10,700
83
58,000 13,000
4,400
Tornillo (Cedrelinga
Green
0.45
57,900
—
—
28,300
8,100
3,900
AM
cateniformis)
12%
—
—
—
—
—
—
—
Wallaba (Eperua spp.)
Green
0.78
98,600 16,100
—
55,400
—
6,900
AM
12%
—
131,700 15,700
—
74,200
—
9,100
aResults of tests on small, clear, straight-grained specimens. Property values were taken from world literature
(not obtained from experiments conducted at the Forest Products Laboratory). Other species may be reported
in the world literature, as well as additional data on many of these species. Some property values have been
adjusted to 12% moisture content.
bAF is Africa; AM, America; AS, Asia.
4–20
Table 4–5b. Mechanical properties of some woods imported into the United States other than Canadian imports
(inch–pound)a
Static bending
Com-
Common and botanical
Moisture Specific
Modulus
of
rupture
Modulus
of
elasticity
Work to
maximum
load
pression
parallel
to grain
Shear
parallel
to grain
Side
hard-
ness Sample
names of species
content gravity (lbf/in2) (×106 lbf/in2) (in-lbf/in3) (lbf/in2) (lbf/in2) (lbf)
originb
Afrormosia (Pericopsis elata)
Green
0.61 14,800
1.77
19.5
7,490
1,670 1,600
AF
12%
18,400
1.94
18.4
9,940
2,090 1,560
Albarco (Cariniana spp.)
Green
0.48
—
—
—
—
—
—
AM
12%
14,500
1.5
13.8
6,820
2,310 1,020
Andiroba (Carapa guianensis)
Green
0.54 10,300
1.69
9.8
4,780
1,220
880
AM
12%
—
15,500
2
14
8,120
1,510 1,130
Angelin (Andira inermis)
Green
0.65
—
—
—
—
—
—
AF
12%
18,000
2.49
—
9,200
1,840 1,750
Angelique (Dicorynia
Green
0.6
11,400
1.84
12
5,590
1,340 1,100
AM
guianensis)
12%
—
17,400
2.19
15.2
8,770
1,660 1,290
Avodire (Turraeanthus
Green
0.48
—
—
—
—
—
—
AF
africanus)
12%
12,700
1.49
9.4
7,150
2,030 1,080
Azobe (Lophira alata)
Green
0.87 16,900
2.16
12
9,520
2,040 2,890
AF
12%
24,500
2.47
—
12,600
2,960 3,350
Balsa (Ochroma pyramidale)
Green
0.16
—
—
—
—
—
—
AM
12%
3,140
0.49
2.1
2,160
300
—
Banak (Virola spp.)
Green
0.42
5,600
1.64
4.1
2,390
720
320
AM
12%
—
10,900
2.04
10
5,140
980
510
Benge (Guibourtia arnoldiana)
Green
0.65
—
—
—
—
—
—
AF
12%
21,400
2.04
—
11,400
2,090 1,750
Bubinga (Guibourtia spp.)
Green
0.71
—
—
—
—
—
—
AF
12%
22,600
2.48
—
10,500
3,110 2,690
Bulletwood (Manilkara
Green
0.85 17,300
2.7
13.6
8,690
1,900 2,230
AM
bidentata)
12%
27,300
3.45
28.5
11,640
2,500 3,190
Cativo (Prioria copaifera)
Green
0.4
5,900
0.94
5.4
2,460
860
440
AM
12%
—
8,600
1.11
7.2
4,290
1,060
630
Ceiba (Ceiba pentandra)
Green
0.25
2,200
0.41
1.2
1,060
350
220
AM
12%
4,300
0.54
2.8
2,380
550
240
Courbaril (Hymenaea
Green
0.71 12,900
1.84
14.6
5,800
1,770 1,970
AM
courbaril)
12%
—
19,400
2.16
17.6
9,510
2,470 2,350
Cuangare (Dialyanthera spp.)
Green
0.31
4,000
1.01
—
2,080
590
230
AM
12%
7,300
1.52
—
4,760
830
380
Cypress, Mexican (Cupressus
Green
0.93
6,200
0.92
—
2,880
950
340
AF
lustianica)
12%
10,300
1.02
—
5,380
1,580
460
Degame (Calycophyllum
Green
0.67 14,300
1.93
18.6
6,200
1,660 1,630
AM
candidissimum)
12%
22,300
2.27
27
9,670
2,120 1,940
Determa (Ocotea rubra)
Green
0.52
7,800
1.46
4.8
3,760
860
520
AM
12%
10,500
1.82
6.4
5,800
980
660
Ekop (Tetraberlinia
Green
0.6
—
—
—
—
—
—
AF
tubmaniana)
12%
16,700
2.21
—
9,010
—
—
Goncalo alves (Astronium
Green
0.84 12,100
1.94
6.7
6,580
1,760 1,910
AM
graveolens)
12%
—
16,600
2.23
10.4
10,320
1,960 2,160
Greenheart (Chlorocardium rodiei) Green
0.8
19,300
2.47
10.5
9,380
1,930 1,880
AM
12%
24,900
3.25
25.3
12,510
2,620 2,350
Hura (Hura crepitans)
Green
0.38
6,300
1.04
5.9
2,790
830
440
AM
12%
8,700
1.17
6.7
4,800
1,080
550
4–21
Table 4–5b. Mechanical properties of some woods imported into the United States other than Canadian imports
(inch–pound)a—con.
Static bending
Com-
Common and botanical
Moisture Specific
Modulus
of
rupture
Modulus
of
elasticity
Work to
maximum
load
pression
parallel
to grain
Shear
parallel
to grain
Side
hard-
ness Sample
names of species
content gravity (lbf/in2) (×106 lbf/in2) (in-lbf/in3) (lbf/in2) (lbf/in2) (lbf) originb
llomba (Pycnanthus
Geen
0.4
5,500
1.14
—
2,900
840
470 AF
angolensis)
12%
9,900
1.59
—
5,550
1,290
610
Ipe (Tabebuia spp.,
Green
0.92 22,600
2.92
27.6
10,350
2,120 3,060 AM
lapacho group)
12%
25,400
3.14
22
13,010
2,060 3,680
Iroko (Chlorophora spp.)
Green
0.54 10,200
1.29
10.5
4,910
1,310 1,080 AF
12%
12,400
1.46
9
7,590
1,800 1,260
Jarrah (Eucalyptus marginata)
Green
0.67
9,900
1.48
—
5,190
1,320 1,290 AS
12%
—
16,200
1.88
—
8,870
2,130 1,910
Jelutong (Dyera costulata)
Green
0.36
5,600
1.16
5.6
3,050
760
330 AS
15%
7,300
1.18
6.4
3,920
840
390
Kaneelhart (Licaria spp.)
Green
0.96 22,300
3.82
13.6
13,390
1,680 2,210 AM
12%
29,900
4.06
17.5
17,400
1,970 2,900
Kapur (Dryobalanops spp.)
Green
0.64 12,800
1.6
15.7
6,220
1,170
980 AS
12%
18,300
1.88
18.8
10,090
1,990 1,230
Karri (Eucalyptus diversicolor)
Green
0.82 11,200
1.94
11.6
5,450
1,510 1,360 AS
12%
20,160
2.6
25.4
10,800
2,420 2,040
Kempas (Koompassia
Green
0.71 14,500
2.41
12.2
7,930
1,460 1,480 AS
malaccensis)
12%
17,700
2.69
15.3
9,520
1,790 1,710
Keruing (Dipterocarpus spp.)
Green
0.69 11,900
1.71
13.9
5,680
1,170 1,060 AS
12%
19,900
2.07
23.5
10,500
2,070 1,270
Lignumvitae (Guaiacum spp.)
Green
1.05
—
—
—
—
—
—
AM
12%
—
—
—
—
11,400
—
4,500
Limba (Terminalia superba)
Green
0.38
6,000
0.77
7.7
2,780
88
400 AF
12%
8,800
1.01
8.9
4,730
1,410
490
Macawood (Platymiscium spp.)
Green
0.94 22,300
3.02
—
10,540
1,840 3,320 AM
12%
27,600
3.2
—
16,100
2,540 3,150
Mahogany, African (Khaya spp.)
Green
0.42
7,400
1.15
7.1
3,730
931
640 AF
12%
10,700
1.4
8.3
6,460
1,500
830
Mahogany, true
Green
0.45
9,000
1.34
9.1
4,340
1,240
740 AM
(Swietenia macrophylla)
12%
—
11,500
1.5
7.5
6,780
1,230
800
Manbarklak (Eschweilera spp.)
Green
0.87 17,100
2.7
17.4
7,340
1,630 2,280 AM
12%
26,500
3.14
33.3
11,210
2,070 3,480
Manni (Symphonia globulifera)
Green
0.58 11,200
1.96
11.2
5,160
1,140
940 AM
12%
16,900
2.46
16.5
8,820
1,420 1,120
Marishballi (Lincania spp.)
Green
0.88 17,100
2.93
13.4
7,580
1,620 2,250 AM
12%
27,700
3.34
14.2
13,390
1,750 3,570
Merbau (Intsia spp.)
Green
0.64 12,900
2.02
12.8
6,770
1,560 1,380 AS
15%
—
16,800
2.23
14.8
8,440
1,810 1,500
Mersawa (Anisoptera spp.)
Green
0.52
8,000
1.77
—
3,960
740
880 AS
12%
13,800
2.28
—
7,370
890 1,290
Mora (Mora spp.)
Green
0.78 12,600
2.33
13.5
6,400
1,400 1,450 AM
12%
22,100
2.96
18.5
11,840
1,900 2,300
Oak (Quercus spp.)
Green
0.76
—
—
—
—
—
—
AM
12%
23,000
3.02
16.5
—
—
2,500
Obeche (Triplochiton
Green
0.3
5,100
0.72
6.2
2,570
660
420 AF
scleroxylon)
12%
7,400
0.86
6.9
3,930
990
430
4–22
Table 4–5b. Mechanical properties of some woods imported into the United States other than Canadian imports
(inch–pound)a—con.
Static bending
Com-
Common and botanical
Moisture Specific
Modulus
of
rupture
Modulus
of
elasticity
Work to
maximum
load
pression
para to
grain llel
Shear
parallel
to grain
Side
hard-
ness Sample
names of species
content gravity (lbf/in2) (×106 lbf/in2) (in-lbf/in3) (lbf/in2) (lbf/in2) (lbf)
originb
Okoume (Aucoumea
Green
0.33
—
—
—
—
—
—
AF
klaineana)
12%
7,400
1.14
—
3,970
970
380
Opepe (Nauclea diderrichii)
Green
0.63 13,600
1.73
12.2
7,480
1,900 1,520
AF
12%
17,400
1.94
14.4
10,400
2,480 1,630
Ovangkol (Guibourtia ehie)
Green
0.67
—
—
—
—
—
—
AF
12%
16,900
2.56
—
8,300
—
—
Para-angelim (Hymenolobium
Green
0.63 14,600
1.95
12.8
7,460
1,600 1,720
AM
excelsum)
12%
17,600
2.05
15.9
8,990
2,010 1,720
Parana-pine (Araucaria
Green
0.46
7,200
1.35
9.7
4,010
970
560
AM
augustifolia)
12%
—
13,500
1.61
12.2
7,660
1,730
780
Pau marfim (Balfourodendron
Green
0.73 14,400
1.66
—
6,070
—
—
AM
riedelianum)
15%
18,900
—
—
8,190
—
—
Peroba de campos
Green
0.62
—
—
—
—
—
—
AM
(Paratecoma peroba)
12%
15,400
1.77
10.1
8,880
2,130 1,600
Peroba rosa (Aspidosperma
Green
0.66 10,900
1.29
10.5
5,540
1,880 1,580
AM
spp., peroba group)
12%
12,100
1.53
9.2
7,920
2,490 1,730
Pilon (Hyeronima spp.)
Green
0.65 10,700
1.88
8.3
4,960
1,200 1,220
AM
12%
18,200
2.27
12.1
9,620
1,720 1,700
Pine, Caribbean (Pinus caribaea) Green
0.68 11,200
1.88
10.7
4,900
1,170
980
AM
12%
—
16,700
2.24
17.3
8,540
2,090 1,240
Pine, ocote (Pinus oocarpa)
Green
0.55
8,000
1.74
6.9
3,690
1,040
580
AM
12%
—
14,900
2.25
10.9
7,680
1,720
910
Pine, radiata (Pinus radiata)
Green
0.42
6,100
1.18
—
2,790
750
480
AS
12%
—
11,700
1.48
—
6,080
1,600
750
Piquia (Caryocar spp.)
Green
0.72 12,400
1.82
8.4
6,290
1,640 1,720
AM
12%
17,000
2.16
15.8
8,410
1,990 1,720
Primavera (Tabebuia
Green
0.4
7,200
0.99
7.2
3,510
1,030
700
AM
donnell–smithii)
12%
9,500
1.04
6.4
5,600
1,390
660
Purpleheart (Peltogyne spp.)
Green
0.67
1,370
2
14.8
7,020
1,640 1,810
AM
12%
19,200
2.27
17.6
10,320
2,220 1,860
Ramin (Gonystylus bancanus)
Green
0.52
9,800
1.57
9
5,390
990
640
AS
12%
—
18,500
2.17
17
10,080
1,520 1,300
Robe (Tabebuia spp.,
Green
0.52 10,800
1.45
11.7
4,910
1,250
910
AM
roble group)
12%
13,800
1.6
12.5
7,340
1,450
960
Rosewood, Brazilian
Green
0.8
14,100
1.84
13.2
5,510
2,360 2,440
AM
(Dalbergia nigra)
12%
—
19,000
1.88
—
9,600
2,110 2,720
Rosewood, Indian (Dalbergia
Green
0.75
9,200
1.19
11.6
4,530
1,400 1,560
AS
latifolia)
12%
16,900
1.78
13.1
9,220
2,090 3,170
Sande (Brosimum spp.,
Green
0.49
8,500
1.94
—
4,490
1,040
600
AM
utile group)
12%
14,300
2.39
—
8,220
1,290
900
Santa Maria (Calophyllum
Green
0.52 10,500
1.59
12.7
4,560
1,260
890
AM
brasiliense)
12%
—
14,600
1.83
16.1
6,910
2,080 1,150
Sapele (Entandrophragma
Green
0.55 10,200
1.49
10.5
5,010
1,250 1,020
AF
cylindricum)
12%
—
15,300
1.82
15.7
8,160
2,260 1,510
Sepetir (Pseudosindora palustris) Green
0.56 11,200
1.57
13.3
5,460
1,310
950
AS
12%
17,200
1.97
13.3
8,880
2,030 1,410
4–23
Table 4–5b. Mechanical properties of some woods imported into the United States other than Canadian imports
(inch–pound)a—con.
Static bending
Com-
Common and botanical
Moisture Specific
Modulus
of
rupture
Modulus
of
elasticity
Work to
maximum
load
pression
parallel
to grain
Shear
parallel
to grain
Side
hard-
ness Sample
names of species
content gravity (lbf/in2) (×106 lbf/in2) (in-lbf/in3) (lbf/in2) (lbf/in2) (lbf)
originb
Shorea (Shorea spp.,
Green
0.68 11,700
2.1
—
5,380
1,440 1,350
AS
bullau group)
12%
18,800
2.61
—
10,180
2,190 1,780
Shorea, lauan–meranti group
Dark red meranti
Green
0.46
9,400
1.5
8.6
4,720
1,110
700
AS
12%
12,700
1.77
13.8
7,360
1,450
780
Light red meranti
Green
0.34
6,600
1.04
6.2
3,330
710
440
AS
12%
9,500
1.23
8.6
5,920
970
460
White meranti
Green
0.55
9,800
1.3
8.3
5,490
1,320 1,000
AS
15%
12,400
1.49
11.4
6,350
1,540 1,140
Yellow meranti
Green
0.46
8,000
1.3
8.1
3,880
1,030
750
AS
12%
11,400
1.55
10.1
5,900
1,520
770
Spanish-cedar (Cedrela spp.)
Green
0.41
7,500
1.31
7.1
3,370
990
550
AM
12%
—
11,500
1.44
9.4
6,210
1,100
600
Sucupira (Bowdichia spp.)
Green
0.74 17,200
2.27
—
9,730
—
—
AM
15%
19,400
—
—
11,100
—
—
Sucupira (Diplotropis purpurea)
Green
0.78 17,400
2.68
13
8,020
1,800 1,980
AM
12%
20,600
2.87
14.8
12,140
1,960 2,140
Teak (Tectona grandis)
Green
0.55 11,600
1.37
13.4
5,960
1,290
930
AS
12%
14,600
1.55
12
8,410
1,890 1,000
Tornillo (Cedrelinga
Green
0.45
8,400
—
—
4,100
1,170
870
AM
cateniformis)
12%
—
—
—
—
—
—
—
Wallaba (Eperua spp.)
Green
0.78 14,300
2.33
—
8,040
—
1,540
AM
12%
—
19,100
2.28
—
10,760
—
2,040
aResults of tests on small, clear, straight-grained specimens. Property values were taken from world literature
(not obtained from experiments conducted at the Forest Products Laboratory). Other species may be reported
in the world literature, as well as additional data on many of these species. Some property values have been
adjusted to 12% moisture content.
bAF is Africa; AM, America; AS, Asia.
Table 4–6. Average coefficients of variation for some mechanical properties
of clear wood
Coefficient of variationa
Property
(%)
Static bending
Modulus of rupture
16
Modulus of elasticity
22
Work to maximum load
34
Impact bending
25
Compression parallel to grain
18
Compression perpendicular to grain
28
Shear parallel to grain, maximum shearing strength
14
Tension parallel to grain
25
Side hardness
20
Toughness
34
Specific gravity
10
aValues based on results of tests of green wood from approximately 50 species.
Values for wood adjusted to 12% moisture content may be assumed to be
approximately of the same magnitude.
4–24
Less Common Properties
Strength properties less commonly measured in clear wood
include torsion, toughness, rolling shear, and fracture tough-
ness. Other properties involving time under load include
creep, creep rupture or duration of load, and fatigue strength.
Torsion strength—Resistance to twisting about a longi-
tudinal axis. For solid wood members, torsional shear
strength may be taken as shear strength parallel to grain.
Two-thirds of the value for torsional shear strength may be
used as an estimate of the torsional shear stress at the pro-
portional limit.
Toughness—Energy required to cause rapid complete
failure in a centrally loaded bending specimen. Tables 4–8
and 4–9 give average toughness values for samples of a few
hardwood and softwood species. Average coefficients of
variation for toughness as determined from approximately
50 species are shown in Table 4–6.
Creep and duration of load—Time-dependent deforma-
tion of wood under load. If the load is sufficiently high and
the duration of load is long, failure (creep–rupture) will
eventually occur. The time required to reach rupture is
commonly called duration of load. Duration of load is an
important factor in setting design values for wood. Creep
and duration of load are described in later sections of this
chapter.
Fatigue—Resistance to failure under specific combinations
of cyclic loading conditions: frequency and number of
cycles, maximum stress, ratio of maximum to minimum
stress, and other less-important factors. The main factors
affecting fatigue in wood are discussed later in this chapter.
The discussion also includes interpretation of fatigue data
and information on fatigue as a function of the service
environment.
Rolling shear strength—Shear strength of wood where
shearing force is in a longitudinal plane and is acting per-
pendicular to the grain. Few test values of rolling shear in
solid wood have been reported. In limited tests, rolling
shear strength averaged 18% to 28% of parallel-to-grain
shear values. Rolling shear strength is about the same in
the longitudinal–radial and longitudinal–tangential planes.
Fracture toughness—Ability of wood to withstand flaws
that initiate failure. Measurement of fracture toughness
helps identify the length of critical flaws that initiate failure
in materials.
To date there is no standard test method for determining
fracture toughness in wood. Three types of stress fields, and
associated stress intensity factors, can be defined at a crack
tip: opening mode (I), forward shear mode (II), and transverse
shear mode (III) (Fig. 4–2a). A crack may lie in one of these
Table 4–7. Average parallel-to-grain tensile strength of
some wood speciesa
Tensile strength
Species
(kPa (lb/in2))
Hardwoods
Beech, American
86,200
(12,500)
Elm, cedar
120,700
(17,500)
Maple, sugar
108,200
(15,700)
Oak
Overcup
77,900
(11,300)
Pin
112,400
(16,300)
Poplar, balsam
51,000
(7,400)
Sweetgum
93,800
(13,600)
Willow, black
73,100
(10,600)
Yellow-poplar
109,600
(15,900)
Softwoods
Baldcypress
58,600
(8,500)
Cedar
Port-Orford
78,600
(11,400)
Western redcedar
45,500
(6,600)
Douglas-fir, interior north
107,600
(15,600)
Fir
California red
77,900
(11,300)
Pacific silver
95,100
(13,800)
Hemlock, western
89,600
(13,000)
Larch, western
111,700
(16,200)
Pine
Eastern white
73,100
(10,600)
Loblolly
80,000
(11,600)
Ponderosa
57,900
(8,400)
Virginia
94,500
(13,700)
Redwood
Virgin
64,800
(9,400)
Young growth
62,700
(9,100)
Spruce
Engelmann
84,800
(12,300)
Sitka
59,300
(8,600)
aResults of tests on small, clear, straight-grained specimens tested
green. For hardwood species, strength of specimens tested at
12% moisture content averages about 32% higher; for softwoods,
about 13% higher.
Table 4–8. Average toughness values for a few hardwood
speciesa
Toughness
Moisture Specific
Radial
Tangential
Species
content gravity
(J (in-lbf))
(J (in-lbf))
Birch, yellow
12%
0.65
8,100 (500)
10,100 (620)
Hickory (mocker-
Green
0.64
11,400 (700)
11,700 (720)
nut, pignut, sand)
12%
0.71
10,100 (620)
10,700 (660)
Maple, sugar
14%
0.64
6,000 (370)
5,900 (360)
Oak, red
Pin
12%
0.64
7,000 (430)
7,000 (430)
Scarlet
11%
0.66
8,300 (510)
7,200 (440)
Oak, white
Overcup
Green
0.56
11,900 (730)
11,100 (680)
13%
0.62
5,500 (340)
5,000 (310)
Sweetgum
Green
0.48
5,500 (340)
5,400 (330)
13%
0.51
4,200 (260)
4,200 (260)
Willow, black
Green
0.38
5,000 (310)
5,900 (360)
11%
0.4
3,400 (210)
3,700 (230)
Yellow-poplar
Green
0.43
5,200 (320)
4,900 (300)
12%
0.45
3,600 (220)
3,400 (210)
4–25
three planes and may propagate in one of two directions in
each plane. This gives rise to six crack-propagation systems
(RL, TL, LR, TR, LT, and RT) (Fig. 4–2b). Of these crack-
propagation systems, four systems are of practical impor-
tance: RL, TL, TR, and RT. Each of these four systems allow
for propagation of a crack along the lower strength path
parallel to the grain. The RL and TL orientations in wood
(where R or T is perpendicular to the crack plane and L is the
direction in which the crack propagates) will predominate as
a result of the low strength and stiffness of wood perpendicu-
lar to the grain. It is therefore one of these two orientations
that is most often tested. Values for Mode I fracture
toughness range from 220 to 550 kPa m (200 to
500 lbf in in
/
.
2
) and for Mode II range from 1,650 to
2,400 kPa m (1,500 to 2,200 lbf in in
/
.
2
). Table 4–10
summarizes selected mode I and mode II test results at 10%
to 12% moisture content available in the literature. The
limited information available on moisture content effects on
fracture toughness suggests that fracture toughness is either
insensitive to moisture content or increases as the material
dries, reaching a maximum between 6% and 15% moisture
content; fracture toughness then decreases with further drying.
Vibration Properties
The vibration properties of primary interest in structural
materials are speed of sound and internal friction (damping
capacity).
Speed of Sound
The speed of sound in a structural material is a function of
the modulus of elasticity and density. In wood, the speed of
sound also varies with grain direction because the transverse
modulus of elasticity is much less than the longitudinal
value (as little as 1/20); the speed of sound across the grain
is about one-fifth to one-third of the longitudinal value.
For example, a piece of wood with a longitudinal modulus
of elasticity of 12.4 GPa (1.8 × 10⁶ lbf/in2) and density of
Table 4–9. Average toughness values for a few softwood
speciesa
Toughness
Moisture Specific
Radial
Tangential
Species
content gravity
(J (in-lbf))
(J (in-lbf))
Cedar
Western red
9%
0.33
1,500 (90) 2,100 (130)
Yellow
10%
0.48
3,400 (210) 3,700 (230)
Douglas-fir
Coast
Green
12%
0.44
0.47
3,400
3,300
(210)
(200)
5,900
5,900
(360)
(360)
Interior west
Green
13%
0.48
0.51
3,300
3,400
(200)
(210)
4,900
5,500
(300)
(340)
Interior north
Green
14%
0.43
0.46
2,800
2,600
(170)
(160)
3,900
4,100
(240)
(250)
Interior south
Green
14%
0.38
0.4
2,100
2,000
(130)
(120)
2,900
2,900
(180)
(180)
Fir
California red
Green
12%
0.36
0.39
2,100
2,000
(130)
(120)
2,900
2,800
(180)
(170)
Noble
Green
0.36
—
—
3,900 (240)
12%
0.39
—
—
3,600 (220)
Pacific silver
Green
0.37
2,400 (150) 3,700 (230)
13%
0.4
2,800 (170) 4,200 (260)
White
Green
0.36
2,300 (140) 3,600 (220)
13%
0.38
2,100 (130) 3,300 (200)
Hemlock
Mountain
Green
0.41 4,100 (250) 4,600 (280)
14%
0.44 2,300 (140) 2,800 (170)
Western
Green
0.38 2,400 (150) 2,800 (170)
12%
0.41 2,300 (140) 3,400 (210)
Larch, western
Green
0.51 4,400 (270) 6,500 (400)
12%
0.55 3,400 (210) 5,500 (340)
Pine
Eastern white
Green
0.33 2,000 (120) 2,600 (160)
12%
0.34 1,800 (110) 2,000 (120)
Jack
Green
0.41 3,300 (200) 6,200 (380)
12%
0.42 2,300 (140) 3,900 (240)
Loblolly
Green
0.48 5,000 (310) 6,200 (380)
12%
0.51 2,600 (160) 4,200 (260)
Lodgepole
Green
0.38 2,600 (160) 3,400 (210)
Ponderosa
Green
0.38 3,100 (190) 4,400 (270)
11%
0.43 2,400 (150) 3,100 (190)
Red
Green
0.4
3,400 (210) 5,700 (350)
12%
0.43 2,600 (160) 4,700 (290)
Shortleaf
Green
0.47 4,700 (290) 6,500 (400)
13%
0.5
2,400 (150) 3,700 (230)
Slash
Green
0.55 5,700 (350) 7,300 (450)
12%
0.59 3,400 (210) 5,200 (320)
Virginia
Green
0.45 5,500 (340) 7,600 (470)
12%
0.49 2,800 (170) 4,100 (250)
Redwood
Old-growth
Green
0.39 1,800
(110) 3,300 (200)
11%
0.39 1,500
(90) 2,300 (140)
Young-growth
Green
0.33 1,800
(110) 2,300 (140)
12%
0.34 1,500
(90) 1,800 (110)
Spruce,
Green
0.34 2,400
(150) 3,100 (190)
Engelmann
12%
0.35 1,800
(110) 2,900 (180)
aResults of tests on small, clear, straight-grained specimens.
Figure 4–2. Possible crack propagation systems for
wood.
4–26
480 kg/m3 (30 lb/ft3) would have a speed of sound in the
longitudinal direction of about 3,800 m/s (12,500 ft/s).
In the transverse direction, modulus of elasticity would be
about 690 MPa (100 × 103 lbf/in2) and the speed of sound
approximately 890 m/s (2,900 ft/s).
The speed of sound decreases with increasing temperature or
moisture content in proportion to the influence of these
variables on modulus of elasticity and density. The speed of
sound decreases slightly with increasing frequency and am-
plitude of vibration, although for most common applications
this effect is too small to be significant. There is no recog-
nized independent effect of species on the speed of sound.
Variability in the speed of sound in wood is directly related
to the variability of modulus of elasticity and density.
Internal Friction
When solid material is strained, some mechanical energy is
dissipated as heat. Internal friction is the term used to denote
the mechanism that causes this energy dissipation. The
internal friction mechanism in wood is a complex function of
temperature and moisture content. In general, there is a value
of moisture content at which internal friction is minimum.
On either side of this minimum, internal friction increases as
moisture content varies down to zero or up to the fiber satu-
ration point. The moisture content at which minimum inter-
nal friction occurs varies with temperature. At room tempera-
ture (23ºC (73ºF)), the minimum occurs at about 6%
moisture content; at −20ºC (−4ºF), it occurs at about 14%
moisture content, and at 70ºC (158ºF), at about 4%. At
90ºC (194ºF), the minimum is not well defined and occurs
near zero moisture content.
Similarly, there are temperatures at which internal friction is
minimum, and the temperatures of minimum internal friction
vary with moisture content. The temperatures of minimum
internal friction are higher as the moisture content is de-
creased. For temperatures above 0ºC (32ºF) and moisture
content greater than about 10%, internal friction increases
strongly as temperature increases, with a strong positive
interaction with moisture content. For very dry wood, there
is a general tendency for internal friction to decrease as the
temperature increases.
The value of internal friction, expressed by logarithmic
decrement, ranges from about 0.1 for hot, moist wood to less
than 0.02 for hot, dry wood. Cool wood, regardless of mois-
ture content, would have an intermediate value.
Mechanical Properties of
Clear Straight-Grained Wood
The mechanical properties listed in Table 4–1 through
Table 4–9 are based on a variety of sampling methods.
Generally, the most extensive sampling is represented in
Tables 4–3 and 4–4. The values in Table 4–3 are averages
derived for a number of species grown in the United States.
The tabulated value is an estimate of the average clear wood
property of the species. Many values were obtained from test
specimens taken at a height of 2.4 to 5 m (8 to 16 ft) above
the stump of the tree. Values reported in Table 4–4 represent
estimates of the average clear wood properties of species
grown in Canada and commonly imported into the United
States.
Methods of data collection and analysis changed over the
years during which the data in Tables 4–3 and 4–4 were
collected. In addition, the character of some forests has
changed with time. Because not all the species were reevalu-
ated to reflect these changes, the appropriateness of the data
should be reviewed when used for critical applications such
as stress grades of lumber.
Values reported in Table 4–5 were collected from the world
literature; thus, the appropriateness of these properties to
represent a species is not known. The properties reported in
Tables 4–1, 4–2, 4–5, 4–7, 4–8, 4–9 and 4–10 may not
necessarily represent average species characteristics because of
inadequate sampling; however, they do suggest the relative
influence of species and other specimen parameters on the
mechanical behavior recorded.
Variability in properties can be important in both production
and consumption of wood products. The fact that a piece
may be stronger, harder, or stiffer than the average is often of
less concern to the user than if the piece is weaker; however,
this may not be true if lightweight material is selected for a
specific purpose or if harder or tougher material is difficult to
work. Some indication of the spread of property values is
therefore desirable. Average coefficients of variation for many
mechanical properties are presented in Table 4–6.
Table 4–10. Summary of selected fracture toughness
results
Fracture toughness (
kPa m ( lbf/in in.
2
))
Mode I
Mode II
Species
TL
RL
TL
RL
Douglas-fir
320
(290)
360
(330)
2,230
(2,030)
Western hemlock
375
(340)
2,240
(2,040)
Pine
Western white
250
(225)
260
(240)
Scots
440
(400)
500
(455)
2,050
(1,860)
Southern
375
(340)
2,070
(1,880)
Ponderosa
290
(265)
Red spruce
420
(380)
2,190
(1,990)
1,665
(1,510)
Northern red oak
410
(370)
Sugar maple
480
(430)
Yellow-poplar
517
(470)
4–27
The mechanical properties reported in the tables are signifi-
cantly affected by specimen moisture content at time of test.
Some tables include properties that were evaluated at differ-
ing moisture levels; these moisture levels are reported. As
indicated in the tables, many of the dry test data were ad-
justed to a common moisture content base of 12%.
Specific gravity is reported in many tables because this
property is used as an index of clear wood mechanical proper-
ties. The specific gravity values given in Tables 4–3 and 4–4
represent the estimated average clear wood specific gravity of
the species. In the other tables, the specific gravity values
represent only the specimens tested. The variability of spe-
cific gravity, represented by the coefficient of variation de-
rived from tests on 50 species, is included in Table 4–6.
Mechanical and physical properties as measured and reported
often reflect not only the characteristics of the wood but also
the influence of the shape and size of the test specimen and
the test mode. The test methods used to establish properties
in Tables 4–3, 4–4, 4–7, 4–8 and 4–9 are based on standard
procedures (ASTM D143). The test methods for properties
presented in other tables are referenced in the selected bibli-
ography at the end of this chapter.
Common names of species listed in the tables conform to
standard nomenclature of the U.S. Department of Agriculture,
Forest Service. Other names may be used locally for a spe-
cies. Also, one common name may be applied to groups of
species for marketing.
Natural Characteristics
Affecting Mechanical Properties
Clear straight-grained wood is used for determining funda-
mental mechanical properties; however, because of natural
growth characteristics of trees, wood products vary in specific
gravity, may contain cross grain, or may have knots and
localized slope of grain. Natural defects such as pitch pockets
may occur as a result of biological or climatic elements
influencing the living tree. These wood characteristics must
be taken into account in assessing actual properties or esti-
mating the actual performance of wood products.
Specific Gravity
The substance of which wood is composed is actually heav-
ier than water; its specific gravity is about 1.5 regardless of
wood species. In spite of this, the dry wood of most species
floats in water, and it is thus evident that part of the volume
of a piece of wood is occupied by cell cavities and pores.
Variations in the size of these openings and in the thickness
of the cell walls cause some species to have more wood
substance per unit volume than other species and therefore
higher specific gravity. Thus, specific gravity is an excellent
index of the amount of wood substance contained in a piece
of wood; it is a good index of mechanical properties as long
as the wood is clear, straight grained, and free from defects.
However, specific gravity values also reflect the presence of
gums, resins, and extractives, which contribute little to
mechanical properties.
Approximate relationships between various mechanical
properties and specific gravity for clear straight-grained wood
of hardwoods and softwoods are given in Table 4–11 as
power functions. Those relationships are based on average
values for the 43 softwood and 66 hardwood species pre-
sented in Table 4–3. The average data vary around the rela-
tionships, so that the relationships do not accurately predict
individual average species values or an individual specimen
value. In fact, mechanical properties within a species tend to
be linearly, rather than curvilinearly, related to specific grav-
ity; where data are available for individual species, linear
analysis is suggested.
Knots
A knot is that portion of a branch that has become incorpo-
rated in the bole of a tree. The influence of a knot on the
mechanical properties of a wood member is due to the inter-
ruption of continuity and change in the direction of wood
fibers associated with the knot. The influence of knots de-
pends on their size, location, shape, and soundness; atten-
dant local slope of grain; and type of stress to which the
wood member is subjected.
The shape (form) of a knot on a sawn surface depends upon
the direction of the exposing cut. A nearly round knot is
produced when lumber is sawn from a log and a branch is
sawn through at right angles to its length (as in a flatsawn
board). An oval knot is produced if the saw cut is diagonal
to the branch length (as in a bastard-sawn board) and a
“spiked” knot when the cut is lengthwise to the branch (as
in a quartersawn board).
Knots are further classified as intergrown or encased
(Fig. 4–3). As long as a limb remains alive, there is con-
tinuous growth at the junction of the limb and the bole of the
tree, and the resulting knot is called intergrown. After the
branch has died, additional growth on the trunk encloses the
dead limb, resulting in an encased knot; bole fibers are not
continuous with the fibers of the encased knot. Encased knots
and knotholes tend to be accompanied by less cross-grain
than are intergrown knots and are therefore generally less
problematic with regard to most mechanical properties.
Most mechanical properties are lower in sections containing
knots than in clear straight-grained wood because (a) the clear
wood is displaced by the knot, (b) the fibers around the knot
are distorted, resulting in cross grain, (c) the discontinuity of
wood fiber leads to stress concentrations, and (d) checking
often occurs around the knots during drying. Hardness and
strength in compression perpendicular to the grain are excep-
tions, where knots may be objectionable only in that they
cause nonuniform wear or nonuniform stress distributions at
contact surfaces.
Knots have a much greater effect on strength in axial tension
than in axial short-column compression, and the effects on
bending are somewhat less than those in axial tension.
4–28
For this reason, in a simply supported beam, a knot on the
lower side (subjected to tensile stresses) has a greater effect
on the load the beam will support than does a knot on the
upper side (subjected to compressive stresses).
In long columns, knots are important because they affect
stiffness. In short or intermediate columns, the reduction in
strength caused by knots is approximately proportional to
their size; however, large knots have a somewhat greater
relative effect than do small knots.
Knots in round timbers, such as poles and piles, have less
effect on strength than do knots in sawn timbers. Although
the grain is irregular around knots in both forms of timber,
the angle of the grain to the surface is smaller in naturally
round timber than in sawn timber. Furthermore, in round
This page revised June 2002
timbers there is no discontinuity in wood fibers, which
results from sawing through both local and general slope of
grain.
The effects of knots in structural lumber are discussed in
Chapter 6.
Slope of Grain
In some wood product applications, the directions of impor-
tant stresses may not coincide with the natural axes of fiber
orientation in the wood. This may occur by choice in
design, from the way the wood was removed from the log, or
because of grain irregularities that occurred while the tree was
growing.
Table 4–11a. Functions relating mechanical properties to specific gravity of clear, straight-grained wood (metric)
Specific gravity–strength relationship
Green wood
Wood at 12% moisture content
Propertya
Softwoods
Hardwoods
Softwoods
Hardwoods
Static bending
MOR (kPa)
109,600 G1.01
118,700 G1.16 170,700 G1.01 171,300 G1.13
MOE (MPa) 16,100 G0.76 13,900 G0.72 20,500 G0.84 16,500 G0.7
WML (kJ/m3)
147 G1.21
229 G1.52
179 G1.34
219 G1.54
Impact bending (N)
353 G1.35
422 G1.39
346 G1.39
423 G1.65
Compression parallel (kPa)
49,700 G0.94
49,000 G1.11
93,700 G0.97
76,000 G0.89
Compression perpendicular (kPa)
8,800 G1.53
18,500 G2.48
16,500 G1.57
21,600 G2.09
Shear parallel (kPa)
11,000 G0.73
17,800 G1.24
16,600 G0.85
21,900 G1.13
Tension perpendicular (kPa)
3,800 G0.78
10,500 G1.37
6,000 G1.11
10,100 G1.3
Side hardness (N)
6,230 G1.41
16,550 G2.31
85,900 G1.5
15,300 G2.09
aCompression parallel to grain is maximum crushing strength; compression perpendicular to grain is fiber stress at
proportional limit. MOR is modulus of rupture; MOE, modulus of elasticity; and WML, work to maximum load. For green
wood, use specific gravity based on ovendry weight and green volume; for dry wood, use specific gravity based on
ovendry weight and volume at 12% moisture content.
Table 4–11b. Functions relating mechanical properties to specific gravity of clear, straight-grained wood (inch–pound)
Specific gravity–strength relationship
Green wood
Wood at 12% moisture content
Propertya
Softwoods
Hardwoods
Softwoods
Hardwoods
Static bending
MOR (lb/in2) 15,890 G1.01 17,210 G1.16 24,760 G1.01 24,850 G1.13
MOE (×106 lb/in2)
2.33 G0.76
2.02 G0.72
2.97 G.0.84
2.39 G0.7
WML (in-lbf/in3)
21.33 G1.21
33.2 G1.52
25.9 G1.34
31.8 G1.54
Impact bending (lbf)
79.28 G1.35
94.9 G1.39
77.7 G1.39
95.1 G1.65
Compression parallel (lb/in2)
7,210 G0.94
7,110 G1.11
13,590 G0.97
11,030 G0.89
Compression perpendicular (lb/in2)
1,270 G1.53
2,680 G2.48
2,390 G1.57
3,130 G2.09
Shear parallel (lb/in2)
1,590 G0.73
2,580 G1.24
2,410 G.0.85
3,170 G1.13
Tension perpendicular (lb/in2)
550 G0.78
1,520 G1.37
870 G1.11
1,460 G1.3
Side hardness (lbf)
1,400 G1.41
3,720 G2.31
1,930 G1.5
3,440 G2.09
aCompression parallel to grain is maximum crushing strength; compression perpendicular to grain is fiber stress at
proportional limit. MOR is modulus of rupture; MOE, modulus of elasticity; and WML, work to maximum load. For green
wood, use specific gravity based on ovendry weight and green volume; for dry wood, use specific gravity based on
ovendry weight and volume at 12% moisture content.
4–29
Elastic properties in directions other than along the natural
axes can be obtained from elastic theory. Strength properties
in directions ranging from parallel to perpendicular to the
fibers can be approximated using a Hankinson-type formula
(Bodig and Jayne 1982):
N
PQ
P
Q
n
n
=
+
sin
cos
θ
θ
(4–2)
where N is strength at angle θ from fiber direction,
Q strength perpendicular to grain, P strength parallel to
grain, and n an empirically determined constant.
This formula has been used for modulus of elasticity as well
as strength properties. Values of n and associated ratios of
Q/P tabulated from available literature are as follows:
Property
n
Q/P
Tensile strength
1.5–2
0.04–0.07
Compression strength
2–2.5
0.03–0.40
Bending strength
1.5–2
0.04–0.10
Modulus of elasticity
2
0.04–0.12
Toughness
1.5–2
0.06–0.10
The Hankinson-type formula can be graphically depicted as a
function of Q/P and n. Figure 4–4 shows the strength in any
direction expressed as a fraction of the strength parallel to
fiber direction, plotted against angle to the fiber direction θ.
The plot is for a range of values of Q/P and n.
The term slope of grain relates the fiber direction to the edges
of a piece. Slope of grain is usually expressed by the ratio
between 25 mm (1 in.) of the grain from the edge or long
axis of the piece and the distance in millimeters (inches)
within which this deviation occurs (tan θ). The effect of grain
slope on some properties of wood, as determined from tests,
is shown in Table 4–12. The values for modulus of rupture
fall very close to the curve in Figure 4–4 for Q/P = 0.1 and
n = 1.5. Similarly, the impact bending values fall close to
the curve for Q/P = 0.05 and n =1.5, and the compression
values for the curve for Q/P = 0.1, n = 2.5.
The term cross grain indicates the condition measured by
slope of grain. Two important forms of cross grain are spiral
and diagonal (Fig. 4–5). Other types are wavy, dipped,
interlocked, and curly.
Spiral grain is caused by winding or spiral growth of wood
fibers about the bole of the tree instead of vertical growth. In
sawn products, spiral grain can be defined as fibers lying in
the tangential plane of the growth rings, rather than parallel
to the longitudinal axis of the product (see Fig. 4–5 for a
simple case). Spiral grain in sawn products often goes unde-
tected by ordinary visual inspection. The best test for spiral
grain is to split a sample section from the piece in the radial
direction. A visual method of determining the presence of
spiral grain is to note the alignment of pores, rays, and resin
ducts on a flatsawn face. Drying checks on a flatsawn surface
follow the fibers and indicate the slope of the fiber. Relative
Figure 4–3. Types of knots. A, encased knot;
B, intergrown.
1.0
Fraction of property parallel to the
fiber direction
N/P
0.8
0.6
0.4
0.2
0
10
20
30
40
50
60
70
Q/P =
0.20
0.10
0.05
Angle to fiber direction (deg)
Figure 4–4. Effect of grain angle on mechanical property
of clear wood according to Hankinson-type formula.
Q/P is ratio of mechanical property across the grain (Q)
to that parallel to the grain (P); n is an empirically
determined constant.
4–30
change in electrical capacitance is an effective technique for
measuring slope of grain.
Diagonal grain is cross grain caused by growth rings that are
not parallel to one or both surfaces of the sawn piece. Diago-
nal grain is produced by sawing a log with pronounced taper
parallel to the axis (pith) of the tree. Diagonal grain also
occurs in lumber sawn from crooked logs or logs with butt
swell.
Cross grain can be quite localized as a result of the distur-
bance of a growth pattern by a branch. This condition,
termed local slope of grain, may be present even though the
branch (knot) may have been removed by sawing. The degree
of local cross grain may often be difficult to determine. Any
form of cross grain can have a deleterious effect on mechanical
properties or machining characteristics.
Spiral and diagonal grain can combine to produce a more
complex cross grain. To determine net cross grain, regardless
of origin, fiber slopes on the contiguous surface of a piece
must be measured and combined. The combined slope of
grain is determined by taking the square root of the sum of
the squares of the two slopes. For example, assume that the
spiral grain slope on the flat-grained surface of Figure 4–5D
is 1 in 12 and the diagonal-grain slope is 1 in 18. The com-
bined slope is
( / ) ( / )
/
1 18
1 12
1 10
2
2
+
=
or a slope of 1 in 10.
A regular reversal of right and left spiraling of grain in a tree
stem produces the condition known as interlocked grain.
Interlocked grain occurs in some hardwood species (Ch. 3,
Table 3–9) and markedly increases resistance to splitting in
the radial plane. Interlocked grain decreases both the static
bending strength and stiffness of clear wood specimens. The
data from tests of domestic hardwoods shown in Table 4–3
do not include pieces that exhibited interlocked grain. Some
mechanical property values in Table 4–5 are based on speci-
mens with interlocked grain because that is a characteristic of
some species. The presence of interlocked grain alters the
relationship between bending strength and compressive
strength of lumber cut from tropical hardwoods.
Annual Ring Orientation
Stresses perpendicular to the fiber (grain) direction may be
at any angle from 0° (T ) to 90o (R) to the growth rings
(Fig. 4–6). Perpendicular-to-grain properties depend some-
what upon orientation of annual rings with respect to the
direction of stress. The compression perpendicular-to-grain
values in Table 4–3 were derived from tests in which the
load was applied parallel to the growth rings (T direction);
shear parallel-to-grain and tension perpendicular-to-grain
values are averages of equal numbers of specimens with 0o
and 90o growth ring orientations. In some species, there is
no difference in 0o and 90 o orientation properties. Other
species exhibit slightly higher shear parallel or tension per-
pendicular-to-grain properties for the 0o orientation than for
Table 4–12. Strength of wood members with various
grain slopes compared with strength of a straight-
grained membera
Maximum slope
of grain in
member
Modulus
of rupture
(%)
Impact
bending
(%)
Compression
parallel to grain
(%)
Straight-grained
100
100
100
1 in 25
96
95
100
1 in 20
93
90
100
1 in 15
89
81
100
1 in 10
81
62
99
1 in 5
55
36
93
aImpact bending is height of drop causing complete
failure (0.71-kg (50-lb) hammer); compression parallel
to grain is maximum crushing strength.
Figure 4–5. Relationship of fiber orientation (O-O) to
axes, as shown by schematic of wood specimens
containing straight grain and cross grain. Specimens A
through D have radial and tangential surfaces;
E through H do not. Specimens A and E contain no
cross grain; B, D, F, and H have spiral grain;
C, D, G, and H have diagonal grain.
4–31
the 90o orientation; the converse is true for about an equal
number of species.
The effects of intermediate annual ring orientations have been
studied in a limited way. Modulus of elasticity, compressive
perpendicular-to-grain stress at the proportional limit, and
tensile strength perpendicular to the grain tend to be about
the same at 45o and 0o, but for some species these values are
40% to 60% lower at the 45o orientation. For those species
with lower properties at 45o ring orientation, properties tend
to be about equal at 0o and 90o orientations. For species with
about equal properties at 0o and 45o orientations, properties
tend to be higher at the 90o orientation.
Reaction Wood
Abnormal woody tissue is frequently associated with leaning
boles and crooked limbs of both conifers and hardwoods. It
is generally believed that such wood is formed as a natural
response of the tree to return its limbs or bole to a more
normal position, hence the term reaction wood. In soft-
woods, the abnormal tissue is called compression wood; it
is common to all softwood species and is found on the lower
side of the limb or inclined bole. In hardwoods, the abnor-
mal tissue is known as tension wood; it is located on the
upper side of the inclined member, although in some in-
stances it is distributed irregularly around the cross section.
Reaction wood is more prevalent in some species than in
others.
Many of the anatomical, chemical, physical, and mechanical
properties of reaction wood differ distinctly from those of
normal wood. Perhaps most evident is the increase in den-
sity compared with that of normal wood. The specific gravity
of compression wood is commonly 30% to 40% greater than
that of normal wood; the specific gravity of tension wood
commonly ranges between 5% and 10% greater than that of
normal wood, but it may be as much as 30% greater.
Compression wood is usually somewhat darker than normal
wood because of the greater proportion of latewood, and it
frequently has a relatively lifeless appearance, especially in
woods in which the transition from earlywood to latewood is
abrupt. Because compression wood is more opaque than
normal wood, intermediate stages of compression wood can
be detected by transmitting light through thin cross sections;
however, borderline forms of compression wood that merge
with normal wood can commonly be detected only by mi-
croscopic examination.
Tension wood is more difficult to detect than is compression
wood. However, eccentric growth as seen on the transverse
section suggests its presence. Also, because it is difficult to
cleanly cut the tough tension wood fibers, the surfaces of
sawn boards are “woolly,” especially when the boards are
sawn in the green condition (Fig. 4–7). In some species,
tension wood may be evident on a smooth surface as areas of
contrasting colors. Examples of this are the silvery appear-
ance of tension wood in sugar maple and the darker color of
tension wood in mahogany.
Reaction wood, particularly compression wood in the green
condition, may be stronger than normal wood. However,
compared with normal wood with similar specific gravity,
reaction wood is definitely weaker. Possible exceptions to
this are compression parallel-to-grain properties of compres-
sion wood and impact bending properties of tension wood.
Figure 4–6. Direction of load in relation to direction of
annual growth rings: 90o or perpendicular (R), 45°, 0°
or parallel (T).
Figure 4–7. Projecting tension wood fibers on sawn
surface of mahogany board.
4–32
Because of the abnormal properties of reaction wood, it may
be desirable to eliminate this wood from raw material. In
logs, compression wood is characterized by eccentric growth
about the pith and the large proportion of latewood at the
point of greatest eccentricity (Fig. 4–8A). Fortunately, pro-
nounced compression wood in lumber can generally be
detected by ordinary visual examination.
Compression and tension wood undergo extensive longitu-
dinal shrinkage when subjected to moisture loss below the
fiber saturation point. Longitudinal shrinkage in compression
wood may be up to 10 times that in normal wood and in
tension wood, perhaps up to 5 times that in normal wood.
When reaction wood and normal wood are present in the
same board, unequal longitudinal shrinkage causes internal
stresses that result in warping. In extreme cases, unequal
longitudinal shrinkage results in axial tension failure over a
portion of the cross section of the lumber (Fig. 4–8B). Warp
sometimes occurs in rough lumber but more often in planed,
ripped, or resawn lumber (Fig. 4–8C).
Juvenile Wood
Juvenile wood is the wood produced near the pith of the tree;
for softwoods, it is usually defined as the material 5 to
20 rings from the pith depending on species. Juvenile wood
has considerably different physical and anatomical properties
than that of mature wood (Fig. 4–9). In clear wood, the
properties that have been found to influence mechanical
behavior include fibril angle, cell length, and specific gravity,
the latter a composite of percentage of latewood, cell wall
thickness, and lumen diameter. Juvenile wood has a high
fibril angle (angle between longitudinal axis of wood cell
and cellulose fibrils), which causes longitudinal shrinkage
that may be more than 10 times that of mature wood. Com-
pression wood and spiral grain are also more prevalent in
juvenile wood than in mature wood and contribute to longi-
tudinal shrinkage. In structural lumber, the ratio of modulus
of rupture, ultimate tensile stress, and modulus of elasticity
for juvenile to mature wood ranges from 0.5 to 0.9, 0.5 to
0.95, and 0.45 to 0.75, respectively. Changes in shear
strength resulting from increases in juvenile wood content
can be adequately predicted by monitoring changes in den-
sity alone for all annual ring orientations. The same is true
for perpendicular-to-grain compressive strength when the load
is applied in the tangential direction. Compressive strength
perpendicular-to-grain for loads applied in the radial direc-
tion, however, is more sensitive to changes in juvenile wood
content and may be up to eight times less than that sug-
gested by changes in density alone. The juvenile wood to
mature wood ratio is lower for higher grades of lumber than
for lower grades, which indicates that juvenile wood has
greater influence in reducing the mechanical properties of
high-grade structural lumber. Only a limited amount of
research has been done on juvenile wood in hardwood
species.
Figure 4–8. Effects of compression wood. A, eccentric
growth about pith in cross section containing compres-
sion wood—dark area in lower third of cross section is
compression wood; B, axial tension break caused by
excessive longitudinal shrinkage of compression wood;
C, warp caused by excessive longitudinal shrinkage.
Fibril angle
Longitudinal shrinkage
Moisture content
Spiral grain
Specific gravity
Cell length
Strength
Cell wall thickness
T
ransverse shrinkage
Percentage latewood
Juvenile
wood
Mature wood
Juvenile
wood
Mature wood
Pith 5-20 rings Bark
Figure 4–9. Properties of juvenile wood.
4–33
Compression Failures
Excessive compressive stresses along the grain that produce
minute compression failures can be caused by excessive
bending of standing trees from wind or snow; felling of trees
across boulders, logs, or irregularities in the ground; or
rough handling of logs or lumber. Compression failures
should not be confused with compression wood. In some
instances, compression failures are visible on the surface of
a board as minute lines or zones formed by crumpling or
buckling of cells (Fig. 4–10A), although the failures usually
appear as white lines or may even be invisible to the naked
eye. The presence of compression failures may be indicated
by fiber breakage on end grain (Fig. 4–10B). Since compres-
sion failures are often difficult to detect with the unaided eye,
special efforts, including optimum lighting, may be required
for detection. The most difficult cases are detected only by
microscopic examination.
Products containing visible compression failures have low
strength properties, especially in tensile strength and shock
resistance. The tensile strength of wood containing compres-
sion failures may be as low as one-third the strength of
matched clear wood. Even slight compression failures, visi-
ble only under a microscope, may seriously reduce strength
and cause brittle fracture. Because of the low strength associ-
ated with compression failures, many safety codes require
certain structural members, such as ladder rails and scaffold
planks, to be entirely free of such failures.
Pitch Pockets
A pitch pocket is a well-defined opening that contains free
resin. The pocket extends parallel to the annual rings; it is
almost flat on the pith side and curved on the bark side.
Pitch pockets are confined to such species as the pines,
spruces, Douglas-fir, tamarack, and western larch.
The effect of pitch pockets on strength depends upon their
number, size, and location in the piece. A large number of
pitch pockets indicates a lack of bond between annual growth
layers, and a piece with pitch pockets should be inspected for
shake or separation along the grain.
Bird Peck
Maple, hickory, white ash, and a number of other species are
often damaged by small holes made by woodpeckers.
These bird pecks often occur in horizontal rows, sometimes
encircling the tree, and a brown or black discoloration known
as a mineral streak originates from each hole. Holes for tap-
ping maple trees are also a source of mineral streaks. The
streaks are caused by oxidation and other chemical changes
in the wood. Bird pecks and mineral streaks are not generally
important in regard to strength of structural lumber, although
they do impair the appearance of the wood.
Extractives
Many wood species contain removable extraneous materials
or extractives that do not degrade the cellulose–lignin struc-
ture of the wood. These extractives are especially abundant in
species such as larch, redwood, western redcedar, and black
locust.
A small decrease in modulus of rupture and strength in
compression parallel to grain has been measured for some
species after the extractives have been removed. The extent to
which extractives influence strength is apparently a function
of the amount of extractives, the moisture content of the
piece, and the mechanical property under consideration.
Properties of Timber From Dead Trees
Timber from trees killed by insects, blight, wind, or fire may
be as good for any structural purpose as that from live trees,
provided further insect attack, staining, decay, or drying
degrade has not occurred. In a living tree, the heartwood is
entirely dead and only a comparatively few sapwood cells are
alive. Therefore, most wood is dead when cut, regardless of
Figure 4–10. Compression failures. A, compression
failure shown by irregular lines across grain; B, fiber
breakage in end-grain surfaces of spruce lumber caused
by compression failures below dark line.
4–34
whether the tree itself is living or not. However, if a tree
stands on the stump too long after its death, the sapwood is
likely to decay or to be attacked severely by wood-boring
insects, and eventually the heartwood will be similarly
affected. Such deterioration also occurs in logs that have been
cut from live trees and improperly cared for afterwards. Be-
cause of variations in climatic and other factors that affect
deterioration, the time that dead timber may stand or lie in
the forest without serious deterioration varies.
Tests on wood from trees that had stood as long as 15 years
after being killed by fire demonstrated that this wood was as
sound and strong as wood from live trees. Also, the heart-
wood of logs of some more durable species has been found to
be thoroughly sound after lying in the forest for many years.
On the other hand, in nonresistant species, decay may cause
great loss of strength within a very brief time, both in trees
standing dead on the stump and in logs cut from live trees
and allowed to lie on the ground. The important considera-
tion is not whether the trees from which wood products are
cut are alive or dead, but whether the products themselves are
free from decay or other degrading factors that would render
them unsuitable for use.
Effects of Manufacturing and
Service Environments
Moisture Content
Many mechanical properties are affected by changes in mois-
ture content below the fiber saturation point. Most properties
reported in Tables 4–3, 4–4, and 4–5 increase with decrease
in moisture content. The relationship that describes these
changes in clear wood property at about 21ºC (70ºF) is
P P P
P
M
M
=
−
−
12
12
g
12
12
p
(4–3)
where P is the property at moisture content M (%), P12 the
same property at 12% MC, Pg the same property for green
wood, and Mp moisture content at the intersection of a
horizontal line representing the strength of green wood and
an inclined line representing the logarithm of the strength–
moisture content relationship for dry wood. This assumed
linear relationship results in an Mp value that is slightly less
than the fiber saturation point. Table 4–13 gives values of Mp
for a few species; for other species, Mp = 25 may be assumed.
Average property values of P12 and Pg are given for many
species in Tables 4–3 to 4–5. The formula for moisture
content adjustment is not recommended for work to maxi-
mum load, impact bending, and tension perpendicular to
grain. These properties are known to be erratic in their
response to moisture content change.
The formula can be used to estimate a property at any mois-
ture content below Mp from the species data given. For
example, suppose you want to find the modulus of rupture of
white ash at 8% moisture content. Using information from
Tables 4–3a and 4–13,
P8
4 12
103 000 103 000
66 000
119 500
=
=
,
,
,
,
/
kPa
Care should be exercised when adjusting properties below
12% moisture. Although most properties will continue to
increase while wood is dried to very low moisture content
levels, for most species some properties may reach a
maximum value and then decrease with further drying
(Fig. 4–11). For clear Southern Pine, the moisture content
at which a maximum property has been observed is given
in Table 4–14.
This increase in mechanical properties with drying assumes
small, clear specimens in a drying process in which no
deterioration of the product (degrade) occurs. For 51-mm-
(2-in.-) thick lumber containing knots, the increase in prop-
erty with decreasing moisture content is dependent upon
lumber quality. Clear, straight-grained lumber may show
increases in properties with decreasing moisture content that
approximate those of small, clear specimens. However, as the
frequency and size of knots increase, the reduction in strength
resulting from the knots begins to negate the increase in
property in the clear wood portion of the lumber. Very low
quality lumber, which has many large knots, may be insensi-
tive to changes in moisture content. Figures 4–12 and 4–13
illustrate the effect of moisture content on the properties of
lumber as a function of initial lumber strength (Green and
others 1989). Application of these results in adjusting allow-
able properties of lumber is discussed in Chapter 6.
Additional information on influences of moisture content
on dimensional stability is included in Chapter 12.
Table 4–13. Intersection moisture content values for
selected speciesa
Mp
Species
(%)
Ash, white
24
Birch, yellow
27
Chestnut, American
24
Douglas-fir
24
Hemlock, western
28
Larch, western
28
Pine, loblolly
21
Pine, longleaf
21
Pine, red
24
Redwood
21
Spruce, red
27
Spruce, Sitka
27
Tamarack
24
aIntersection moisture content is point at which
mechanical properties begin to change when wood
is dried from the green condition.
4–35
Temperature
Reversible Effects
In general, the mechanical properties of wood decrease when
heated and increase when cooled. At a constant moisture
content and below approximately 150ºC (302ºF), mechanical
properties are approximately linearly related to temperature.
The change in properties that occurs when wood is quickly
heated or cooled and then tested at that condition is termed
an immediate effect. At temperatures below 100ºC (212ºF),
the immediate effect is essentially reversible; that is, the
property will return to the value at the original temperature
if the temperature change is rapid.
Figure 4–14 illustrates the immediate effect of temperature on
modulus of elasticity parallel to grain, modulus of rupture,
and compression parallel to grain, 20oC (68oF), based on a
composite of results for clear, defect-free wood. This figure
represents an interpretation of data from several investigators.
The width of the bands illustrates variability between and
within reported trends.
Table 4–15 lists changes in clear wood properties at −50oC
(−58oF) and 50oC (122oF) relative to those at 20oC (68oF) for
a number of moisture conditions. The large changes at
−
50oC (−58oF) for green wood (at fiber saturation point or
wetter) reflect the presence of ice in the wood cell cavities.
The strength of dry lumber, at about 12% moisture content,
may change little as temperature increases from −29oC
(−20oF) to 38oC (100oF). For green lumber, strength gener-
ally decreases with increasing temperature. However, for
temperatures between about 7oC (45oF) and 38oC (100oF),
the changes may not differ significantly from those at room
temperature. Table 4–16 provides equations that have been
Property (MPa)
Property (x10
3
lbf/in
2
)
22.0
150
120
90
60
30
0
5
10
15
20
25
30
Moisture content (%)
16.5
11.0
5.5
A
B
C
D
E
0
Figure 4–11. Effect of moisture content on wood
strength properties. A, tension parallel to grain;
B, bending; C, compression parallel to grain;
D, compression perpendicular to grain; and
E, tension perpendicular to grain.
Table 4–14. Moisture content for maximum property
value in drying clear Southern Pine from green to
4% moisture content
Property
Moisture content
at which peak
property occurs
(%)
Ultimate tensile stress
parallel to grain
12.6
Ultimate tensile stress
perpendicular to grain
10.2
MOE tension perpendicular to grain
4.3
MOE compression parallel to grain
4.3
Modulus of rigidity, GRT
10.0
120
80
40
0
Ultimate tensile stress (MPa)
16
Ultimate tensile stress (x10
3
lbf/in
2
)
12
8
4
0
8
12
16
20
24
Moisture content (%)
Figure 4–12. Effect of moisture content on tensile
strength of lumber parallel to grain.
12
8
4
0
90
60
30
0
8
12
16
20
24
Ultimate compressive strength (x10
3
lbf/in
2
)
Ultimate compressive strength (MPa)
Moisture content (%)
Figure 4–13. Effect of moisture content on
compressive strength of lumber parallel to grain.
4–36
used to adjust some lumber properties for the reversible
effects of temperature.
Irreversible Effects
In addition to the reversible effect of temperature on wood,
there is an irreversible effect at elevated temperature. This
permanent effect is one of degradation of wood substance,
which results in loss of weight and strength. The loss de-
pends on factors that include moisture content, heating me-
dium, temperature, exposure period, and to some extent,
species and size of piece involved.
The permanent decrease of modulus of rupture caused by
heating in steam and water is shown as a function of tempera-
ture and heating time in Figure 4–15, based on tests of clear
pieces of Douglas-fir and Sitka spruce. In the same studies,
heating in water affected work to maximum load more than
modulus of rupture (Fig. 4–16). The effect of heating dry
wood (0% moisture content) on modulus of rupture and
modulus of elasticity is shown in Figures 4–17 and 4–18,
respectively, as derived from tests on four softwoods and two
hardwoods.
200
150
100
50
0
Relative modulus of elasticity (%)
-200
-100
0
100
200
300
12% moisture content
0% moisture content
(a)
Relative modulus of rupture (%)
250
200
150
100
50
0
-200
-100
-150
-50
0
50
100
150
18% moisture content
0%
moisture content
12% moisture content
(b)
300
250
200
150
100
50
0
-200
-100
0
100
200
300
12% moisture content
0% moisture content
Temperature (
°C)
Relative compressive strength (%)
(c)
Figure 4–14. Immediate effect of temperature at two
moisture content levels relative to value at 20°C (68°F)
for clear, defect-free wood: (a) modulus of elasticity
parallel to grain, (b) modulus of rupture in bending,
(c) compressive strength parallel to grain. The plot is a
composite of results from several studies. Variability
in reported trends is illustrated by width of bands.
Table 4–15. Approximate middle-trend effects of
temperature on mechanical properties of clear wood
at various moisture conditions
Relative change in
mechanical property
from 20°C (68°F) at
Moisture
conditiona
−
50°C
(−58°F)
+50°C
(+122°F)
Property
(%)
(%)
(%)
MOE parallel to grain
0
+11
−
6
12
+17
−
7
>FSP
+50
—
MOE perpendicular to grain
6
—
−
20
12
—
−
35
≥
20
—
−
38
Shear modulus
>FSP
—
−
25
Bending strength
≤
4
+18
−
10
11–15
+35
−
20
18–20
+60
−
25
>FSP
+110
−
25
Tensile strength parallel to grain
0–12
—
−
4
Compressive strength parallel
0
+20
−
10
to grain
12–45
+50
−
25
Shear strength parallel to grain
>FSP
—
−
25
Tensile strength perpendicular
4–6
—
−
10
to grain
11–16
—
−
20
≥
18
—
−
30
Compressive strength perpen-
dicular to grain at proportional
limit
0–6
≥
10
—
—
−
20
−
35
aFSP indicates moisture content greater than fiber saturation point.
4–37
Figure 4–19 illustrates the permanent loss in bending
strength of Spruce–Pine–Fir standard 38- by 89-mm
(nominal 2- by 4-in.) lumber heated at 66oC (150oF) and
about 12% moisture content. During this same period,
modulus of elasticity barely changed. Most in-service
exposures at 66°C (150°F) would be expected to result in
much lower moisture content levels. Additional results for
other lumber products and exposure conditions will be re-
ported as Forest Products Laboratory studies progress.
The permanent property losses discussed here are based on
tests conducted after the specimens were cooled to room
temperature and conditioned to a range of 7% to 12% mois-
ture content. If specimens are tested hot, the percentage of
strength reduction resulting from permanent effects is based
on values already reduced by the immediate effects. Repeated
exposure to elevated temperature has a cumulative effect on
wood properties. For example, at a given temperature the
property loss will be about the same after six 1-month expo-
sure as it would be after a single 6-month exposure.
The shape and size of wood pieces are important in analyzing
the influence of temperature. If exposure is for only a short
time, so that the inner parts of a large piece do not reach the
temperature of the surrounding medium, the immediate effect
on strength of the inner parts will be less than that for the
outer parts. However, the type of loading must be consid-
ered. If the member is to be stressed in bending, the outer
fibers of a piece will be subjected to the greatest stress and
will ordinarily govern the ultimate strength of the piece;
hence, under this loading condition, the fact that the inner
part is at a lower temperature may be of little significance.
For extended noncyclic exposures, it can be assumed that the
entire piece reaches the temperature of the heating medium
and will therefore be subject to permanent strength losses
throughout the volume of the piece, regardless of size and
mode of stress application. However, in ordinary construc-
tion wood often will not reach the daily temperature extremes
of the air around it; thus, long-term effects should be based
on the accumulated temperature experience of critical
structural parts.
Time Under Load
Rate of Loading
Mechanical property values, as given in Tables 4–3, 4–4,
and 4–5, are usually referred to as static strength values.
Static strength tests are typically conducted at a rate of load-
ing or rate of deformation to attain maximum load in about
5 min. Higher values of strength are obtained for wood
loaded at a more rapid rate and lower values are obtained at
slower rates. For example, the load required to produce
failure in a wood member in 1 s is approximately 10%
higher than that obtained in a standard static strength test.
Over several orders of magnitude of rate of loading, strength
is approximately an exponential function of rate. See
Chapter 6 for application to treated woods.
Figure 4–20 illustrates how strength decreases with time to
maximum load. The variability in the trend shown is based
on results from several studies pertaining to bending, com-
pression, and shear.
Creep and Relaxation
When initially loaded, a wood member deforms elastically.
If the load is maintained, additional time-dependent deforma-
tion occurs. This is called creep. Creep occurs at even very
low stresses, and it will continue over a period of years. For
sufficiently high stresses, failure eventually occurs. This
failure phenomenon, called duration of load (or creep
rupture), is discussed in the next section.
At typical design levels and use environments, after several
years the additional deformation caused by creep may
approximately equal the initial, instantaneous elastic
deformation. For illustration, a creep curve based on creep as
a function of initial deflection (relative creep) at several stress
levels is shown in Figure 4–21; creep is greater under higher
stresses than under lower ones.
Table 4–16. Percentage change in bending properties of lumber with change in temperaturea
Lumber
Moisture
((P–P70) / P70)100 = A + BT + CT 2
Temperature range
Property
gradeb
content
A
B
C
Tmin
Tmax
MOE
All
Green
22.0350
−
0.4578
0
0
32
Green
13.1215
−
0.1793
0
32
150
12%
7.8553
−
0.1108
0
−
15
150
MOR
SS
Green
34.13
−
0.937
0.0043
−
20
46
Green
0
0
0
46
100
12%
0
0
0
−
20
100
No. 2
Green
56.89
−
1.562
0.0072
−
20
46
or less
Green
0
0
0
46
100
Dry
0
0
0
−
20
100
aFor equation, P is property at temperature T in °F; P70, property at 21°C (70°F).
bSS is Select Structural.
4–38
Ordinary climatic variations in temperature and humidity
will cause creep to increase. An increase of about 28oC (50oF)
in temperature can cause a two- to threefold increase in creep.
Green wood may creep four to six times the initial deforma-
tion as it dries under load.
Unloading a member results in immediate and complete
recovery of the original elastic deformation and after time, a
recovery of approximately one-half the creep at deformation as
well. Fluctuations in temperature and humidity increase the
magnitude of the recovered deformation.
Relative creep at low stress levels is similar in bending,
tension, or compression parallel to grain, although it may be
somewhat less in tension than in bending or compression
under varying moisture conditions. Relative creep across the
grain is qualitatively similar to, but likely to be greater than,
creep parallel to the grain. The creep behavior of all species
studied is approximately the same.
If instead of controlling load or stress, a constant deformation
is imposed and maintained on a wood member, the initial
stress relaxes at a decreasing rate to about 60% to 70% of its
original value within a few months. This reduction of stress
with time is commonly called relaxation.
120
°C (250°F)
100
Modulus of rupture (percentage of
value at 26.7
°C (80
°
F))
93
°C (200°F)
150
°C (300°F)
175
°C (350°F)
Heating period (h)
0
8
16
24
32
90
80
70
60
50
40
Figure 4–15. Permanent effect of heating in water
(solid line) and steam (dashed line) on modulus of rup-
ture of clear, defect-free wood. All data based on tests
of Douglas-fir and Sitka spruce at room temperature.
Modulus of rupture
Work
66
°C (150°F)
93
°C (200°F)
Property (percentage of untreated controls)
100
90
80
70
60
50
0
50
100
150
200
250
300
Heating period (days)
Figure 4–16. Permanent effect of heating in water on
work to maximum load and modulus of rupture of clear,
defect-free wood. All data based on tests of Douglas-fir
and Sitka spruce at room temperature.
100
Modulus of rupture (percentage of
untreated controls)
70
90
80
60
50
40
0
50
100
150
200
250
300
Time of exposure (days)
155
°C (310°F)
115
°C (240°F)
135
°C (275°F)
175
°C (350°F)
Figure 4–17. Permanent effect of oven heating at four
temperatures on modulus of rupture, based on clear
pieces of four softwood and two hardwood species.
All tests conducted at room temperature.
115
°C (240°F)
135
°C (275°F)
155
°C (310°F)
175
°C (350°F)
104
102
100
98
96
94
92
90
88
0
50
100
150
200
250
300
Time of exposure (days)
Modulus of elasticity (percentage of
untreated controls)
Figure 4–18. Permanent effect of oven heating at four
temperatures on modulus of elasticity, based on clear
pieces of four softwood and two hardwood species.
All tests conducted at room temperature.
4–39
In limited bending tests carried out between approximately
18oC (64oF) and 49oC (120oF) over 2 to 3 months, the curve
of stress as a function of time that expresses relaxation is
approximately the mirror image of the creep curve
(deformation as a function of time). These tests were carried
out at initial stresses up to about 50% of the bending
strength of the wood. As with creep, relaxation is markedly
affected by fluctuations in temperature and humidity.
Duration of Load
The duration of load, or the time during which a load acts on
a wood member either continuously or intermittently, is an
important factor in determining the load that the member can
safely carry. The duration of load may be affected by changes
in temperature and relative humidity.
The constant stress that a wood member can sustain is ap-
proximately an exponential function of time to failure, as
illustrated in Figure 4–22. This relationship is a composite
of results of studies on small, clear wood specimens, con-
ducted at constant temperature and relative humidity.
1.0
0.9
0.8
0.7
0.6
0.5
MOR after exposure/MOR of controls
0 12 24 36 48 60 72
Exposure time (months)
2100f-1.8E
1650f-1.5E
Figure 4–19. Permanent effect of heating at 66°C (150°F)
on modulus of rupture for two grades of machine-stress-
rated Spruce–Pine–Fir lumber at 12% moisture content.
All tests conducted at room temperature.
140
120
100
80
60
40
20
0
10-2
102
104
106
108
100
Ultimate stress (percentage of static strength)
Time to ultimate stress (s)
≈12% moisture content
Figure 4–20. Relationship of ultimate stress at short-
time loading to that at 5-min loading, based on com-
posite of results from rate-of-load studies on bending,
compression, and shear parallel to grain. Variability
in reported trends is indicated by width of band.
2
1
0
Creep deflection (multiple of
initial deflection)
MPa x103 lbf/in2
3.4 0.5
6.9 1.0
13.8 2.0
27.6 4.0
100
200
300
400
500
Time under load (days)
Stress
Figure 4–21. Influence of four levels of stress on creep
(Kingston 1962).
6% and 12% moisture content
Time to failure (h)
Constant stress (percentage of
static strength)
10-6
10-4
10-2
100
102
104
106
120
100
80
60
40
20
0
Figure 4–22. Relationship between stress due to constant
load and time to failure for small clear wood specimens,
based on 28 s at 100% stress. The figure is a composite
of trends from several studies; most studies involved
bending but some involved compression parallel to grain
and bending perpendicular to grain. Variability in
reported trends is indicated by width of band.
4–40
For a member that continuously carries a load for a long
period, the load required to produce failure is much less than
that determined from the strength properties in Tables 4–3 to
4–5. Based on Figure 4–22, a wood member under the
continuous action of bending stress for 10 years may carry
only 60% (or perhaps less) of the load required to produce
failure in the same specimen loaded in a standard bending
strength test of only a few minutes duration. Conversely, if
the duration of load is very short, the load-carrying capacity
may be higher than that determined from strength properties
given in the tables.
Time under intermittent loading has a cumulative effect. In
tests where a constant load was periodically placed on a
beam and then removed, the cumulative time the load was
actually applied to the beam before failure was essentially
equal to the time to failure for a similar beam under the same
load applied continuously.
The time to failure under continuous or intermittent loading
is looked upon as a creep–rupture process; a member has to
undergo substantial deformation before failure. Deformation at
failure is approximately the same for duration of load tests as
for standard strength tests.
Changes in climatic conditions increase the rate of creep and
shorten the duration during which a member can support a
given load. This effect can be substantial for very small wood
specimens under large cyclic changes in temperature and
relative humidity. Fortunately, changes in temperature and
relative humidity are moderate for wood in the typical service
environment.
Fatigue
In engineering, the term fatigue is defined as the progressive
damage that occurs in a material subjected to cyclic loading.
This loading may be repeated (stresses of the same sign; that
is, always compression or always tension) or reversed
(stresses of alternating compression and tension). When
sufficiently high and repetitious, cyclic loading stresses can
result in fatigue failure.
Fatigue life is a term used to define the number of cycles that
are sustained before failure. Fatigue strength, the maximum
stress attained in the stress cycle used to determine fatigue
life, is approximately exponentially related to fatigue life;
that is, fatigue strength decreases approximately linearly as
the logarithm of number of cycles increases. Fatigue strength
and fatigue life also depend on several other factors: frequency
of cycling; repetition or reversal of loading; range factor (ratio
of minimum to maximum stress per cycle); and other factors
such as temperature, moisture content, and specimen size.
Negative range factors imply repeated reversing loads,
whereas positive range factors imply nonreversing loads.
Results from several fatigue studies on wood are given in
Table 4–17. Most of these results are for repeated loading
with a range ratio of 0.1, meaning that the minimum stress
per cycle is 10% of the maximum stress. The maximum
stress per cycle, expressed as a percentage of estimated static
strength, is associated with the fatigue life given in millions
of cycles. The first three lines of data, which list the same
cyclic frequency (30 Hz), demonstrate the effect of range ratio
on fatigue strength (maximum fatigue stress that can be
maintained for a given fatigue life); fatigue bending strength
decreases as range ratio decreases. Third-point bending re-
sults show the effect of small knots or slope of grain on
fatigue strength at a range ratio of 0.1 and frequency of
8.33 Hz. Fatigue strength is lower for wood containing small
knots or a 1-in-12 slope of grain than for clear straight-
grained wood and even lower for wood containing a combi-
nation of small knots and a 1-in-12 slope of grain. Fatigue
strength is the same for a scarf joint in tension as for tension
parallel to the grain, but a little lower for a finger joint in
tension. Fatigue strength is slightly lower in shear than in
tension parallel to the grain. Other comparisons do not have
much meaning because range ratios or cyclic frequency differ;
however, fatigue strength is high in compression parallel to
the grain compared with other properties. Little is known
about other factors that may affect fatigue strength in wood.
Creep, temperature rise, and loss of moisture content occur in
tests of wood for fatigue strength. At stresses that cause
failure in about 106 cycles at 40 Hz, a temperature rise of
Table 4–17. Summary of reported results on cyclic
fatiguea
Range
Cyclic
fre-
quency
Maximum
stress per
cycleb
Approxi-
mate
fatigue
life
Property
ratio
(Hz)
(%)
(×106 cycles)
Bending, clear,
straight grain
Cantilever
0.45
30
45
30
Cantilever
0
30
40
30
Cantilever
−
1.0
30
30
30
Center-point
−
1.0
40
30
4
Rotational
−
1.0
—
28
30
Third-point
0.1
8-1/3
60
2
Bending, third-point
Small knots
0.1
8-1/3
50
2
Clear, 1:12 slope
of grain
0.1
8-1/3
50
2
Small knots, 1:12
slope of grain
0.1
8-1/3
40
2
Tension parallel
to grain
Clear, straight grain
0.1
15
50
30
Clear, straight grain
0
40
60
3.5
Scarf joint
0.1
15
50
30
Finger joint
0.1
15
40
30
Compression parallel
to grain
Clear, straight grain
0.1
40
75
3.5
Shear parallel to grain
Glue-laminated
0.1
15
45
30
aInitial moisture content about 12% to 15%.
bPercentage of estimated static strength.
4–41
15oC (27oF) has been reported for parallel-to-grain compres-
sion fatigue (range ratio slightly greater than zero), parallel-
to-grain tension fatigue (range ratio = 0), and reversed bend-
ing fatigue (range ratio = −1). The rate of temperature rise is
high initially but then diminishes to moderate; a moderate
rate of temperature rise remains more or less constant during
a large percentage of fatigue life. During the latter stages of
fatigue life, the rate of temperature rise increases until failure
occurs. Smaller rises in temperature would be expected for
slower cyclic loading or lower stresses. Decreases in mois-
ture content are probably related to temperature rise.
Aging
In relatively dry and moderate temperature conditions where
wood is protected from deteriorating influences such as de-
cay, the mechanical properties of wood show little change
with time. Test results for very old timbers suggest that
significant losses in clear wood strength occur only after
several centuries of normal aging conditions. The soundness
of centuries-old wood in some standing trees (redwood, for
example) also attests to the durability of wood.
Exposure to Chemicals
The effect of chemical solutions on mechanical properties
depends on the specific type of chemical. Nonswelling liq-
uids, such as petroleum oils and creosote, have no apprecia-
ble effect on properties. Properties are lowered in the presence
of water, alcohol, or other wood-swelling organic liquids
even though these liquids do not chemically degrade the
wood substance. The loss in properties depends largely on
the amount of swelling, and this loss is regained upon re-
moval of the swelling liquid. Anhydrous ammonia markedly
reduces the strength and stiffness of wood, but these proper-
ties are regained to a great extent when the ammonia is
removed. Heartwood generally is less affected than sapwood
because it is more impermeable. Accordingly, wood treat-
ments that retard liquid penetration usually enhance natural
resistance to chemicals.
Chemical solutions that decompose wood substance (by
hydrolysis or oxidation) have a permanent effect on strength.
The following generalizations summarize the effect of
chemicals:
•
Some species are quite resistant to attack by dilute
mineral and organic acids.
•
Oxidizing acids such as nitric acid degrade wood more
than do nonoxidizing acids.
•
Alkaline solutions are more destructive than are acidic
solutions.
•
Hardwoods are more susceptible to attack by both acids
and alkalis than are softwoods.
•
Heartwood is less susceptible to attack by both acids and
alkalis than is sapwood.
Because both species and application are extremely impor-
tant, reference to industrial sources with a specific history of
use is recommended where possible. For example, large
cypress tanks have survived long continuous use where
exposure conditions involved mixed acids at the boiling
point. Wood is also used extensively in cooling towers
because of its superior resistance to mild acids and solutions
of acidic salts.
Chemical Treatment
Wood is often treated with chemicals to enhance its fire
performance or decay resistance in service. Each set of
treatment chemicals and processes has a unique effect on the
mechanical properties of the treated wood.
Fire-retardant treatments and treatment methods distinctly
reduce the mechanical properties of wood. Some fire-
retardant-treated products have experienced significant in-
service degradation on exposure to elevated temperatures
when used as plywood roof sheathing or roof-truss lumber.
New performance requirements within standards set by the
American Standards for Testing and Materials (ASTM) and
American Wood Preservers’ Association (AWPA) preclude
commercialization of inadequately performing fire-retardant-
treated products.
Although preservative treatments and treatment methods
generally reduce the mechanical properties of wood, any
initial loss in strength from treatment must be balanced
against the progressive loss of strength from decay when
untreated wood is placed in wet conditions. The effects of
preservative treatments on mechanical properties are directly
related to wood quality, size, and various pretreatment,
treatment, and post-treatment processing factors. The key
factors include preservative chemistry or chemical type,
preservative retention, initial kiln-drying temperature, post-
treatment drying temperature, and pretreatment incising (if
required). North American design guidelines address the
effects of incising on mechanical properties of refractory wood
species and the short-term duration-of-load adjustments for
all treated lumber. These guidelines are described in
Chapter 6.
Oil-Type Preservatives
Oil-type preservatives cause no appreciable strength loss
because they do not chemically react with wood cell wall
components. However, treatment with oil-type preservatives
can adversely affect strength if extreme in-retort seasoning
parameters are used (for example, Boultonizing, steaming, or
vapor drying conditions) or if excessive temperatures or
pressures are used during the treating process. To preclude
strength loss, the user should follow specific treatment proc-
essing requirements as described in the treatment standards.
Waterborne Preservatives
Waterborne preservative treatments can reduce the mechanical
properties of wood. Treatment standards include specific
processing requirements intended to prevent or limit strength
reductions resulting from the chemicals and the waterborne
preservative treatment process. The effects of waterborne
preservative treatment on mechanical properties are related to
4–42
species, mechanical properties, preservative chemistry or
type, preservative retention, post-treatment drying tempera-
ture, size and grade of material, product type, initial kiln-
drying temperature, incising, and both temperature and
moisture in service.
Species
—The magnitude of the effect of various water-
borne preservatives on mechanical properties does not
appear to vary greatly between different species.
Mechanical property
—Waterborne preservatives affect
each mechanical property differently. If treated according to
AWPA standards, the effects are as follows: modulus of
elasticity (MOE), compressive strength parallel to grain,
and compressive stress perpendicular to grain are unaffected
or slightly increased; modulus of rupture (MOR) and ten-
sile strength parallel to grain are reduced from 0% to 20%,
depending on chemical retention and severity of redrying
temperature; and energy-related properties (for example,
work to maximum load and impact strength) are reduced
from 10% to 50%.
Preservative chemistry or type
—Waterborne preservative
chemical systems differ in regard to their effect on strength,
but the magnitude of these differences is slight compared
with the effects of treatment processing factors. Chemistry-
related differences seem to be related to the reactivity of the
waterborne preservative and the temperature during the
fixation/precipitation reaction with wood.
Retention
—Waterborne preservative retention levels of
≤
16 kg/m3 (≤1.0 lb/ft3) have no effect on MOE or compres-
sive strength parallel to grain and a slight negative effect
(−5% to −10%) on tensile or bending strength. However,
energy-related properties are often reduced from 15% to
30%. At a retention level of 40 kg/m3 (2.5 lb/ft3),
MOR and energy-related properties are further reduced.
Post-treatment drying temperature
—Air drying after
treatment causes no significant reduction in the static
strength of wood treated with waterborne preservative at a
retention level of 16 kg/m3 (1.0 lb/ft3). However, energy-
related properties are reduced. The post-treatment redrying
temperature used for material treated with waterborne pre-
servative has been found to be critical when temperatures
exceed 75 oC (167 oF). Redrying limitations in treatment
standards have precluded the need for an across-the-board
design adjustment factor for waterborne-preservative-treated
lumber in engineering design standards. The limitation on
post-treatment kiln-drying temperature is set at 74oC
(165oF).
Size of material
—Generally, larger material, specifically
thicker, appears to undergo less reduction in strength than
does smaller material. Recalling that preservative treat-
ments usually penetrate the treated material to a depth of
only 6 to 51 mm (0.25 to 2.0 in.), depending on species
and other factors, the difference in size effect appears to be
a function of the product’s surface-to-volume ratio, which
affects the relative ratio of treatment-induced weight gain
to original wood weight.
Grade of material
—The effect of waterborne preservative
treatment is a quality-dependent phenomenon. Higher
grades of wood are more affected than lower grades. When
viewed over a range of quality levels, higher quality lum-
ber is reduced in strength to a proportionately greater
extent than is lower quality lumber.
Product type
—The magnitude of the treatment effect on
strength for laminated veneer lumber conforms closely to
effects noted for higher grades of solid-sawn lumber. The
effects of waterborne preservative treatment on plywood
seem comparable to that on lumber. Fiber-based composite
products may be reduced in strength to a greater extent
than is lumber. This additional effect on fiber-based com-
posites may be more a function of internal bond damage
caused by waterborne-treatment-induced swelling rather
than actual chemical hydrolysis.
Initial kiln-drying temperature
—Although initial kiln
drying of some lumber species at 100oC to 116oC (212oF
to 240oF) for short durations has little effect on structural
properties, such drying results in more hydrolytic degrada-
tion of the cell wall than does drying at lower temperature
kiln schedules. Subsequent preservative treatment and
redrying of material initially dried at high temperatures
causes additional hydrolytic degradation. When the mate-
rial is subsequently treated, initial kiln drying at 113oC
(235oF) has been shown to result in greater reductions over
the entire bending and tensile strength distributions than
does initial kiln drying at 91oC (196oF). Because Southern
Pine lumber, the most widely treated product, is most of-
ten initially kiln dried at dry-bulb temperatures near or
above 113oC (235oF), treatment standards have imposed a
maximum redrying temperature limit of 74oC (165oF) to
preclude the cumulative effect of thermal processing.
Incising—Incising, a pretreatment mechanical process in
which small slits (incisions) are punched in the surface of
the wood product, is used to improve preservative penetra-
tion and distribution in difficult-to-treat species. Incising
may reduce strength; however, because the increase in
treatability provides a substantial increase in biological
performance, this strength loss must be balanced against
the progressive loss in strength of untreated wood from the
incidence of decay. Most incising patterns induce some
strength loss, and the magnitude of this effect is related to
the size of material being incised and the incision depth
and density (that is, number of incisions per unit area).
In less than 50 mm (2 in.) thick, dry lumber, incising and
preservative treatment induces losses in MOE of 5% to
15% and in static strength properties of 20% to 30%. In-
cising and treating timbers or tie stock at an incision den-
sity of ≤1,500 incisions/m2 (≤140 incisions/ft2) and to a
depth of 19 mm (0.75 in.) reduces strength by 5% to 10%.
4–43
In-service temperature
—Both fire-retardant and preserva-
tive treatments accelerate the thermal degradation of
bending strength of lumber when exposed to temperatures
above 54˚C (130˚F).
In-service moisture content—Current design values apply
to material dried to ≤19% maximum (15% average) mois-
ture content or to green material. No differences in strength
have been found between treated and untreated material
when tested green or at moisture contents above 12%.
When very dry treated lumber of high grade was tested at
10% moisture content, its bending strength was reduced
compared with that of matched dry untreated lumber.
Duration of load—When subjected to impact loads,
wood treated with chromated copper arsenate (CCA) does
not exhibit the same increase in strength as that exhibited
by untreated wood. However, when loaded over a long
period, treated and untreated wood behave similarly.
Polymerization
Wood is also sometimes impregnated with monomers, such
as methyl methacrylate, which are subsequently polymerized.
Many of the mechanical properties of the resultant wood–
plastic composite are higher than those of the original wood,
generally as a result of filling the void spaces in the wood
structure with plastic. The polymerization process and both
the chemical nature and quantity of monomers influence
composite properties.
Nuclear Radiation
Wood is occasionally subjected to nuclear radiation. Exam-
ples are wooden structures closely associated with nuclear
reactors, the polymerization of wood with plastic using
nuclear radiation, and nondestructive estimation of wood
density and moisture content. Very large doses of gamma
rays or neutrons can cause substantial degradation of wood.
In general, irradiation with gamma rays in doses up to about
1 megarad has little effect on the strength properties of wood.
As dosage exceeds 1 megarad, tensile strength parallel to
grain and toughness decrease. At a dosage of 300 megarads,
tensile strength is reduced about 90%. Gamma rays also
affect compressive strength parallel to grain at a dosage above
1 megarad, but higher dosage has a greater effect on tensile
strength than on compressive strength; only approximately
one-third of compressive strength is lost when the total dose
is 300 megarads. Effects of gamma rays on bending and shear
strength are intermediate between the effects on tensile and
compressive strength.
Mold and Stain Fungi
Mold and stain fungi do not seriously affect most mechanical
properties of wood because such fungi feed on substances
within the cell cavity or attached to the cell wall rather than
on the structural wall itself. The duration of infection and the
species of fungi involved are important factors in determining
the extent of degradation.
Although low levels of biological stain cause little loss in
strength, heavy staining may reduce specific gravity by 1%
to 2%, surface hardness by 2% to 10%, bending and crushing
strength by 1% to 5%, and toughness or shock resistance by
15% to 30%. Although molds and stains usually do not
have a major effect on strength, conditions that favor these
organisms also promote the development of wood-destroying
(decay) fungi and soft-rot fungi (Ch. 13). Pieces with mold
and stain should be examined closely for decay if they are
used for structural purposes.
Decay
Unlike mold and stain fungi, wood-destroying (decay) fungi
seriously reduce strength by metabolizing the cellulose
fraction of wood that gives wood its strength.
Early stages of decay are virtually impossible to detect. For
example, brown-rot fungi may reduce mechanical properties
in excess of 10% before a measurable weight loss is observed
and before decay is visible. When weight loss reaches 5% to
10%, mechanical properties are reduced from 20% to 80%.
Decay has the greatest effect on toughness, impact bending,
and work to maximum load in bending, the least effect on
shear and hardness, and an intermediate effect on other prop-
erties. Thus, when strength is important, adequate measures
should be taken to (a) prevent decay before it occurs,
(b) control incipient decay by remedial measures (Ch. 13), or
(c) replace any wood member in which decay is evident or
believed to exist in a critical section. Decay can be prevented
from starting or progressing if wood is kept dry (below 20%
moisture content).
No method is known for estimating the amount of reduction
in strength from the appearance of decayed wood. Therefore,
when strength is an important consideration, the safe proce-
dure is to discard every piece that contains even a small
amount of decay. An exception may be pieces in which decay
occurs in a knot but does not extend into the surrounding
wood.
Insect Damage
Insect damage may occur in standing trees, logs, and undried
(unseasoned) or dried (seasoned) lumber. Although damage
is difficult to control in the standing tree, insect damage can
be eliminated to a great extent by proper control methods.
Insect holes are generally classified as pinholes, grub holes,
and powderpost holes. Because of their irregular burrows,
powderpost larvae may destroy most of a piece’s interior
while only small holes appear on the surface, and the
strength of the piece may be reduced virtually to zero. No
method is known for estimating the reduction in strength
from the appearance of insect-damaged wood. When strength
is an important consideration, the safe procedure is to elimi-
nate pieces containing insect holes.
4–44
References
ASTM. [Current edition]. Standard methods for testing
small clear specimens of timber. ASTM D143-94. West
Conshohocken, PA: American Society for Testing and
Materials.
Bendtsen, B.A. 1976. Rolling shear characteristics of nine
structural softwoods. Forest Products Journal.
26(11): 51–56.
Bendtsen, B.A.; Freese, F.; Ethington, R.L. 1970. Meth-
ods for sampling clear, straight-grained wood from the forest.
Forest Products Journal. 20(11): 38–47.
Bodig, J.; Goodman, J.R. 1973. Prediction of elastic
parameters for wood. Wood Science. 5(4): 249–264.
Bodig, J.; Jayne, B.A. 1982. Mechanics of wood and wood
composites. New York: Van Nostrand Reinhold Company.
Boller, K.H. 1954. Wood at low temperatures. Modern
Packaging. 28(1): 153–157.
Chudnoff, M. 1987. Tropical timbers of the world. Agric.
Handb. 607. Washington DC: U.S. Department of
Agriculture.
Coffey, D.J. 1962. Effects of knots and holes on the fatigue
strength of quarter-scale timber bridge stringers. Madison,
WI: University of Wisconsin, Department of Civil
Engineering. M.S. Thesis.
Gerhards, C.C. 1968. Effects of type of testing equipment
and specimen size on toughness of wood. Res. Pap. FPL–
RP–97. Madison, WI: U.S. Department of Agriculture,
Forest Service, Forest Products Laboratory.
Gerhards, C.C. 1977. Effect of duration and rate of loading
on strength of wood and wood based materials. Res. Pap.
FPL–RP–283. Madison, WI: U.S. Department of Agricul-
ture, Forest Service, Forest Products Laboratory.
Gerhards, C.C. 1979. Effect of high-temperature drying on
tensile strength of Douglas-fir 2 by 4’s. Forest Products
Journal. 29(3): 39–46.
Gerhards, C.C. 1982. Effect of moisture content and tem-
perature on the mechanical properties of wood: an analysis of
immediate effects. Wood and Fiber. 14(1): 4–36.
Green, D.W.; Evans, J.W. 1994. Effect of ambient tem-
peratures on the flexural properties of lumber. In: PTEC 94
Timber shaping the future: Proceedings, Pacific timber engi-
neering conference; 1994 July 11–15; Gold Coast, Australia.
Fortitude Valley MAC, Queensland, Australia: Timber
Research Development and Advisory Council: 190–197.
Vol. 2.
Green, D.W.; Rosales, A. 1996. Property relationships for
tropical hardwoods. In: Proceedings, international wood
engineering conference ; 1996 October 21–31; New Orleans,
LA. Madison, WI: Forest Products Society: 3-516–3-521.
Green, D.W.; Shelley, B.E.; Vokey, H.P. (eds). 1989.
In-grade testing of structural lumber. Proceedings 47363.
Madison, WI: Forest Products Society.
Hearmon, R.F.S. 1948. The elasticity of wood and ply-
wood. Special Rep. 7. London, England: Department of
Scientific and Industrial Research, Forest Products Research.
Hearmon, R.F.S. 1961. An introduction to applied aniso-
tropic elasticity. London, England: Oxford University Press.
Kingston, R.S.T. 1962. Creep, relaxation, and failure of
wood. Research Applied in Industry. 15(4).
Kollmann, F.F.P.; Cote, W.A., Jr. 1968. Principles of
wood science and technology. New York: Springer Verlag.
Koslik, C.J. 1967. Effect of kiln conditions on the strength
of Douglas-fir and western hemlock. Rep. D–9. Corvallis,
OR: Oregon State University, School of Forestry, Forestry
Research Laboratory.
Little, E.L., Jr. 1979. Checklist of United States trees
(native and naturalized). Agric. Handb. 541. Washington,
DC: U.S. Department of Agriculture.
Kretschmann, D.E.; Bendtsen, B.A. 1992. Ultimate
tensile stress and modulus of elasticity of fast-grown planta-
tion loblolly pine lumber. Wood and Fiber Science. 24(2):
189–203.
Kretschmann, D.E.; Green, D.W. 1996. Modeling mois-
ture content–mechanical property relationships for clear
Southern Pine. Wood and Fiber Science. 28(3): 320–337.
Kretschmann, D.E.; Green, D.W.; Malinauskas, V.
1991. Effect of moisture content on stress intensity factors in
Southern Pine. In: Proceedings, 1991 international timber
engineering conference; 1991 September 2–5; London.
London: TRADA: 3.391–3.398. Vol. 3.
LeVan, S.L.; Winandy, J.E. 1990. Effects of fire-retardant
treatments on wood strength: a review. Wood and Fiber
Science. 22(1): 113–131.
MacLean, J.D. 1953. Effect of steaming on the strength of
wood. American Wood-Preservers’ Association. 49: 88–112.
MacLean, J.D. 1954. Effect of heating in water on the
strength properties of wood. American Wood-Preservers’
Association. 50: 253–281.
Mallory, M.P.; Cramer S. 1987. Fracture mechanics: a tool
for predicting wood component strength. Forest Products
Journal. 37(7/8): 39–47.
Mark, R.E.; Adams, S.F.; Tang, R.C. 1970. Moduli of
rigidity of Virginia pine and tulip poplar related to moisture
content. Wood Science. 2(4): 203–211.
McDonald, K.A.; Bendtsen, B.A. 1986. Measuring local-
ized slope of grain by electrical capacitance. Forest Products
Journal. 36(10): 75–78.
4–45
McDonald, K.A.; Hennon, P.E.; Stevens, J.H.;
Green, D.W. 1997. Mechanical properties of salvaged
yellow-cedar in southeastern Alaska—Phase I. Res. Pap.
FPL–RP–565. Madison, WI: U.S. Department of Agricul-
ture, Forest Service, Forest Products Laboratory.
Millett, M.A.; Gerhards, C.C. 1972. Accelerated aging:
residual weight and flexural properties of wood heated in air
at 115°C to 175°C. Wood Science. 4(4): 193–201.
Nicholas, D.D. 1973. Wood deterioration and its prevention
by preservative treatments. Vol. I. Degradation and protec-
tion of Wood. Syracuse, NY: Syracuse University Press.
Pillow, M.Y. 1949. Studies of compression failures and their
detection in ladder rails. Rep. D 1733. Madison, WI: U.S.
Department of Agriculture, Forest Service, Forest Products
Laboratory.
Sliker, A.; Yu, Y. 1993. Elastic constants for hardwoods
measured from plate and tension tests. Wood and Fiber
Science. 25(1): 8–22.
Sliker, A.; Yu, Y.; Weigel, T.; Zhang, W. 1994. Ortho-
tropic elastic constants for eastern hardwood species. Wood
and Fiber Science. 26(1): 107–121.
Soltis, L.A.; Winandy J.E. 1989. Long-term strength of
CCA-treated lumber. Forest Products Journal. 39(5): 64–68.
Timell, T.E. 1986. Compression wood in gymnosperms.
Vol. I–III. Berlin: Springer–Verlag.
U. S. Department of Defense. 1951. Design of wood air-
craft structures. ANC–18 Bull. Subcommittee on Air Force–
Navy Civil Aircraft, Design Criteria Aircraft Commission.
2d ed. Munitions Board Aircraft Committee.
Wangaard, F.F. 1966. Resistance of wood to chemical
degradation. Forest Products Journal. 16(2): 53–64.
Wilcox, W.W. 1978. Review of literature on the effects of
early stages of decay on wood strength. Wood and Fiber.
9(4): 252–257.
Wilson, T.R.C. 1921. The effect of spiral grain on the
strength of wood. Journal of Forestry. 19(7): 740–747.
Wilson, T.R.C. 1932. Strength-moisture relations for wood.
Tech. Bull. 282. Washington, DC: U.S. Department of
Agriculture.
Winandy, J.E. 1995a. Effects of waterborne preservative
treatment on mechanical properties: A review. In: Proceed-
ings, 91st annual meeting of American Wood Preservers’
Association; 1995, May 21–24; New York, NY. Wood-
stock, MD: American Wood Preservers’ Association.
91: 17–33.
Winandy, J.E. 1995b. The Influence of time-to-failure on
the strength of CCA-treated lumber. Forest Products Journal.
45(2): 82–85.
Winandy, J.E. 1995c. Effects of moisture content on
strength of CCA-treated lumber. Wood and Fiber Science.
27(2): 168–177.
Winandy, J.E. 1994. Effects of long-term elevated tempera-
ture on CCA-treated Southern Pine lumber. Forest Products
Journal. 44(6): 49–55.
Winandy, J.E.; Morrell, J.J. 1993. Relationship between
incipient decay, strength, and chemical composition of
Douglas-fir heartwood. Wood and Fiber Science.
25(3): 278–288.
Woodfin, R.O.; Estep, E.M. (eds). 1978. In: The dead
timber resource. Proceedings, 1978 May 22–24, Spokane,
WA. Pullman, WA: Engineering Extension Service,
Washington State University.
From
Forest Products Laboratory. 1999. Wood handbook—Wood as an engineering material.
Gen. Tech. Rep. FPL–GTR–113. Madison, WI: U.S. Department of Agriculture, Forest Service,
Forest Products Laboratory. 463 p.
Many of the mechanical properties of wood tabulated in this
chapter were derived from extensive sampling and analysis
procedures. These properties are represented as the average
mechanical properties of the species. Some properties, such
as tension parallel to the grain, and all properties for some
imported species are based on a more limited number of
specimens that were not subjected to the same sampling and
analysis procedures. The appropriateness of these latter prop-
erties to represent the average properties of a species is uncer-
tain; nevertheless, the properties represent the best informa-
tion available.
Sarnased õppematerjalid
![ABS Piping Australian Presentation]()
92
ppt
ABS Piping Australian Presentation
A Course In the Design of ABS Piping
Our Objectives
Presented by Geoffrey D Stone FIMechE C.Eng
http://waterhammer.hopout.com.au/
Provide an insight into what piping
designers need & expect
Define the role of the supplier & designer
Learn some fundamentals of piping design
Discover failure analysis techniques
Share experiences of problems
�A Course In the Design of ABS Piping
What We Shall Look at This Week
ABS Material Properties
Thermoplastic Pipe Design
Waterhammer Analysis
Typical Applications of ABS Pressure Pipe
Some Anticipated Events
�Stages of the Design Process
Representation-Drawings & Specification
Calculation-Engineering & Assumptions
Visualisation-Presentation of Information
Validation-Testing & Commissioning
�Role of the ABS Pipe Supplier
What the Customer Expects Avoid the following:
Material Properties Accept design risk for a sale
Design Criteria Accept MTO risk
![Structural Testing Of Homebuilt Aircraft]()
8
pdf
Structural Testing Of Homebuilt Aircraft
not fall apart immediately upon only slightly increase the load. his wing for bending of the main spar
exceeding the allowed "limit" loads. Maybe the next pound will break the and for the torsional strength and
Well, there is a certain degree of wing? How close to the breaking stiffness of the wing skin, the horizon-
safety built into an aluminum or wood point is a wing? The mere fact that tal tail and the vertical tail for the
structure . . . inherent in its ability to the composite wing shows an excel- bending and, in connection with the
deform beyond the yield point, per- lent linearity between the loads two previous tests, the bending and
34 MARCH 1992
![Sunflower]()
31
doc
Sunflower
It
is a combination of monounsaturated and polyunsaturated fats
with low saturated fat levels.
The versatility of this healthy oil is recognized by cooks
internationally. Sunflower oil is valued for its light taste, frying
performance and health benefits.
There are three types of sunflower oil available; NuSun, linoleic
and high oleic sunflower oil. All are developed with standard
breeding techniques. They differ in oleic levels and each one
offers unique properties.
With three types of sunflower oil available, sunflower oil meets the needs of consumer
and food manufacturers alike for a healthy and high performance non-transgenic
vegetable oil.
�Sunflower plantings, production, and supply and
disappearance activities throughout the world are ever-
changing. Statistics provide persons with a vested interest in
the industry a foundation of where we've been in order to
help us understand where we need to go. Use the Sunflower
Ökoloogia ja keskkonnakaitse1
![Liha töötlemine]()
1168
pdf
Liha töötlemine
scope, distinct banding patterns or striations now being discovered.
are observed. This appearance is due to spe- The structure of the sarcomere is respon-
cialized organelles, myofibrils, found in sible for the striated appearance of the muscle
muscle cells. The myofibrils have a striated, cell. The striations arise from the alternating,
or banded, appearance because different protein dense A-bands and less dense I-bands
regions have different refractive properties. within the myofibril. Bisecting the I-bands
The light bands have a consistent index of are dark lines known as Z-lines. The structure
refraction (isotropic). Therefore, these bands between two Z-lines is the sarcomere. In a
are called I-bands in reference to this isotro- relaxed muscle cell, the distance between
pic property. The dark band appears dark two Z-lines (and thus the length of the sarco-
![Inglise keel unit 5 answers]()
276
docx
Inglise keel unit 5 answers
1. (a) (i) gene
length of DNA;
codes for a (specific), polypeptide / protein / RNA; max 1
allele
alternative form of a gene;
found at a, locus / particular position on, a chromosome; max 1
(ii) assume allele refers to coat colour allele
(coat colour) gene / alleles, only on X chromosome;
A no (coat colour), gene / allele, on Y chromosome
male cats, XY / only have one X chromosome;
males have only one (coat colour) allele / cannot have two (coat colour)
alleles;
need black and orange alleles for tortoiseshell colour; 2
r r w w
(b) parental genotypes C C × C C ;
r w
gametes C , C ;
F1 genotypes and pheno
![Fitness In Soccer]()
409
pdf
Fitness In Soccer
[email protected] 06 Aug 2018
FITNESS IN SOCCER
THE SCIENCE AND PRACTICAL APPLICATION
Jan Van Winckel, Werner Helsen, Kenny McMillan,
David Tenney, Jean-Pierre Meert, Paul Bradley
�[email protected] 06 Aug 2018
Isbn-number : 9789082132304
Publisher: Moveo Ergo Sum / Klein-Gelmen
Proofreading: Jim Newall Quill Content |Writing, Editing and Web site services http://www.quillsites.co.uk
Photos: Jean Leemans and Etienne Claessens
Cover and lay-out: Dots & Bits
© 2014 Jan Van Winckel
Printed and bound at Manipal Technologies Ltd., India
All rights reserved. No pa
![Soil microflora]()
10
docx
Soil microflora
Biology and Fertility of Soils, 48(6), 709725.
doi:10.1007/s00374-012-0670-9
Barabasz, W., Albiska, D., Jakowska, M., Lipiec, J., 2002 - Biological effects of mineral
nitrogen fertilization on soil microorganisms, Polish Journal of Environmental Studies,
vol. 11, No. 3, p. 193-198.
Canbolat, M. Y., Bilen, S., Çakmakçý, R., Þahin, F., & Aydýn, A. (2005). Effect of plant
growth-promoting bacteria and soil compaction on barley seedling growth, nutrient
uptake, soil properties and rhizosphere microflora. Biology and Fertility of Soils, 42(4),
350357. doi:10.1007/s00374-005-0034-9
Halász, J. L., Kotroczo, Z., Krausz, E., Tóth, M. D., & Balázsy, S. (2011). EFFECT OF
POLLUTION IN THE FLORA , MICROFLORA AND SOIL ENzYME ACTIVITIES
NEAR TO THE UPPER-TISzA, 21(4), 803811.
Kausadikar, H. K., & Ssac, A. O. F. (n.d.). Definition of Soil Microbiology & soil in view of
Microbiology Rajan Bhatt, Krishi Vigyan Kendra, Kapurthala (Punjab).
http://www
![Bridges presentation]()
22
docx
Bridges presentation
Since the beginning of time, the goal of bridge builders has been to create as wide a span as possible
which is commodious, firm, and occasionally delightful. Spanning greater distances is a distinct
measure of engineering prowess.
In terms of engineering, bridges are discussed by design or type (beam, arch, truss, cantilever,
suspension, or moveable); length (usually expressed in terms of clear or overall span); and materials
(stone, wood, cast and wrought iron, and what we use today - concrete and steel). The purpose of
this contextual essay is to provide parameters of value and significance so that we can focus our
attention on those bridges - globally - that best illustrate the history of bridge building, and to
encourage their preservation.
What is a World Heritage bridge? The World Heritage Committee states that to be of World Heritage
status a monument or site must be of outstanding universal value
Meedia
Kommentaarid (0)


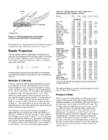
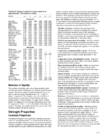
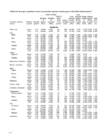
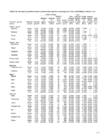
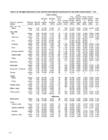
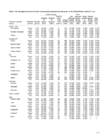
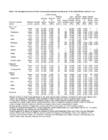
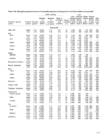
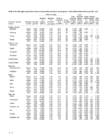
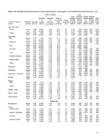
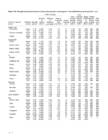
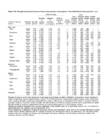
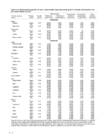
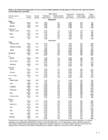
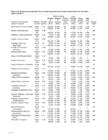
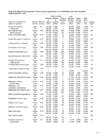
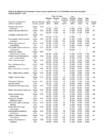
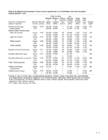
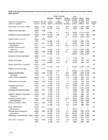
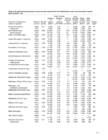
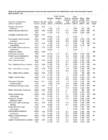
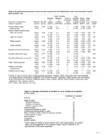
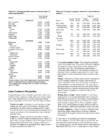
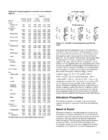
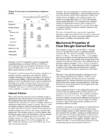
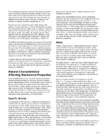
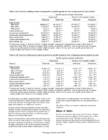
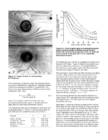
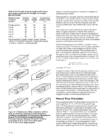
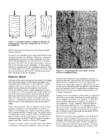
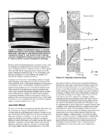
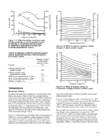
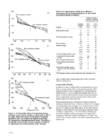
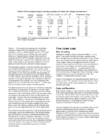
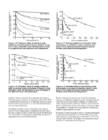
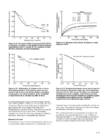
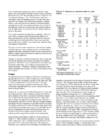
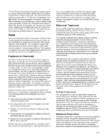


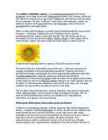

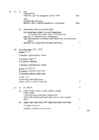

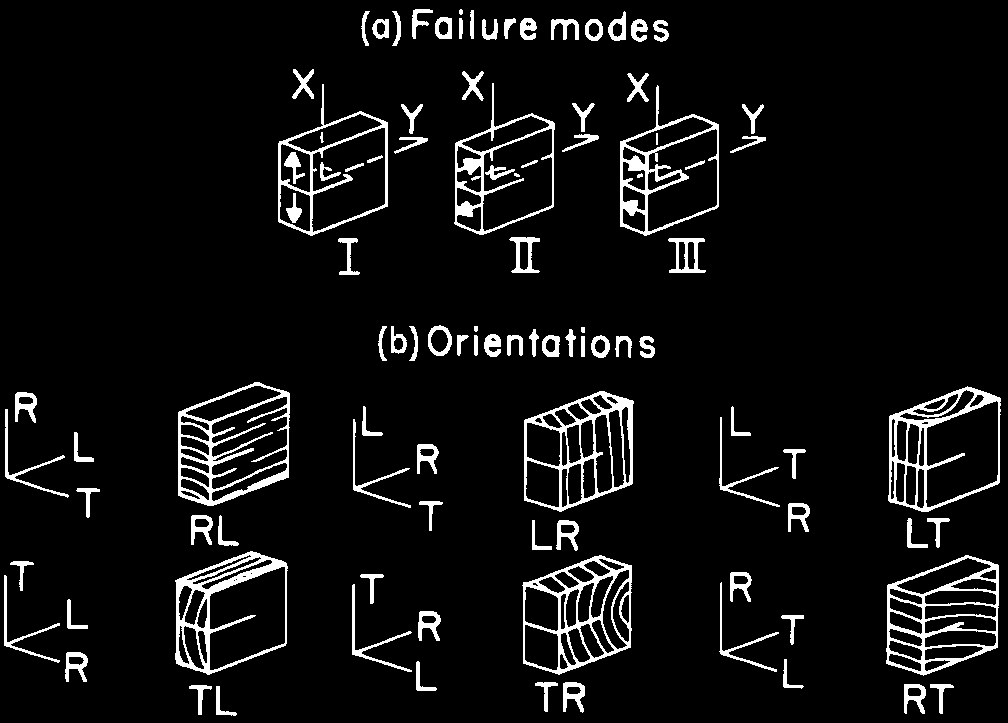
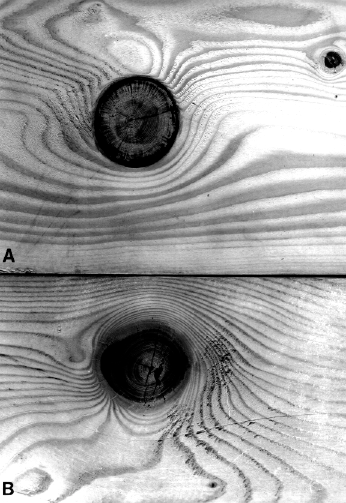

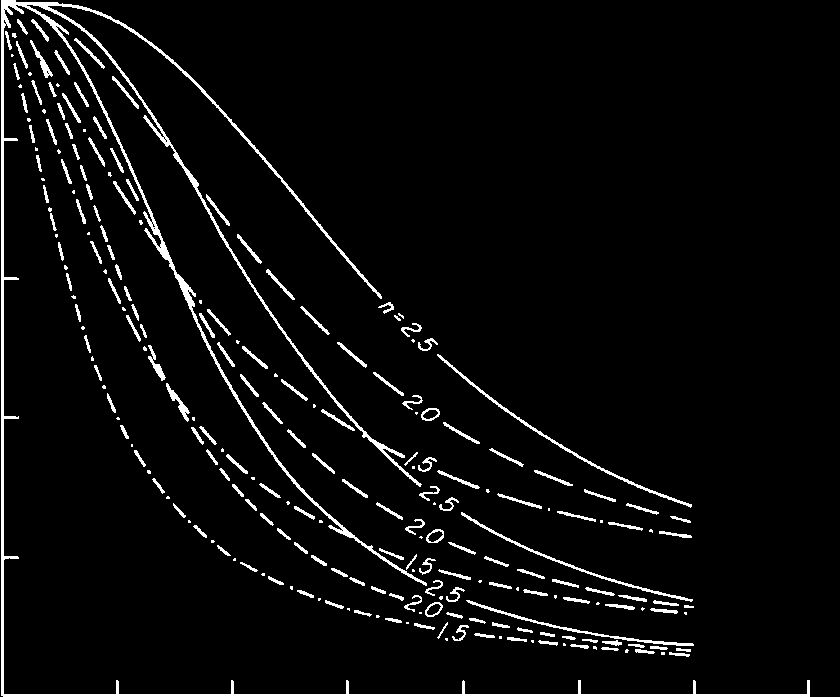

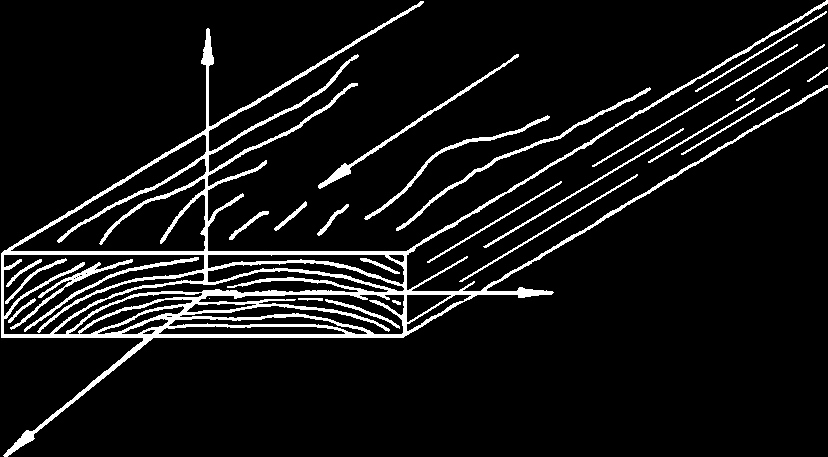
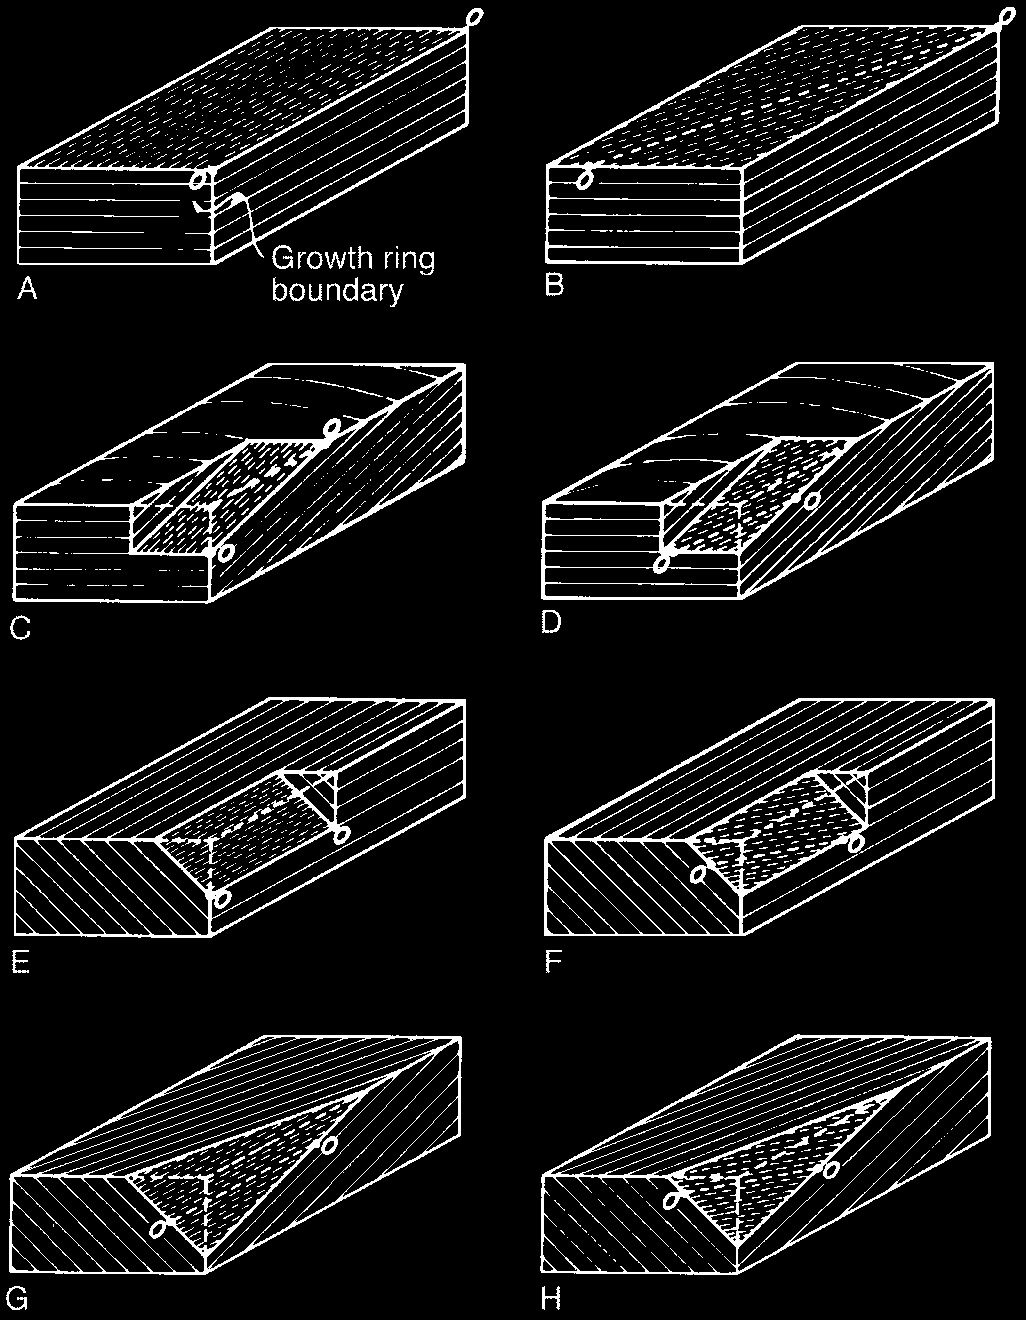
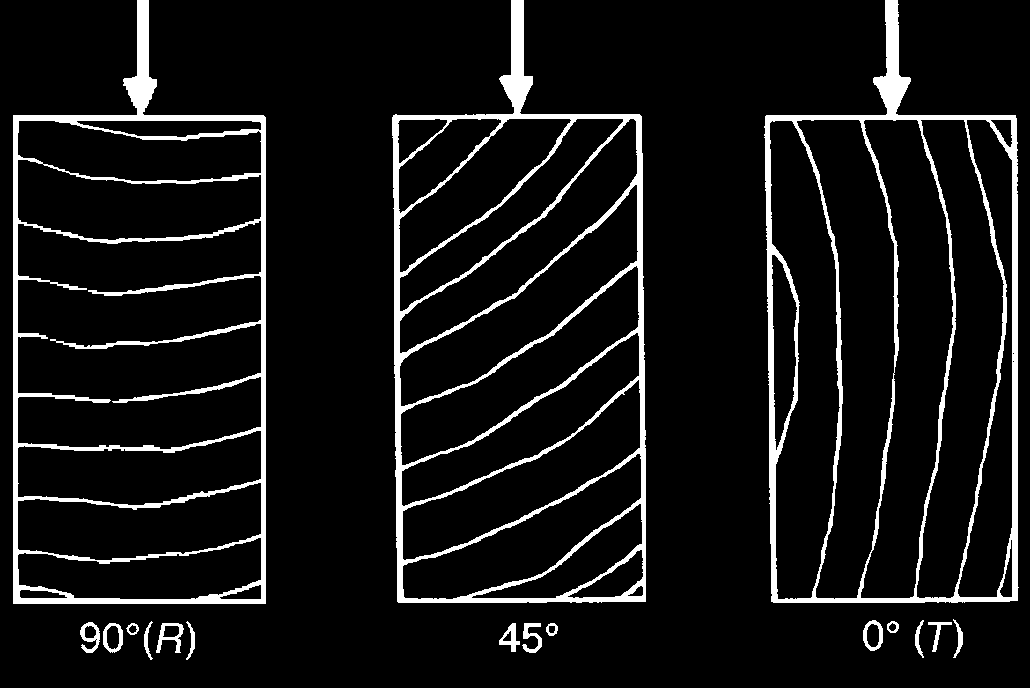
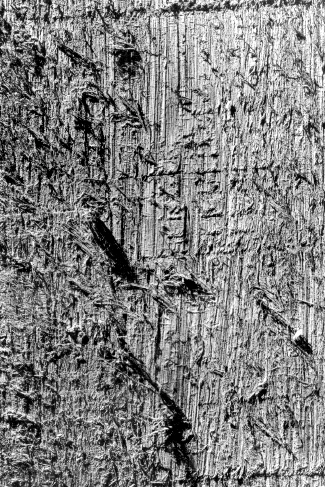
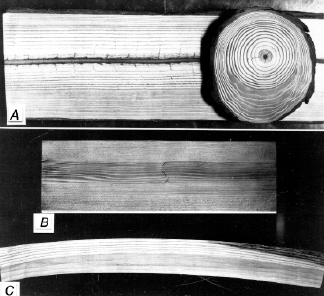

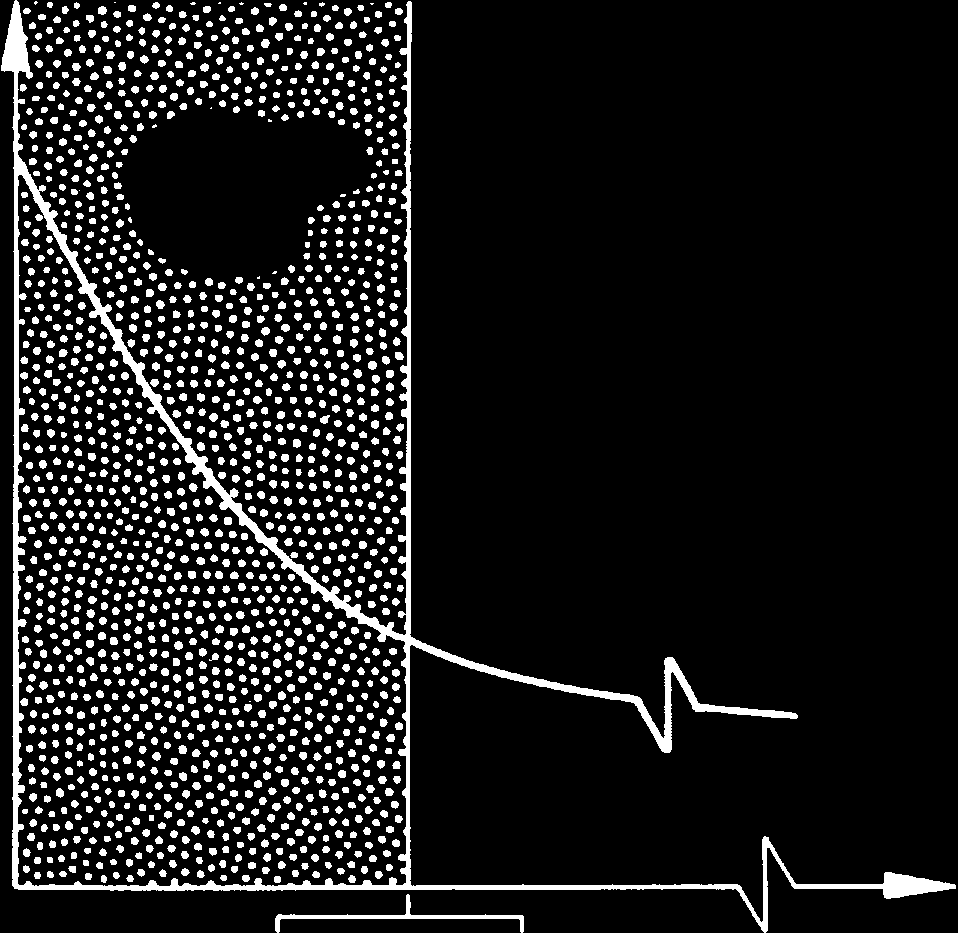

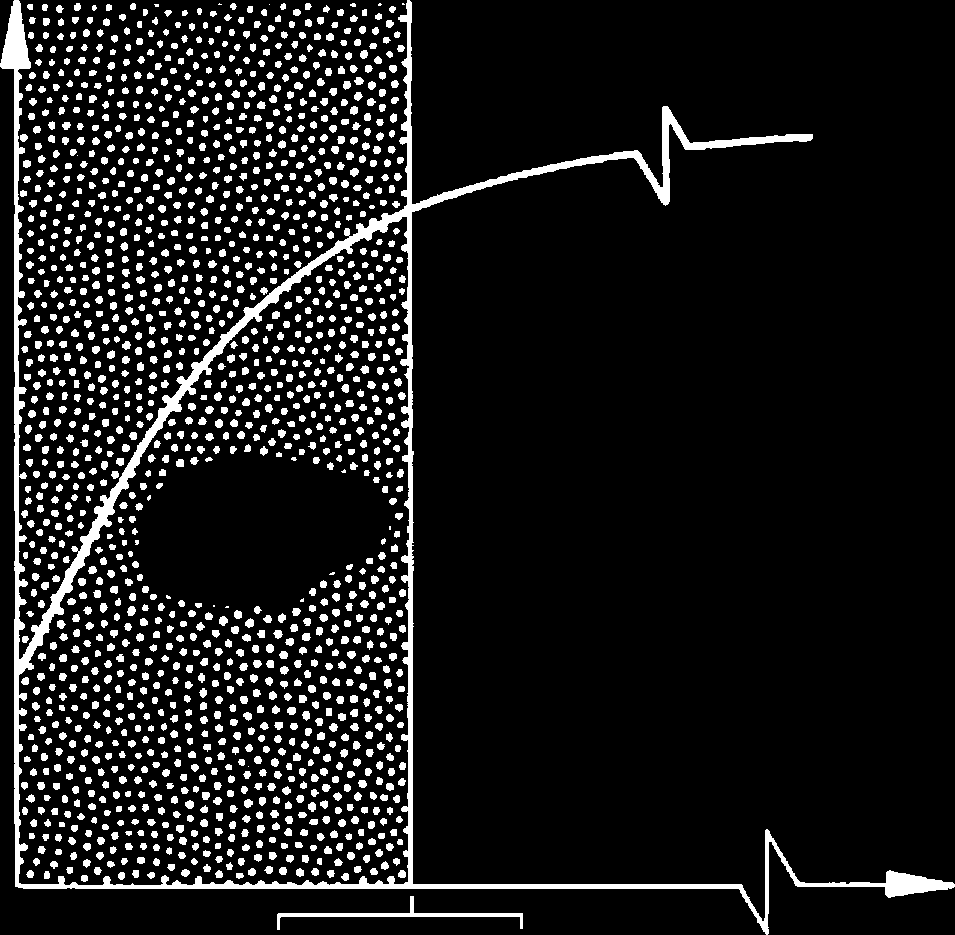
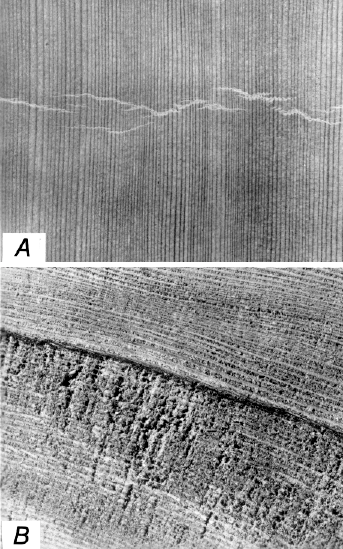

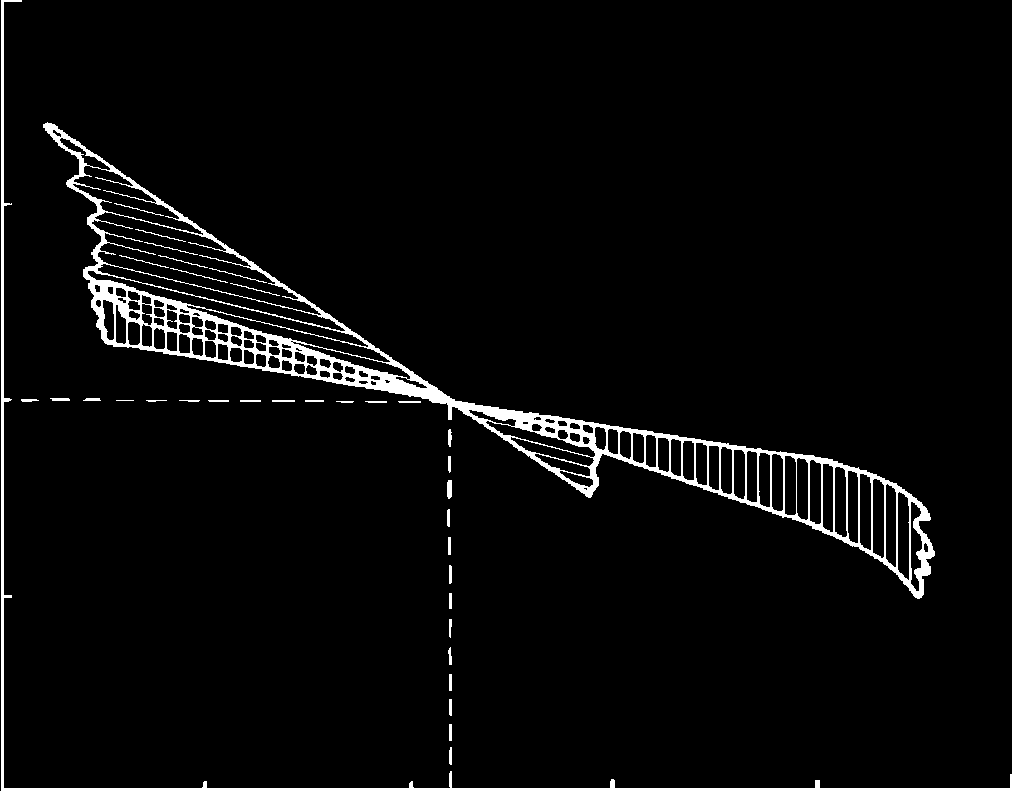

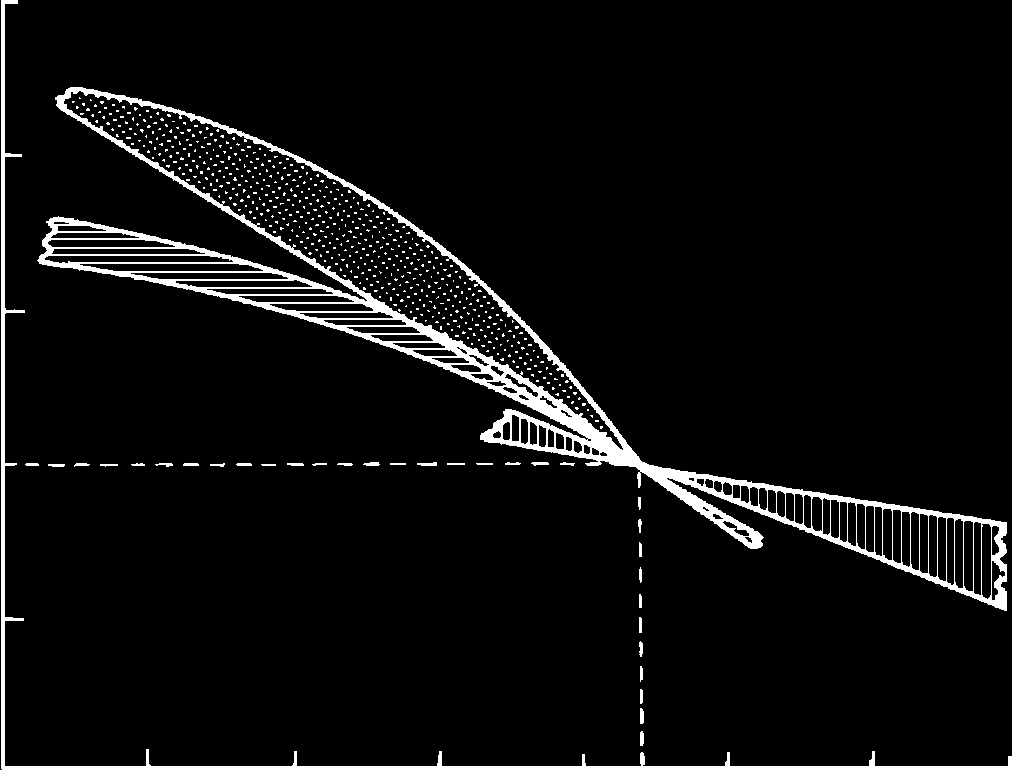


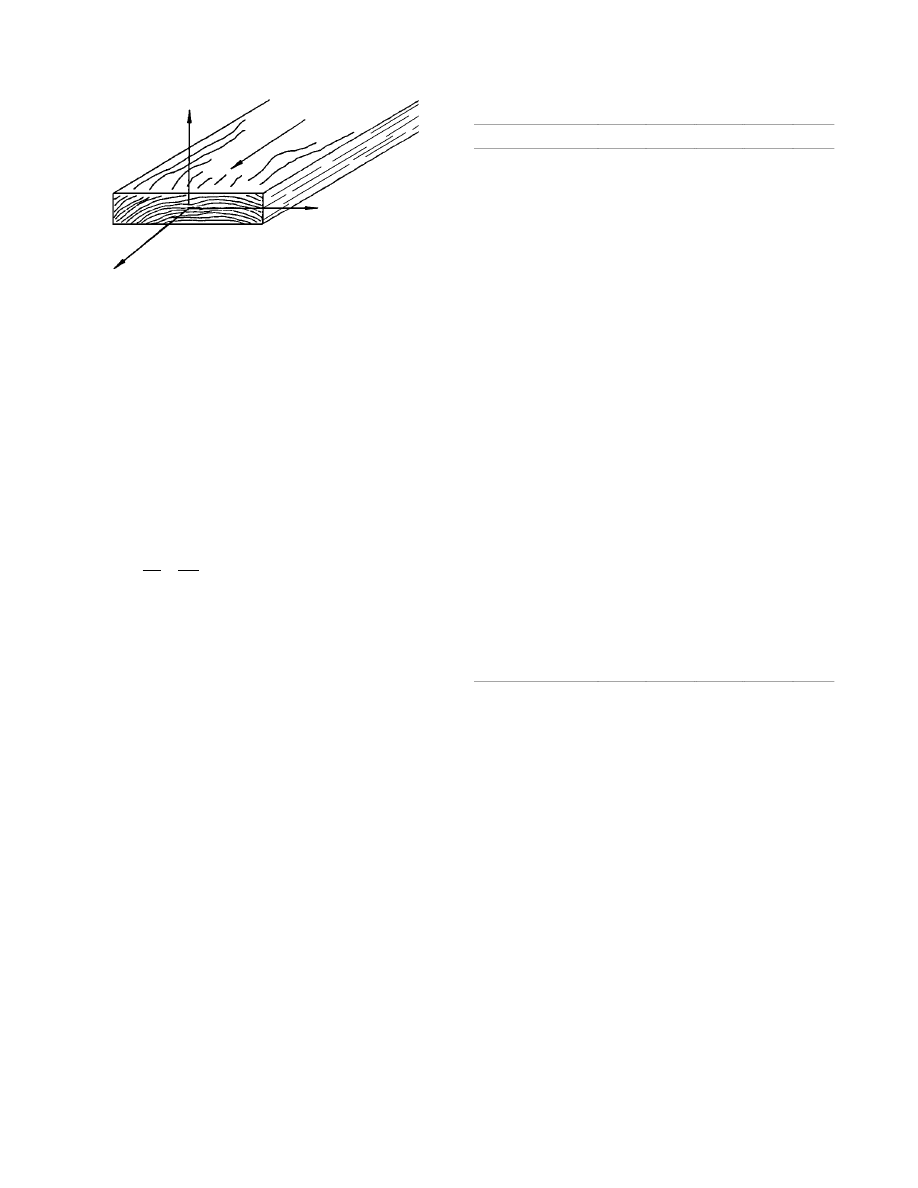


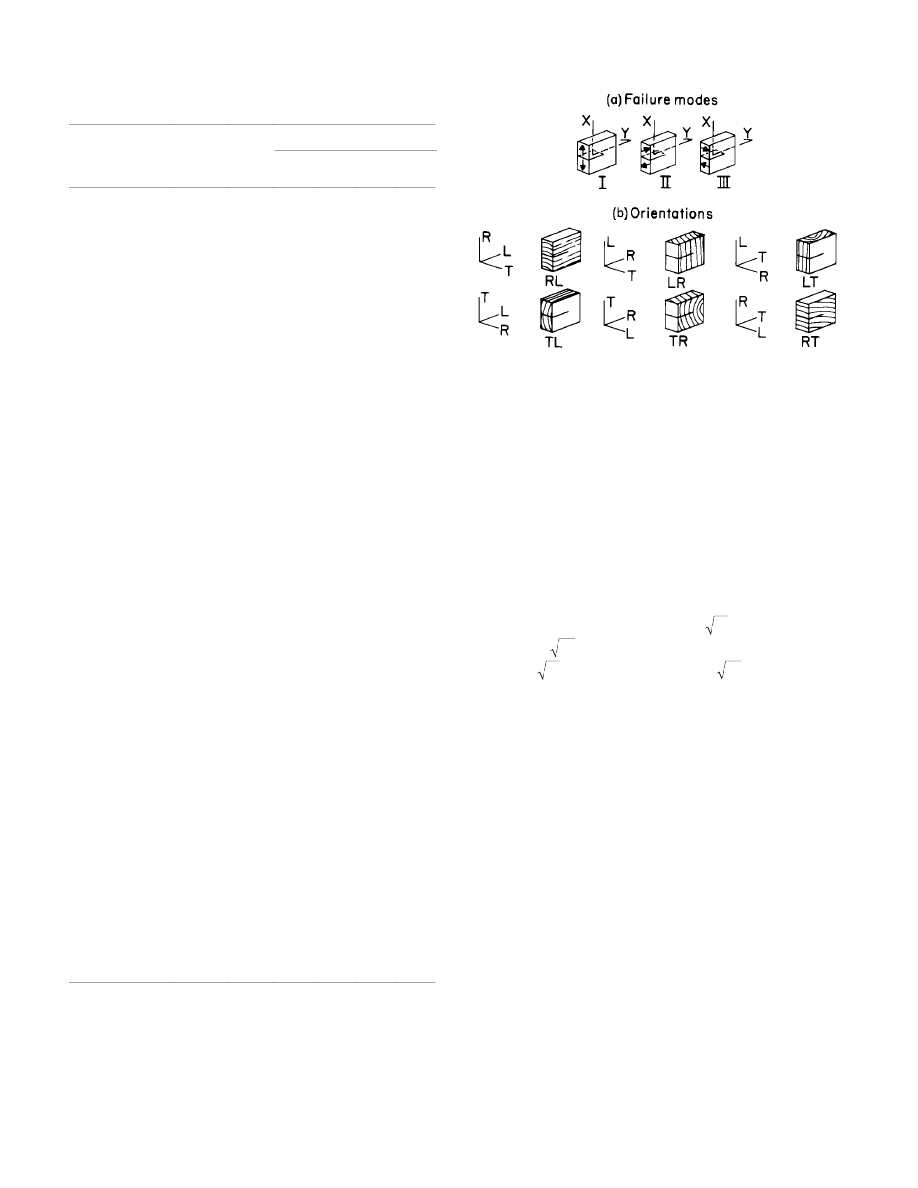


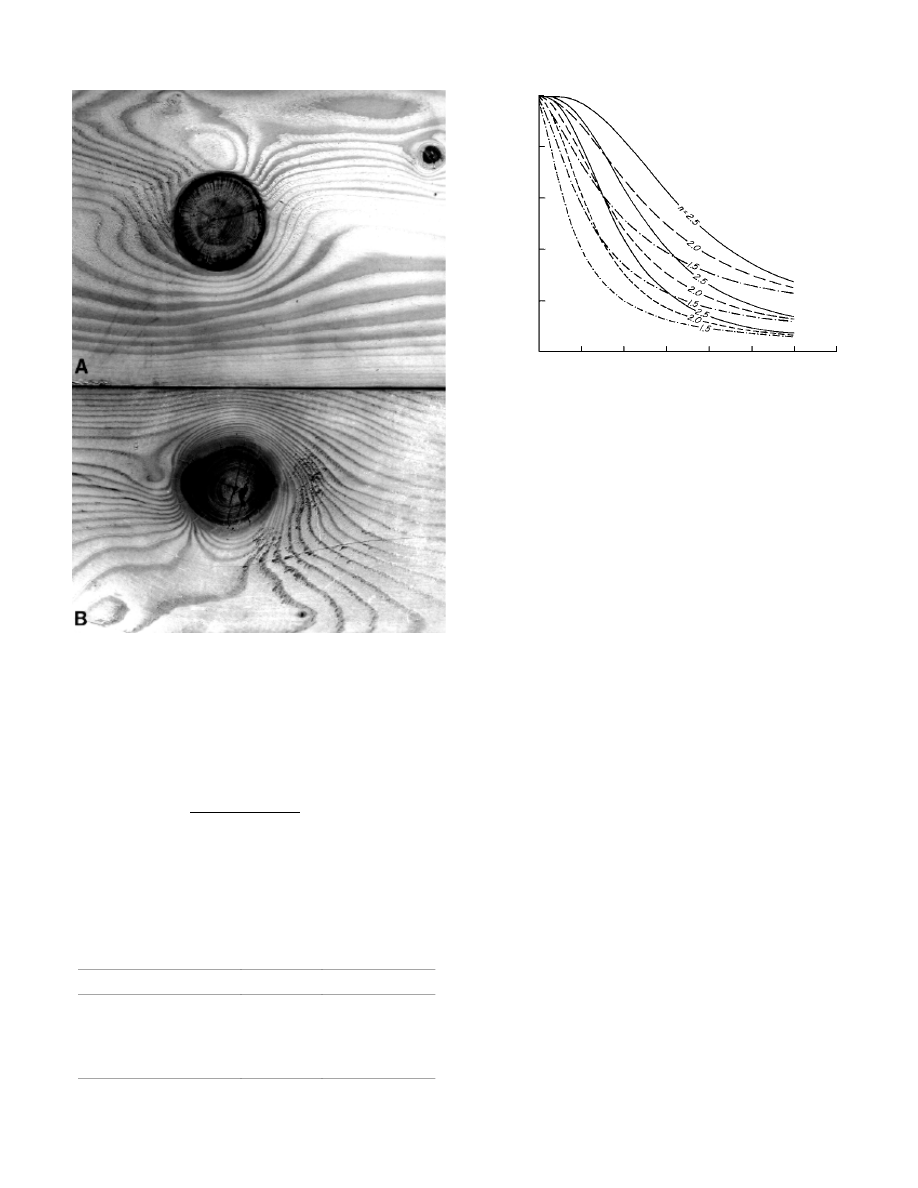
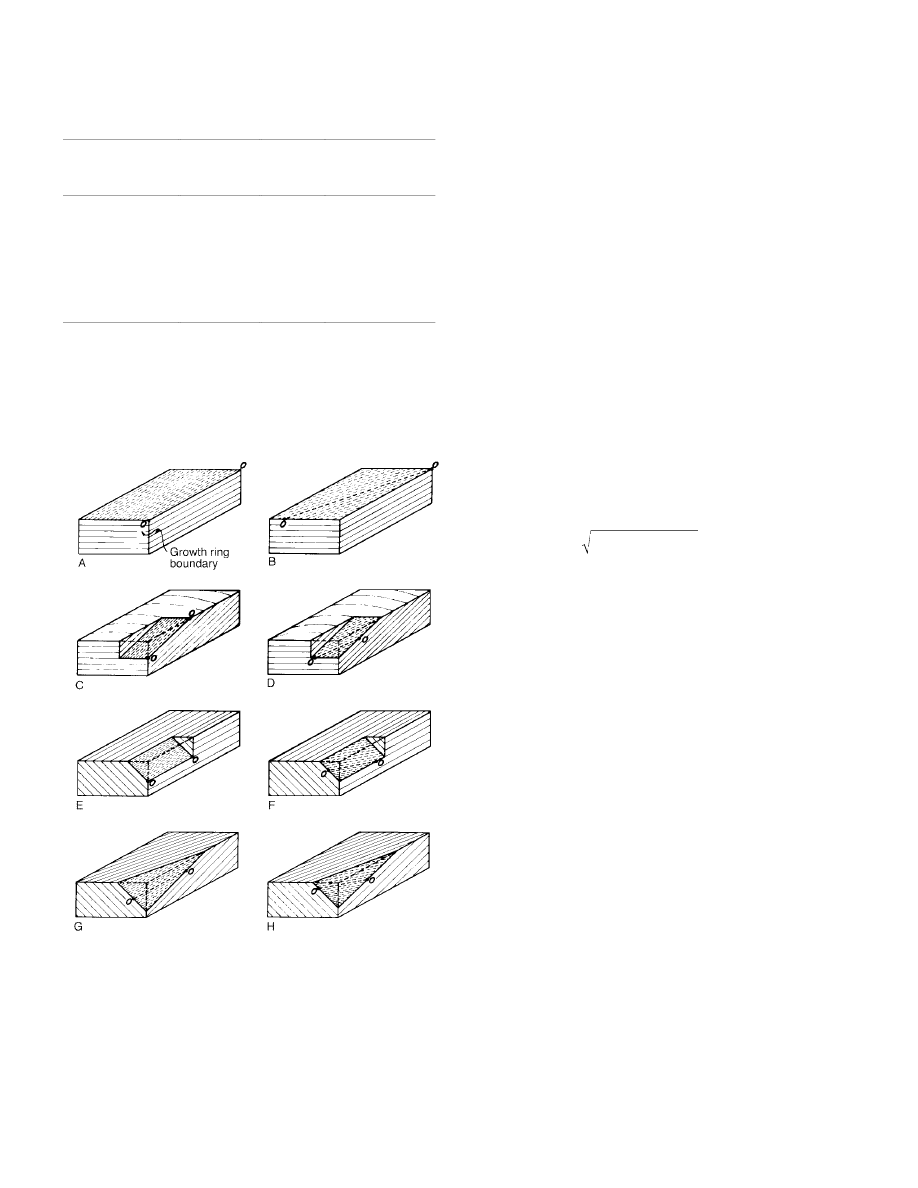
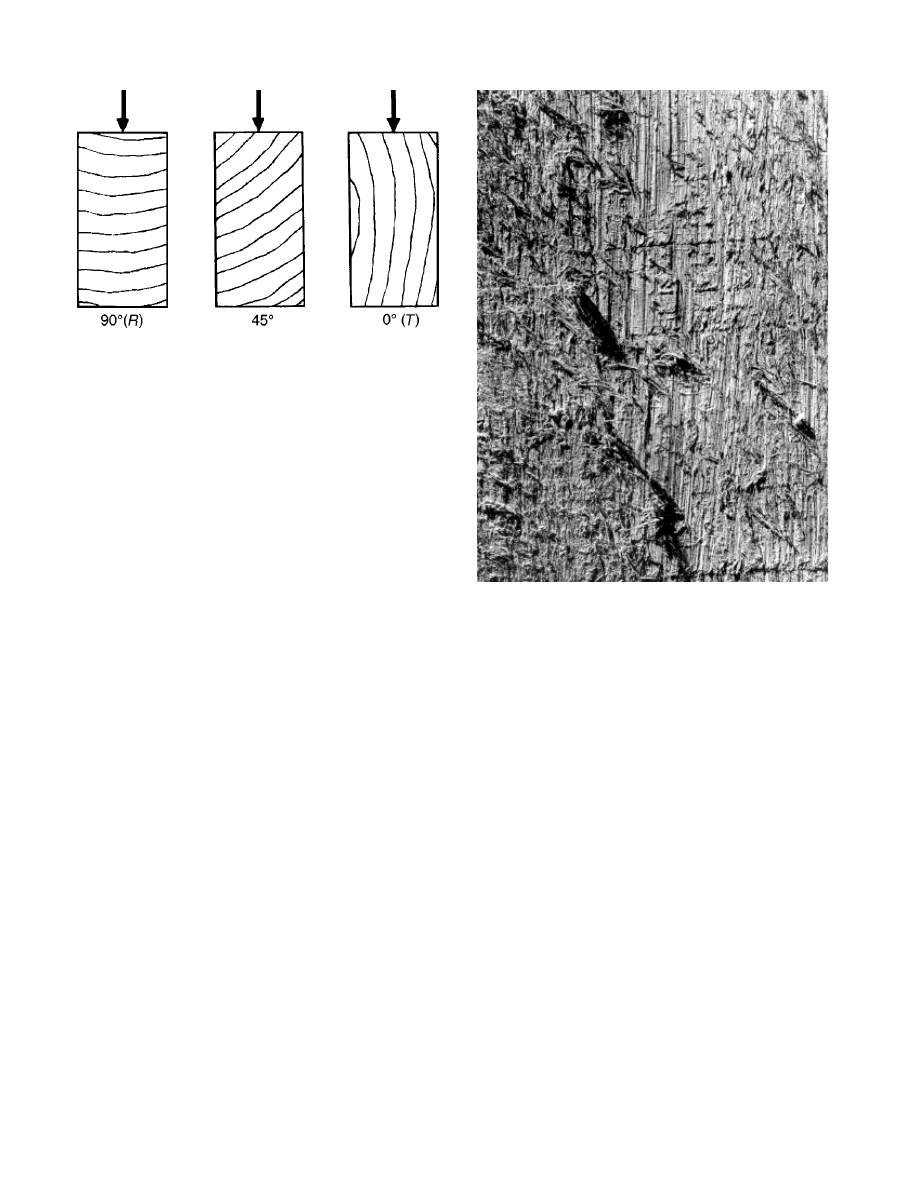
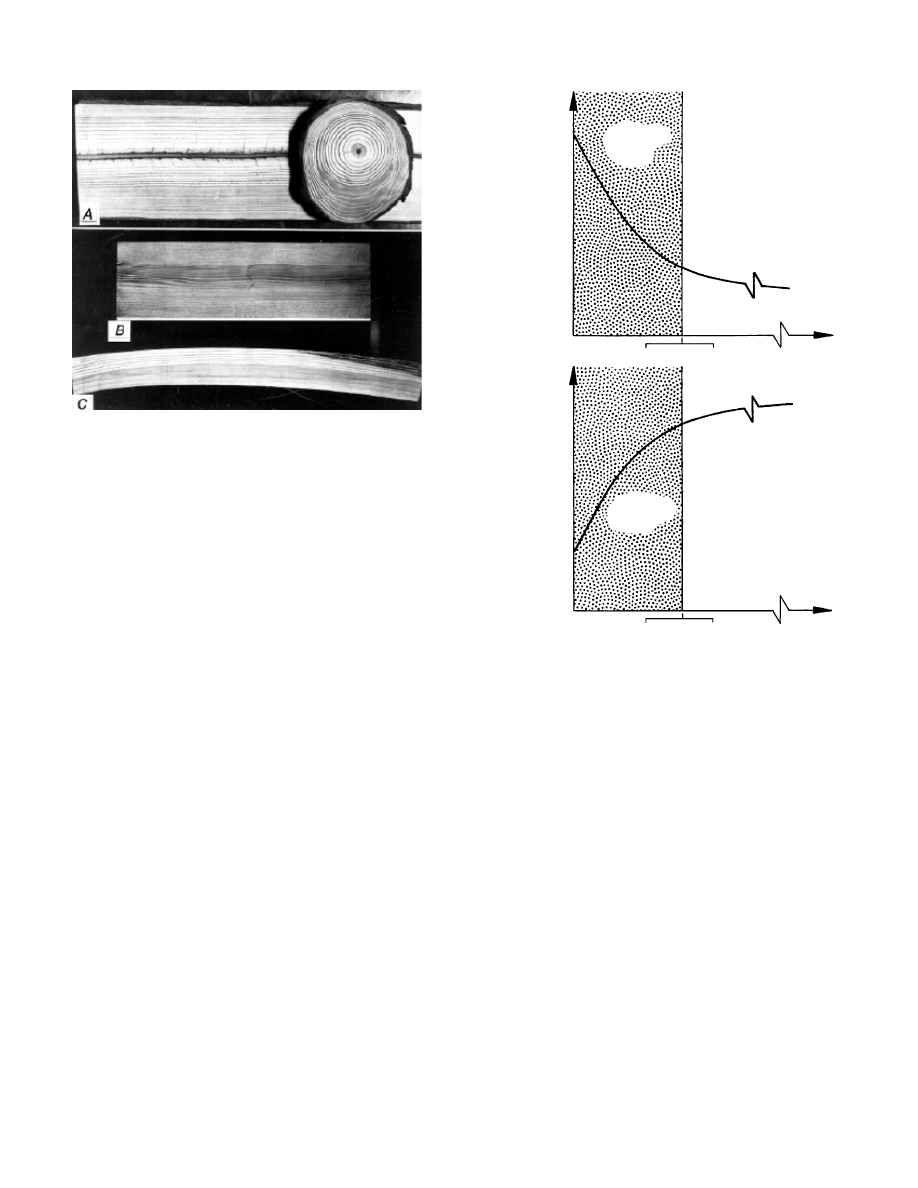
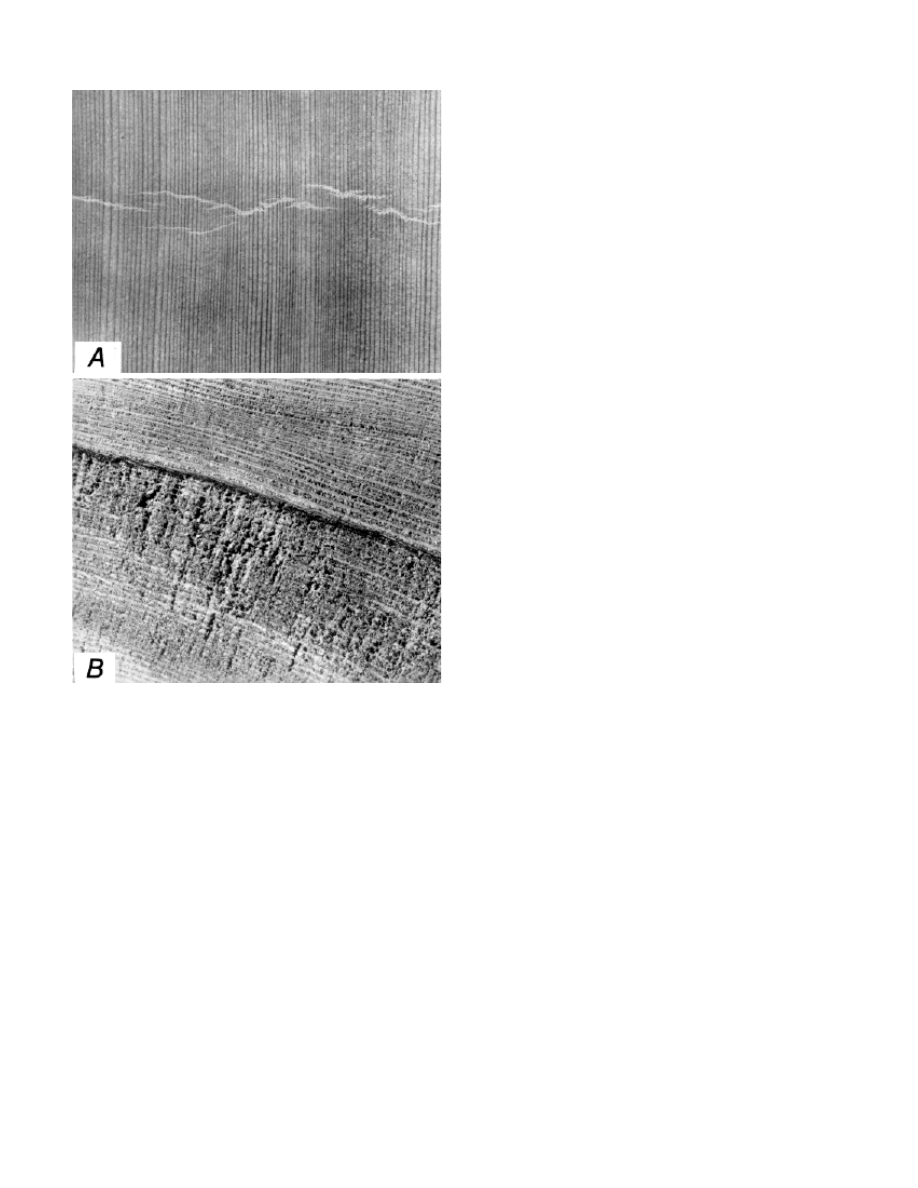

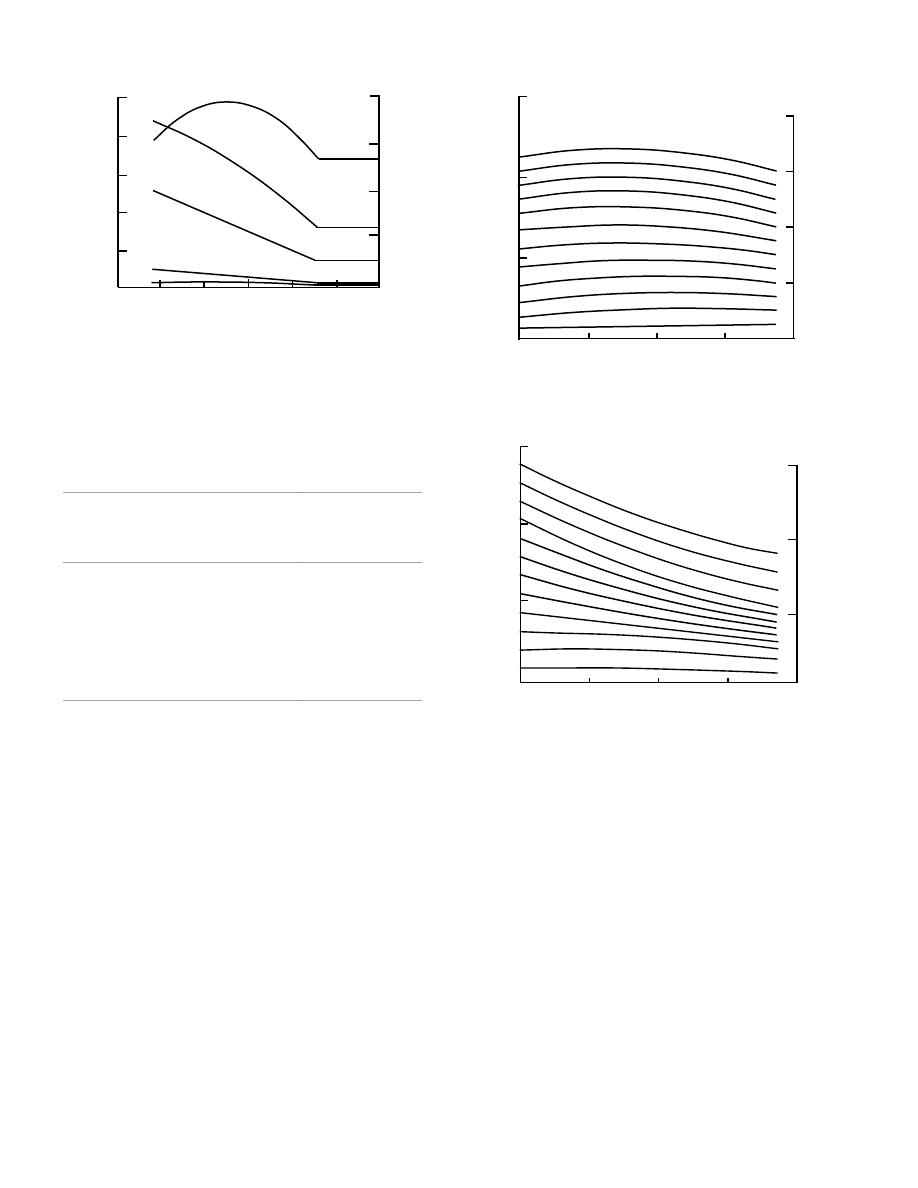
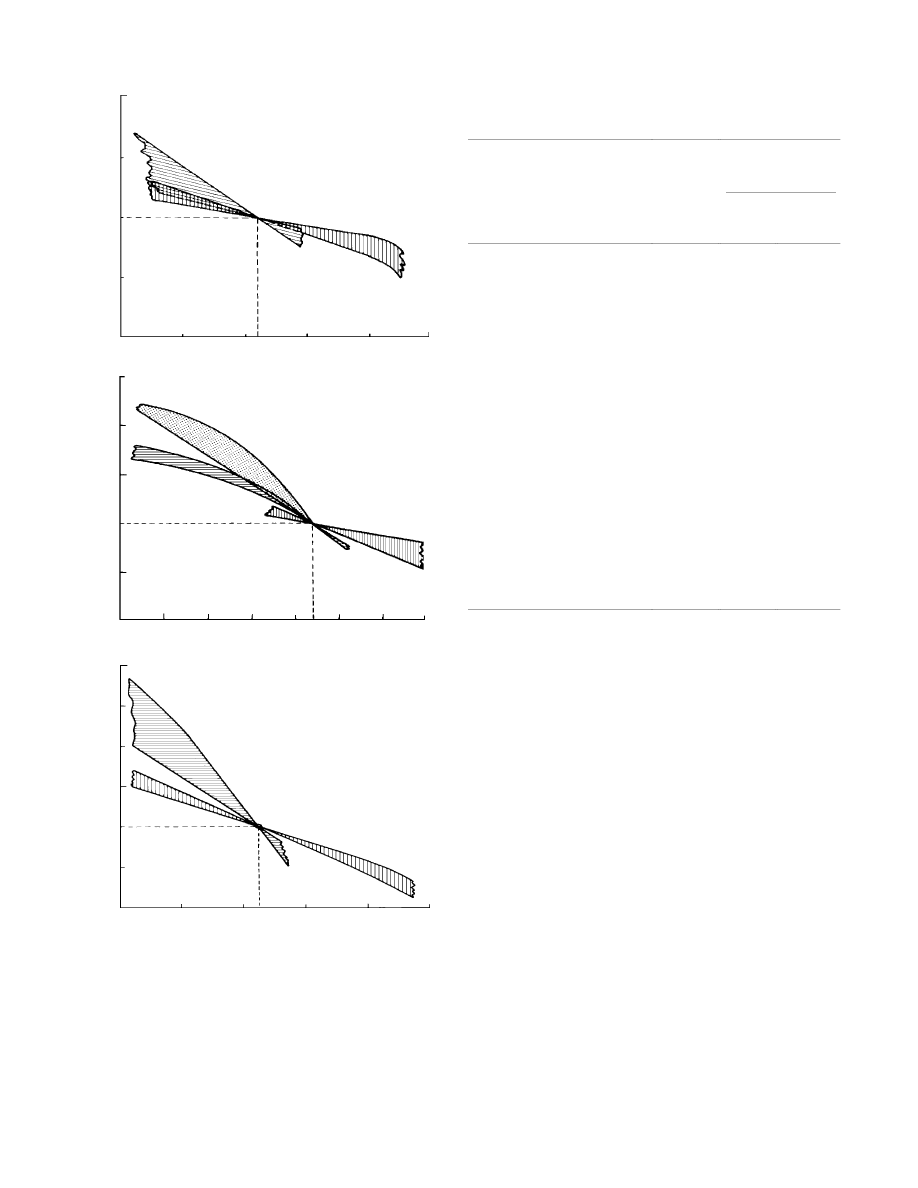

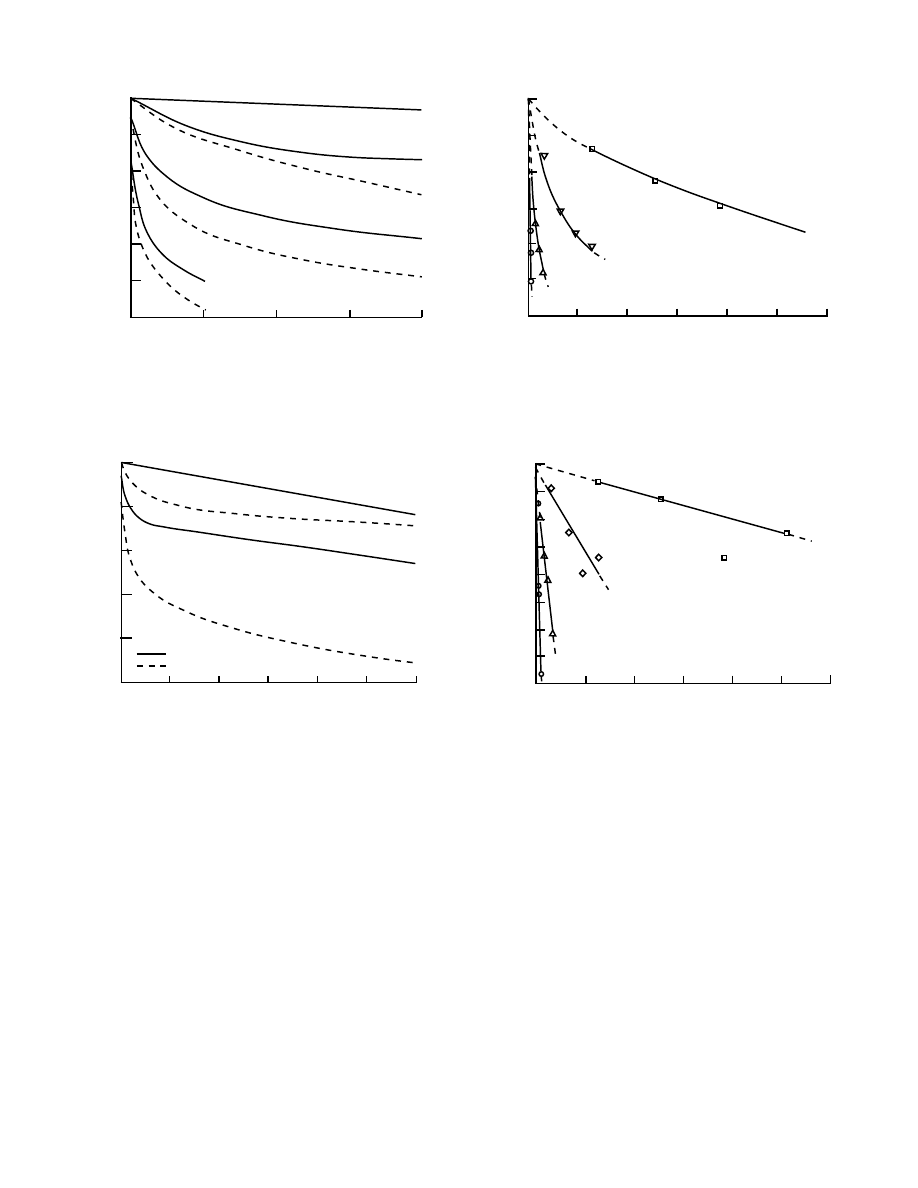
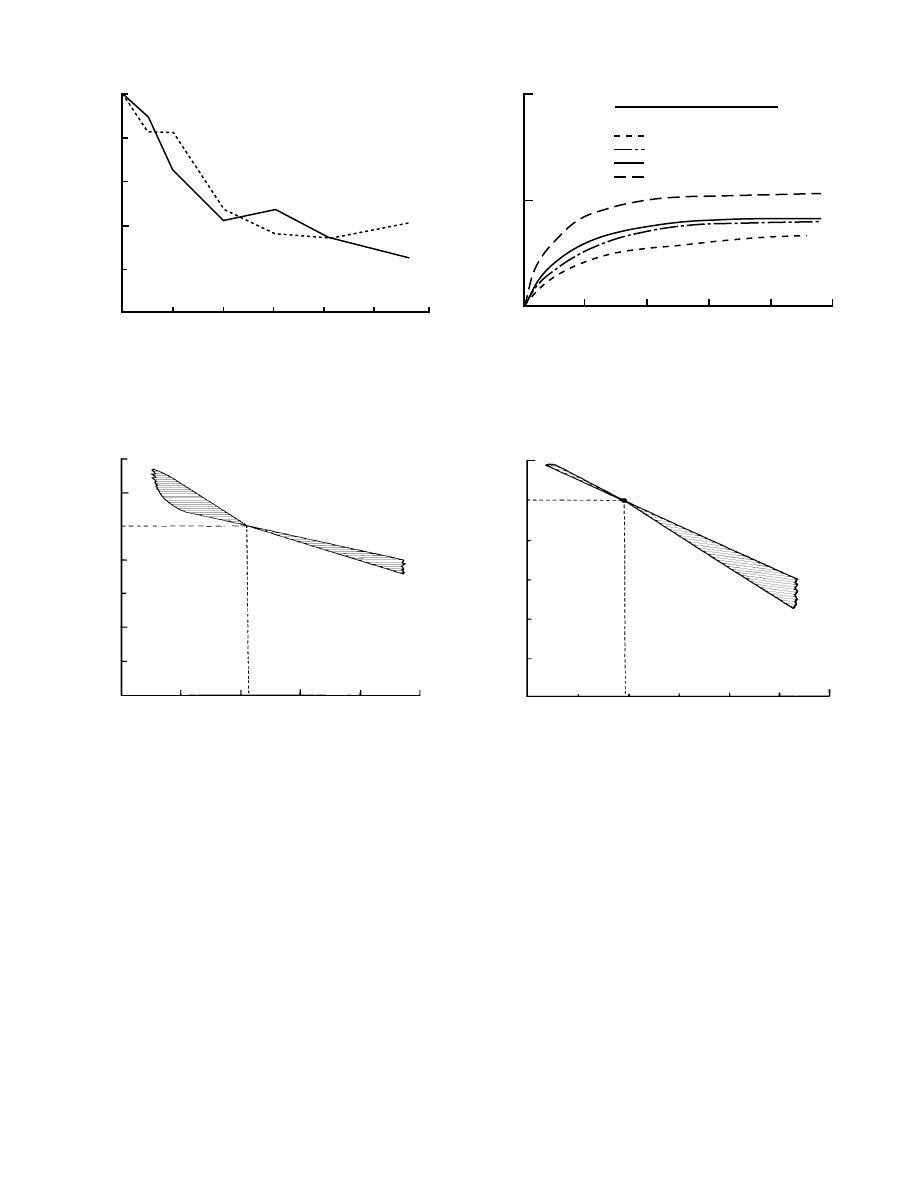


Kõik kommentaarid