FITNESS IN SOCCER
THE SCIENCE AND PRACTICAL APPLICATION
Jan Van Winckel, Werner Helsen, Kenny McMillan,
David Tenney, Jean-Pierre Meert, Paul Bradley
[email protected] 06 Aug 2018
Isbn-number : 9789082132304
Publisher: Moveo Ergo Sum / Klein-Gelmen
Proofreading: Jim Newall Quill Content |Writing, Editing and Web site servic
es http://www.quillsites.co.uk
Photos: Jean Leemans and Etienne Claessens
Cover and lay-out: Dots & Bits
© 2014 Jan Van Winckel
Printed and bound at Manipal Technologies Ltd., India
All rights reserved. No part of this book may be reproduced or transmitted in any form or by any means whatsoever without
express written permission from the author, except in the case of brief quotations embodied in critical articles and reviews.
Please refer all pertinent questions to the publisher.
[email protected] 06 Aug 2018
FOREWORD
“Training is an exact science
and relies on reason.
Coaching is an art
and comes from the heart.
A good coach should be
a reasonable artist.”
Prof. Mart Buekers
While writing and revising this book, I often thought of the almost poetic words
above. As a soccer coach, you often tread a thin line between what has been proven
scientifically and what is considered “best practice.” Unfortunately, science in soc-
cer is still in its infancy, and there are still many question marks in this regard.
Soccer is a very complex sport in which different physical abilities are used in tan-
dem, often competing for adaptation. Because not everything in the field of soccer
science has been “mapped out” yet, we often have to rely on our experience and
intuition.
I hope this book can help in some small way to make you a better “reasonable
artist.”
During the discussions on how we would promote the book, the publisher asked
me for some quotes from coaches I have worked with. Although you will find
some, I felt I would rather not do this. I prefer to sincerely thank all the coaches,
board members, physicians, physiotherapists and other staff I have worked with
for the knowledge they have given me and for their marvelous cooperation. I have,
it seems, purloined a little piece of knowledge from each of them.
I would also like to thank the coauthors of this book—Kenny, Dave, Jean-Pierre
and Paul—who have spent considerable time writing and reviewing this book. It is
thanks to their knowledge and effort that this book has been a success in Belgium
and Holland, success that will hopefully be repeated in the rest of the world.
Special thanks to Werner Helsen, who has been my friend and mentor for over
20 years.
Finally I would like to thank my wife, Ester, for supporting me in everything I have
done. My thanks also go to my parents, Anita and Hugo. They gave me the chance
to study over the years, sacrificing many things in their own lives for my brothers
(Bart, Tom and Jelle) and me.
For Josephine and Bente,
Jan Van Winckel
[email protected] 06 Aug 2018
LIST OF AUTHORS
Steven Probst, MSc, has a master’s degree in sports physiotherapy and rehabilitation
sciences from the Katholieke Universiteit Leuven. Since 2009, he has worked for Top-
SportsLab as a research and development manager. Aside from this, he is involved as a
sport physio and rehab coach in the youth academy of Oud-Heverlee Leuven, a Belgian
first-division club.
Pim Koolwijk, MSc, has a master’s degree in human movement science from the VU
University Amsterdam and a bachelor’s degree from the Sport Academy in The Hague.
Since 2007, he has worked as an exercise physiologist/physical trainer at FC Utrecht,
which performs in the highest Dutch division. In the past, he has worked as a human
movement scientist at several sporting organizations. He still works as an indepen-
dent sports consultant for several sporting organizations and individual athletes in
the Netherlands. He has several specializations, including Strength and Conditioning
Coach NSCA, Tennis and Skiing.
Alberto Mendez-Villanueva, PhD, is a Senior Football Fitness Coach and Sports Scien-
tist at the ASPIRE Academy and Qatar Football Association in Doha, Qatar. Before this,
Mendez-Villanueva was the head of the Football Physiology Unit at the ASPIRE Aca-
demy. He holds a doctoral degree in sport physiology from the University of Oviedo
in Spain and a master’s degree in exercise physiology from the University of Western
Australia. He has published over 60 peer-reviewed scientific articles. He has also presen-
ted nearly 50 lectures on team strength and conditioning and physiology-related issues.
Kyle Woodruff, BSc, has a bachelor’s degree in Kinesiology from the University of Con-
necticut. He has worked as a physical coach for the Al-Ahli Saudi football club and also
as an assistant for the men’s and women’s soccer and basketball teams at UConn.
Lieven De Veirman, FAFS, has a certificate in Applied Functional Science from the Gray
Institute in Adrian, Michigan. He has worked mainly as a personal trainer for lower
level athletes and is currently a strength and injury-prevention coach at the youth aca-
demy of the Al-Ahli Saudi football club.
André E Aubert, PhD, has a doctorate in physics from the Katholieke Universiteit Leu-
ven, Belgium, where he is currently emeritus professor at the Faculty of Medicine. His
main research domains are cardiovascular sport physiology and the cardiovascular con-
dition of astronauts, both on Earth and during the weightless conditions of space.
Peter Catteeuw, PhD, was awarded his doctorate in sports sciences in 2010 from the
University of Leuven. He has worked as a research and development manager for Top-
SportsLab in the field of performance management. As physical coach, he was active in
the youth teams of K Lierse SK (2004–2007) and RSC Anderlecht (2007–2009). Since 2011,
he has worked as physical coach for the first team of KRC Genk.
[email protected] 06 Aug 2018
Guido Seerden has a master’s degree in Human and Movement Science (specialized in
Sport & Exercise) and has also had a research internship at Liverpool John Moores Uni-
versity. He cooperated with LJMU’s Science and Football department during his final
project about talent development in soccer. He has completed further internships, such
as at Tranmere Rovers FC, where he worked as a fitness coach and sports scientist. He
is currently working in Saudi Arabia as the Head Coach of the U9’s and U10’s at the
Al-Ahli Saudi football club.
Steven Vanharen is a certified strength and conditioning coach, a physical soccer coach,
and a soccer-periodization expert. He has worked with U17 and U21 teams in the Bel-
gian premier league. He worked at K. Sint-truidense VV as head coach and physical
coach (2010–2012). After this, he became assistant coach/strength and conditioning
coach of the first team at Ujpest FC in the Hungarian premier league (2012-2013). He
currently works as field training specialist and physical coach at the Al-Ahli Saudi foot-
ball club in Saudi Arabia (2013-).
Mathieu Gram, MSc, holds two master’s degrees: one in Physiotherapy & Rehabilitation
Science and one in Physical Education & Kinesiology. He has been active as a Sports
Physiotherapist and Rehabilitation specialist at the Al-Ahli Saudi football club. Prior to
this, he worked as a Sports Physiotherapist at the West Coast Eagles AFL club in Perth,
Western Australia.
Carlo Buzzichelli, is an invited professor of “The Theory and Methodology of Training”
at the Sport University of Camaguey and the Center of Football Studies at Camaguey,
Cuba. He is technical director of the Tudor Bompa Institute, International. In 2012, he
was invited as a guest speaker to the “International Workshop on Strength & Conditio-
ning” (Trivandrum, India) and to the University of Sao Paulo and the Olympic Center of
Sao Paulo (Brasil). As an S&C coach for team sports, Carlo’s teams have achieved eight
promotions, as well as a first and a second place in their respective league Cups. As a
coach of individual sports, Carlo has contributed to the World Track & Field Champi-
onship and the Commonwealth Games. His athletes have won sixteen medals in the
national championships of four different sports (track & field, swimming, Brazilian jiu-
jitsu, and powerlifting), as well as two international gold medals (track & field), one
silver and one bronze (Brazilian jiu-jitsu), setting five national records (in powerlifting).
Juan Luis Delgado joined the ASPIRE Academy in 2007. He has held diverse positions as
a soccer coach and worked with different groups from U13 to U17, developing players
for Qatar’s national junior teams. In 2013, he was appointed as coordinator of the newly
created Scouting Department. Part of this new responsibility included the complete
structuring and strategic setup of the department. Prior to this (1999–2006), Juan began
his coaching career at Villarreal CF in Spain, working in several positions including both
academy and first-team level. He then moved to Valencia CF where he worked as aca-
demy training methodology coordinator. He graduated from Valencia University with
a bachelor’s degree in Sport Sciences and a minor in soccer. He also holds a master’s
degree in Sports Psychology from UAM, Madrid. He is currently undertaking his docto-
ral thesis on “Football Tactical age-related differences.” In line with his soccer education,
he is a UEFA Pro accredited coach and has enjoyed coaching development opportunities
in the Netherlands and the US.
[email protected] 06 Aug 2018
Ibrahim Akubat, PhD, has a doctorate in exercise physiology, focused on training load
monitoring in soccer, from the University of Hull, UK. He has examined a whole portfo-
lio of dose-response relationships with physical, perceptual and biochemical measures
in rested and fatigued states, all of which will be published in due course. He is now a
lecturer in exercise physiology at Newman University, Birmingham and a consultant to
numerous teams and athletes. He is also the founder of Training Impulse, a company
providing information, workshops, training and software for matters related to training
load monitoring.
Renaldo Charles Landburg is a former athlete from the Netherlands. After finishing his
study at the Central Institute of Sport Instructors (CIOS) he has completed courses to
specialize in running technique, coordination and fitness in soccer. Following his work
at many amateur clubs in the Netherlands, Louis van Gaal and Danny Blind approached
Renaldo in 2004 to come and work for the youth academy of AFC Ajax, Amsterdam.
After this work at one of Europe’s best youth academies, he decided in 2010 to move to
Saudi Arabia, where he continues to work for the Al-Ahli Saudi football club as physical
coordinator of the youth teams.
Glen Reed, MSc, ASCC, has a master›s degree in strength and conditioning (S&C) from
Middlesex University, London. He currently works in youth soccer, serving as the S&C
coach for the U16 squad of Crystal Palace, where he has also had experience with the
first team (2009-2010). Prior to this, he worked in the area of tennis at Highgate Perfor-
mance Tennis (2011) and Hills Road High Performance (2011–2012).
Sally Hara, MSc, RD, CSSD, CDE, is a board-certified specialist in Sports Dietetics and
a certified diabetes educator. She has bachelor’s degrees in both Nutrition Science and
Exercise Physiology, as well as a master’s degree in Nutrition Science, all from the Uni-
versity of California, Davis. Sally has worked in research laboratories and medical cen-
ters and has run a private practice, where she provides medical nutrition therapy and
sports nutrition coaching, near Seattle for over 10 years. As a nationally recognized
public speaker, former college instructor, and writer, she has authored and co-authored
multiple research studies and sports nutrition articles. She is a contributing author of
The American Dietetic Association’s Sports Nutrition: A Guide for the Professional Wor-
king with Active People (4th ed.).
Bart De Roover is a former international professional soccer player, having played five
games for the national team of Belgium. After his playing career, he served as head coach
of several first-division teams, including SV Zulte Waregem and Antwerp RAFC. Bart
holds a UEFA Pro coaching license and is involved in the post formation of the Asian
Vice-Champions, the Al-Ahli Saudi football club.
Balder Berckmans, MSc, has a master’s degree in both sports sciences and rehabilita-
tion sciences from the Free University of Brussels. He has gained experience in soccer
through internships at Manchester City FC, FC Cologne, and Club Brugge K.V. Since
July 2012, he has worked mainly as an injury-prevention and end-of-rehabilitation spe-
cialist at the Al-Ahli Saudi football club. Before that, he worked for KV Mechelen as a
strength and conditioning coach, with specific attention on efficient moving in soccer.
[email protected] 06 Aug 2018
Ester Lowette, MSc, has a master’s degree in Sports Psychology from The University of
Leuven. She has played professional volleyball for over 20 years, winning the European
Top Team Cup with Asterix Kieldrecht. Ester played several years for the Yellow Tigers
(the national team) and has won the Belgian Championship with three different teams.
Arne Jaspers, MSc, has master’s degrees in Physical Education and Kinesiology and in
Rehabilitation Sciences and Physiotherapy from the University of Leuven. He is cur-
rently conducting his doctorate about the use of athlete-tracking data in soccer for per-
formance optimization and injury prevention. This project is a cooperation between AZ
Alkmaar, the University of Leuven, and TopSportsLab. Before that, he worked as a per-
formance analyst with the KBVB, UEFA and FIFA in supporting the physical preparation
of elite soccer referees.
John Fitzpatrick, MSc, is an aspiring sports scientist and researcher with a master’s
degree in strength and conditioning from Teesside University. He is currently a sports
science intern at Newcastle United Football Club. His research focuses on the monito-
ring of recovery and fatigue in soccer players.
Pieter Jacobs, MSc, holds a master’s degree in sports sciences and a bachelor’s degree
in rehabilitation sciences from the Vrije Universiteit Brussels. He previously worked as a
physiotherapist for Beerschot AC in the Belgian professional league. He works currently
at Al-Ahli Saudi football club as Head of Rehabilitation (2012-).
[email protected] 06 Aug 2018
TABLE OF CONTENTS
1. TRAINING PRINCIPLES ............................................................................................. 13
1.1
Introduction .................................................................................................. 13
1.2
Supercompensation ..................................................................................... 13
1.3
Delayed transmutation .................................................................................. 14
1.4
Cumulative training effect ............................................................................. 14
1.5
Residual effects of training ............................................................................ 14
1.6
Interference or superposition of training effects ............................................. 15
1.7
Training process and goal setting ................................................................. 15
1.8
Specificity (Specific Adaptations to Imposed Demands) ................................ 16
1.9
Transfer effect (cross-training) ...................................................................... 16
1.10
Initial value and diminishing returns .............................................................. 17
1.11
Inter-individual variability .............................................................................. 18
1.12
Nature or Nurture? ........................................................................................ 18
1.13
Principle of reversibility ................................................................................. 19
1.14
Progression .................................................................................................. 19
1.15
Variation ............................................................................................................. 19
2. TRAINING MODELS ................................................................................................... 21
2.1
Introduction .................................................................................................. 21
2.2
General Adaptation Syndrome (GAS) ........................................................... 22
2.3
The Supercompensation or one-factor theory ............................................... 23
2.4
Fitness-fatigue model ................................................................................... 25
2.5
Performance potential model ........................................................................ 31
3. THE PHYSICAL DEMANDS OF ELITE SOCCER MATCH PLAY .................................... 33
3.1
Introduction ................................................................................................. 33
3.2
Activity profile ............................................................................................... 33
3.3
Positional variation ....................................................................................... 34
3.4
Competitive standard .................................................................................... 35
3.5
Gender Differences ...................................................................................... 36
3.6
Match-to-match variability and stability ........................................................ 37
3.7
Contextual and tactical factors ...................................................................... 37
3.8
Fatigue during match play ............................................................................ 38
4. NUTRITION ................................................................................................................. 43
4.1
Introduction .................................................................................................. 43
4.2
Energy ......................................................................................................... 43
4.3
Substrate Utilization and Macronutrient Needs ............................................. 46
4.4
ATP (adenosine triphosphate) ...................................................................... 53
4.5
Energy systems ............................................................................................ 55
4.6
Macronutrient needs ..................................................................................... 56
4.7
Eating patterns of soccer players ................................................................. 57
4.8
Glycogen metabolism and nutrient timing for recovery .................................. 58
4.9
Energy Balance and Body Composition ........................................................ 61
4.10
Vitamins, minerals and free radicals.............................................................. 64
4.11
Water and electrolyte balance in soccer players ............................................ 66
4.12
Food supplements ........................................................................................ 69
4.13
Recommendations ........................................................................................ 71
[email protected] 06 Aug 2018
max
5. PHYSICAL ABILITIES AND THE ROLE OF AEROBIC FITNESS ................................ 73
5.1
Introduction ................................................................................................... 73
5.2
Physical abilities ............................................................................................ 74
5.3
Aerobic fitness .............................................................................................. 76
5.4
Soccer-specific training drills using the continuous principle .......................... 77
6. HIGH-INTENSITY INTERVAL TRAINING (WITH SPECIAL REFERENCE
TO SMALL SIDED GAME PLAY) ...................................................................................... 83
6.1
Introduction to High-Intensity Interval Training (HIIT) ..................................... 83
6.2
HIIT effects on cardiovascular and muscular adaptations............................... 85
6.3
Lactate formation during HIIT ........................................................................ 85
6.4
Lactate clearance during HIIT ........................................................................ 86
6.5
High-intensity interval training versus low-intensity continuous training .......... 87
6.6
High-intensity interval training with or without the ball .................................... 88
6.7
Small-sided games (SSGs) ........................................................................... 90
6.8
Training Time Distribution .............................................................................. 97
6.9
Soccer-specific training drills ......................................................................... 98
7. SPEED, AGILITY AND QUICKNESS (SAQ) AND REPEATED
SPRINT ABILITY (RSA) ............................................................................................. 109
7.1
Introduction ................................................................................................. 109
7.2
Nature or Nurture ........................................................................................ 110
7.3
Biomechanics of Sprinting ........................................................................... 110
7.4
Running technique ...................................................................................... 112
7.5
Speed, agility, quickness and cutting ........................................................... 112
7.6
Definitions ................................................................................................... 113
7.7
Soccer-specific SAQ drills ........................................................................... 113
7.8
Speed ......................................................................................................... 115
7.9
Tips ................................................................................................................... 117
7.10
Exercises .................................................................................................... 118
8. FITNESS TESTING .................................................................................................... 123
8.1
Introduction ................................................................................................. 123
8.2
Criteria ........................................................................................................ 124
8.3
Why measure? ............................................................................................ 125
8.4
Test environment ......................................................................................... 126
8.5
The terms
“to be” and “as is” ....................................................................... 126
8.6
Tests ............................................................................................................................... 127
8.7
Analyzing Testing Results ........................................................................... 145
9. HEART RATE AND GPS MONITORING IN SOCCER ................................................ 149
9.1
IntRoduction ................................................................................................ 149
9.2
Use of heart rate as an indirect measure for oxygen consumption ............... 149
9.3
Resting heart rate (HRr) .............................................................................. 150
9.4
Maximum heart rate (HR ) ......................................................................... 150
9.5
Lactate threshold ........................................................................................ 150
9.6
Relating the lactate curve to the heart rate .................................................. 153
[email protected] 06 Aug 2018
9.7
Interpreting HR measurement ..................................................................... 154
9.8
Effect of training on heart rate and lactate accumulation .............................. 155
9.9
Autonomic nervous system ......................................................................... 156
9.10
Examples of heart rate interpretation ........................................................... 159
9.11
GPS Monitoring .......................................................................................... 161
[email protected] 06 Aug 2018
10. TRAINING LOAD MONITORING IN SOCCER ........................................................... 167
10.1
Introduction ................................................................................................. 167
10.2
The Training Process .................................................................................. 168
10.3
Internal Load ............................................................................................... 169
10.4
External Load .............................................................................................. 177
11. TRAINING CONTINUUM ............................................................................................ 185
11.1
Introduction ................................................................................................. 185
11.2
Different stages of the training continuum................................................... 186
11.3
Load and load tolerance .............................................................................. 190
11.4
Overtraining detection scale ........................................................................ 193
11.5
Training flaws .............................................................................................. 194
11.6
Relation between load, injuries, fitness and performance ............................ 195
12. FATIGUE ........................................................................................................................... 201
12.1
Introduction ................................................................................................. 201
12.2
Fatigue in a soccer match ........................................................................... 202
12.3
Underlying mechanisms of fatigue ............................................................... 203
12.4
Effects of fatigue ......................................................................................... 209
12.5
Countering fatigue ....................................................................................... 211
13. FATIGUE MANAGEMENT.......................................................................................... 217
13.1
Introduction ................................................................................................ 217
13.2
Performance stabilization ............................................................................ 218
13.3
Fatigue management .................................................................................. 219
13.4
Recovery strategies .................................................................................... 220
13.5
Monitoring Fatigue and Recovery in Soccer ................................................ 232
13.6
Tapering .................................................................................................................. 244
14. PERIODIZATION IN SOCCER ................................................................................... 253
14.1
History of periodization ................................................................................ 253
14.2
Types of periodization ................................................................................. 255
14.3
Season planning ......................................................................................... 255
14.4
Types of periodization ................................................................................. 257
14.5
Periodization models: Intensity and volume ................................................. 258
14.6
Periodization models: Physical abilities ....................................................... 260
14.7
Workload .......................................................................................................... 263
14.8
Integrated ................................................................................................... 264
14.9
Types of microcycles ................................................................................... 265
14.11
Periodization in soccer ................................................................................ 265
15. THE TACTICAL PERIODIZATION MODEL (UNDERSTANDING
THE
GAME’S DEMANDS TO ENHANCE SOCCER PERFORMANCE) ..................... 273
15.1
Introduction ................................................................................................. 273
15.2
Tactical Periodization: A new soccer training approach ................................ 274
15.3
Game model ............................................................................................... 276
15.4
Principles of play and game model .............................................................. 278
15.5
Tactical Periodization: methodological principles ......................................... 280
16. MACROCYCLE: PRESEASON .................................................................................. 291
16.1
Introduction ................................................................................................. 291
16.2
Preseason training principles ...................................................................... 292
16.3
Organization of the mesocycle .................................................................... 296
16.4
Friendly match planning in the preseason stage .......................................... 298
16.5
Organization of the preseason training camp .............................................. 300
[email protected] 06 Aug 2018
17. MACROCYCLE: IN-SEASON .................................................................................... 307
17.1
Introduction ................................................................................................ 307
17.2
Duration of the mesocycle .......................................................................... 307
17.3
Organization of the mesocycle .................................................................... 309
17.4
Three phases of the
“in-season” mesocycle ................................................ 310
17.5
Remarks ...................................................................................................... 311
17.6
Individual periodization ............................................................................... 315
17.7
How to implement individual periodization ................................................... 317
18. MICROCYCLE: WEEK PLANNING ........................................................................... 333
18.1
Introduction ................................................................................................ 333
18.2
Structure of a training session .................................................................... 333
18.3
Pre-activation ............................................................................................. 334
18.4
Warm up ..................................................................................................... 334
18.5
Central section ........................................................................................... 339
18.6
Progression phase ...................................................................................... 339
18.7
Recovery phase .......................................................................................... 339
18.8
Prevention phase ........................................................................................ 341
19. STRETCHING ............................................................................................................ 343
19.1
Introduction ................................................................................................ 343
19.2
Types of stretching ..................................................................................... 343
19.3
Increasing flexibility or preparing the body .................................................. 347
19.4
Use during the training week ....................................................................... 349
20. STRENGTH TRAINING AND FUNCTIONAL TRAINING ........................................... 351
20.1
Introduction ................................................................................................ 351
20.2
Physiology of muscle strength .................................................................... 351
20.3
Strength training and the nervous system ................................................... 353
20.4
Types of strength ........................................................................................ 354
20.5
Types of strength training ........................................................................... 355
20.6
Plyometrics ................................................................................................. 355
20.7
Setting up general strength training programs ............................................. 358
20.8
General strength training exercises ............................................................. 360
20.9
TRX/Suspension Training. .......................................................................... 362
20.10
Medicine Ball .............................................................................................. 364
20.11
Functional strength training for the soccer player ........................................ 366
21. INJURY PREVENTION .............................................................................................. 381
21.1
Introduction ................................................................................................ 381
21.2
Consequences of injuries ............................................................................ 382
21.3
Conceptual model: injury prevention ........................................................... 382
21.4
Intrinsic risk factors ..................................................................................... 385
21.5
Extrinsic risk factors .................................................................................... 393
21.6
General injury prevention for soccer players ............................................... 397
21.7
Injury-prevention programs ......................................................................... 403
[email protected] 06 Aug 2018
[email protected] 06 Aug 2018
[email protected] 06 Aug 2018
FITNESS IN SOCCER
Training principles
13
1
TRAINING PRINCIPLES
Werner Helsen, Kenny McMillan, David Tenney, Paul Bradley,
Jean-Pierre Meert & Jan Van Winckel
1.1 INTRODUCTION Performance in association football (known as soccer in North-America) depends
upon a myriad of aspects, such as technical, tactical, physical and mental parame-
ters. As with other sports, soccer is not a science, but science can assist in impro-
ving performance (Stolen et al., 2005) and preventing injury. Training principles are
systematic summaries of scientific findings, and these are highly important for the
appropriate organization of training sessions and competitions. They are defined
as rules and methods that can be used to prepare a player or team for competition
in a professional manner. Training principles provide a reliable guidance, and they
are therefore important for coaches to understand in order to maximize perfor-
mance and minimize the chance of failure.
1.2 SUPERCOMPENSATION The Soviet scientist Yakovlev offered probably the first scientifically based expla-
nation of fitness enhancement in 1955. Yakovlev demonstrated the phenomenon
of “supercompensation” of muscle and liver glycogen and muscle phosphocrea-
tine stores during recovery from exercise (Yakovlev, 1955). The training principle of
supercompensation states that improvements only become evident after a period
in which the accumulated fatigue from training can be reduced. A period of relative
rest enables the results of training to be better reflected. Some important processes
occur after the actual training session or match, a period when the players’ bodies
are given valuable time to adapt to the training stimuli provided one or two days
before. Therefore, rest or recovery should be considered an important phase in the
overall training process.
[email protected] 06 Aug 2018
FITNESS IN SOCCER
Training principles
14
Accumulated training load
Supercompensa1on
Supercompensation
Decreased performance
Time
Fig. 1.1: The accumulated training load (and the corresponding fatigue) results in decreased
performance in the days immediately after exercise. An adequate recovery results in increased
performance through a reduction in fatigue (supercompensation).
1.3 DELAYED TRANSMUTATION This principle holds that in order to realize performance enhancements, specific
exercises must be used to transform and maximize the fitness acquired during pre-
vious training activities. For example, if a player performs strength training exer-
cises for his or her legs (e.g., squats), there will only be a visible improvement if
the player also performs specific exercises (e.g., jumps and sprints). This way, the
strength gained is “transmuted” into functional movements. Zatsiorsky (1995)
defined delayed transmutation as “the time period needed to transform acquired
motor potential into athletic performance.” Aspecific work improves the potential
for performance, but it will not directly improve performance without specialized
specific training afterwards (Zatsiorsky and Kraemer, 2006).
1.4 CUMULATIVE TRAINING EFFECT The cumulative effect of long-term training is the primary factor determining a
player’s physical fitness. The cumulative training effect can be described as “a
change in physiological capabilities and level of physical/technical abilities resul-
ting from a long-term athletic preparation” (Issurin, 2008).
1.5 RESIDUAL EFFECTS OF TRAINING One of the primary aims of soccer training is to develop various physical abilities.
These physical abilities remain at an elevated level for a certain period after trai-
ning ceases. This retention of fitness is explained by the residual training effect,
which can be described as “the retention of changes induced by systematic work-
loads beyond a certain time period after the cessation of training” (Counsilman and
Counsilman, 1991). These residual effects have been defined in two ways: in terms
of the retention of physical changes following a series of many training sessions
(delayed effects) and in terms of the results of a series of many training sessions
(accumulative effects) (Hellard et al., 2005).
Perf
o
rm
an
ce
[email protected] 06 Aug 2018
FITNESS IN SOCCER
Training principles
15
If training is suspended for a given physical ability, the performance level of that
ability will drop. Therefore, after a period of detraining, players will be at a resi-
dual level of performance. For example, at the amateur level, players often have
six to eight weeks off during the summer. The fitness level remaining after this
off-season period is referred to as the residual effect. Long periods of training, com-
plex and multi-component training, and appropriately periodized loads will lead
to longer-lasting residual effects (Issurin, 2010). Older and more experienced athle-
tes also have longer-lasting residuals. Some physical abilities, such as strength and
aerobic endurance, have longer-lasting residuals when compared with anaerobic
parameters.
Residual effects of training
95%
90%
85%
80%
75%
70%
Fig. 1.2: A theoretical representation of the residual effects of training. The player trains four times
(once every two days) until day seven. His fitness level increases through training, but after eight
days of rest, his fitness level has decreased from 93% (on day 8) to 85% (on day 15).
1.6 INTERFERENCE OR SUPERPOSITION OF TRAINING EFFECTS Players are often exposed to training different physical abilities during the same
training cycle, particularly for strength and aerobic power. Improvements in
strength may be compromised when practiced simultaneously with aerobic power,
and this has been referred to as the interference phenomenon (Docherty and Spo-
rer, 2000). The interference effect can be negative or positive depending on the form
and sequence of exercise.
1.7 TRAINING PROCESS AND GOAL SETTING Each training process needs to have a clear training objective. This training goal can
be determined in both a general way, such as to get into the top five, as well as in a
more specific manner, such as to run 3,000 meters in 12 minutes.
In their meta-analysis, Kleingeld et al. (2011) showed that specific, difficult goals
yield considerably higher group performance when compared with aspecific goals.
Moderately difficult and easy goals were also associated with performance benefits
relative to nonspecific goals. These findings demonstrate that group goals have a
Fi
tn
e
ss
le
ve
l
[email protected] 06 Aug 2018
FITNESS IN SOCCER
Training principles
16
robust effect on group performance. Individual goals can also promote group per-
formance, but they should be used with caution in interdependent groups.
1.8 SPECIFICITY (SPECIFIC ADAPTATIONS TO IMPOSED DEMANDS) The principle of specificity is often referred to as the Specific Adaptation to Imposed
Demands (SAID) principle. Scientific research has shown training to lead to dura-
tion, task and speed specific changes (Rutherford, 1988; Givens, 2010). A sprinter,
for example, will improve in speed, through specific training, but not in aerobic
endurance.
The rule of specificity states that a player has to train in a specific way to acquire
a specific adaptation (i.e., specific training results in improvement of that specific
movement). This means the biggest physiological changes take place in the struc-
tures that were subject to the training stimulus. Magel et al. (1975) provided a good
example when they showed how swimmers, after a period of training, achieved an
11.2% improvement in aerobic endurance while swimming. However, when they
performed a running test, the improvement in aerobic endurance was shown to
be just 1.5%. This finding clearly demonstrates the specificity of training principle,
specifically why it is so important that training should mimic the actual demands
of the sport as closely as possible. Therefore, training should always be oriented
toward the sport itself. The more specific the energy systems used, as well as the
actual activity (e.g., biomechanics, position, body coordination, speed, resistance,
etc.), the greater the chance that specific improvements will occur.
1.9 TRANSFER EFFECT (CROSS-TRAINING) In contrast to the rule of specificity, a transfer effect can be obtained if correct plan-
ning is carried out. For example, research has shown athletes are able to maintain
[email protected] 06 Aug 2018
FITNESS IN SOCCER
Training principles
17
their endurance levels after a period of deep-water running, which involves run-
ning movements in deep water while the athlete wears a flotation belt. This method
is therefore not only useful during periods of injury, but it can also act perfectly as
an alternative training or recovery workout following a match. Reilly et al. (2003)
concluded that aerobic performance is maintained by deep-water running for up
to six weeks in trained endurance athletes, while sedentary individuals showed
greater improvements in their maximal oxygen uptake VO
2max than athletes. There
is also limited evidence showing improvements in anaerobic measures and upper-
body strength in individuals who engaged in deep-water running.
The research literature clearly shows that any form of specific training produces
more effective results than cross-training. However, specific types of training are
sometimes not possible (e.g., because of injury or overtraining). On these occasions,
cross-training is an ideal substitute to help preserve as much fitness as possible.
Different modes of aerobic training (e.g., aqua-jogging, swimming, cycling or
rowing) can be used to obtain positive adaptation phenomena or training effects.
1.10 INITIAL VALUE AND DIMINISHING RETURNS The principle of initial value and diminishing returns implies that progress will
be greater for individuals with a lower baseline level than those who have already
reached a high level of performance. When commencing strength training, results
are quickly evident in the initial phase. However, experienced players need to train
more often and with greater intensity to see the same progress after a few weeks.
Therefore, it is important for training to be adapted and evaluated relatively quick–
ly at the beginning of the training program.
Law of diminishing returns
100
90
80
70
60
50
40
30
20
10
0
Time in training
Fig. 1.3: When unfit players begin a training program, their physical fitness levels increase rapidly.
When they become fitter and approach their genetic limits, the law of diminishing returns becomes
apparent.
In conclusion, good progress can be observed for a soccer player during the initial
phase of a program. However, as the player’s fitness and stamina increases over
time, the less pronounced this progress will be.
P
er
fo
rm
an
ce
le
ve
l
[email protected] 06 Aug 2018
FITNESS IN SOCCER
Training principles
18
1.11 INTER-INDIVIDUAL VARIABILITY Adaptation to training is known to be a highly individual phenomenon (Avalos et
al., 2003). The improvement in response to a training stimulus varies from person
to person not only because of diff ences in “nature” (genetic predisposition) but
also because of “nurture” such as pre-training condition; gender, age and ethnicity;
health, diet and sleep; environmental factors such as heat, cold, and humidity; and of
course motivation. Players respond to the same training stimulus in diff ent ways,
with some players adapting better and quicker to a particular stimulus than others.
Therefore, each player can be categorized as a low, moderate or high responder.
Hohman (1988) examined the training variations of the West German water polo
team for the Olympic Games in Seoul, specifically the relationship between the trai-
ning load and competitive performance. Two different types of athletes emerged:
those that responded quickly to training stimuli and those that did not respond so
quickly.
Inter-individual variability also depends on the type of exercise. For example, some
players will progress more in terms of speed development, while others will improve
more rapidly in the area of aerobic endurance. Training responses can diff to a huge
extent, with the level and speed of progress varying widely between players. Four
weeks of preparation may be suffi for some players, while others may need up
to eight weeks. The impact of training also depends in part on the athlete’s physical
maturity. Training is less effective before puberty than it is afterwards.
1.12 NATURE OR NURTURE? Is a top soccer player born as such, or is that player the result of years of hard trai-
ning? This is a question that has preoccupied scientists for decades. Is it nature (i.e.,
someone’s genetic predisposition) or is it nurture (i.e., the amount of training) that
makes someone a top soccer player? The predominant factor that determines an
individual’s response to exercise training is genetic predisposition, because players
will respond to exercise training differently. Some individuals respond better to
endurance-type training, whereas others respond to shorter activities biased more
to power and strength. Many scientific papers have examined the genetic response
to exercise training, and Bouchard et al. (1992) concluded that heredity can account
for 25-50% of the variance in VO
2max values. Costill and Wilmore (1998) reported
improvements of 0–43% when a group of subjects followed identical endurance
training programs for up to 12 months. Indeed, it is commonly said, “The best way
to become an elite athlete or football player is to be selective when choosing your
parents!” It should not be forgotten, of course, that the amount (quantity) and qua-
lity of training will determine whether you fulfil your genetic potential. In conclu-
sion, talent has to be first identified. Specific training programs are then needed to
develop and fulfil a soccer player’s genetic potential.
[email protected] 06 Aug 2018
FITNESS IN SOCCER
Training principles
19
1.13 PRINCIPLE OF REVERSIBILITY Detraining is defined as the partial or complete loss of training-induced adaptati-
ons in response to either the cessation of training or a substantial decrease in the
training load (Mujika and Padilla, 2003). We all know the adage of “Use it or lose
it.” Adaptations resulting from training disappear when training is discontinued.
1.14 PROGRESSION A particular training load needs to be increased systematically and progressively
over time, with adequate time being given to reach the training objectives. A sud-
den increase in training load can lead to an imbalance between load and load tole-
rance, which subsequently increases the likelihood of injury.
1.15 VARIATION Training requires a varied approach where all the basic physical abilities can be
trained. A varied program needs to be established without losing sight of the other
principles. Variety in the exercises performed ensures the greatest progress and
minimizes the chance of injury, because the monotony of training load represents
a significant risk factor for injuries. Monotony is a measure of the variability over
training sessions, and it is calculated by dividing the weekly training load by the
standard deviation of that load for the week (Foster, 1998). Enhancement of per-
formance is achieved by systematically making changes in training parameters,
with volume and intensity being the most general training characteristics. Harre
(1982) suggests that programs where athletes are subjected to a steady, regular
load should be discouraged. Strain is the product of the weekly training load and
monotony (Foster, 1998). Foster (1998) showed that high training load and high
training monotony are both factors relating to negative adaptations to training.
Furthermore, Putlur et al. (2004) reported a significant relationship between indi-
ces of training, such as strain and monotony, with the incidence of illness. Finally,
recent research demonstrated that the weekly duration, training load, monotony
and strain over the preceding week were significantly higher for players with a
traumatic injury when compared with healthy players. (Brink et al., 2010).
[email protected] 06 Aug 2018
FITNESS IN SOCCER
20
Training principles
SUMMARY
It is important for a soccer coach to have an understanding and appreciation
of training principles. Coaches should be aware that not all soccer players will adapt the same way to training sessions – the training load may be too much for
one player, predisposing him to injury, but too little for another player, perhaps
causing a detraining effect. Soccer training should be specific to the needs of the
soccer player and should vary from session to session, with a clear and safe pro-
gression to induce positive training adaptations and avoid the accumulation of fatigue, illness and injuries.
REFERENCES
•
Avalos, M., Hellard, P. and Chatard, J.C., 2003. Modeling the training-performance relationship using a mixed model in elite swimmers.
Med. Sci. Sports Exerc., 35, pp.838–846.
•
Bouchard, C., Dionne, F.T., Simoneau, J.A. and Boulay, M.R. (1992). Genetics of aerobic and anaerobic performances. Exercise and Sport
Sciences Reviews, 20, pp. 27-58.
•
Brink, M.S., Visscher, C., Arends, S., Zwerver, J., Post, W.J. and Lemmink, K.A.P.M., 2010. Monitoring stress and recovery: new insights
for the prevention of injuries and illnesses in elite youth soccer players. British Journal Of Sports Medicine, 44(11), pp.809-815.
•
Counsilman, B. E. and Counsilman, J., 1991. The residual effects of training. Swimming Research, 4.
•
Docherty, D. and Sporer, B., 2000. A proposed model for examining the interference phenomenon between concurrent aerobic and
strength training. Sports Medicine, 30(6), p.385-394.
•
Foster, C., 1998. Monitoring training in athletes with reference to overtraining syndrome. Medicine and science in sports and exercise,
30(7), p.1164.
•
Hellard, P., Avalos, M., Millet G., Lacoste L. and Chatard, J.C., 2005. Modeling the residual effects and threshold saturation of training: A
case study of Olympic swimmers. J. Strength Cond. Res., 19(1), pp.67–75.
•
Hohmann, A., 1992. Analysis of delayed training effects in the preparation of the West-German water polo team for the Olympic games
1988. In: D. MacLaren, T. Reilly and A. Lees, Eds., 1992. Swimming science VI. London: E & F Spon.
•
Issurin, V., 2008. Principles and basics of advanced training of athletes. Muskegon (MI): Ultimate Athletes Concepts Publisher.
•
Issurin, V., 2010. New horizons for the methodology and physiology of training periodization. Sports medicine, 40(3), pp.189-206.
•
Kleingeld, A., van Mierlo, H. and Arends, L., 2011. The effect of goal setting on group performance: A meta-analysis. Journal of Applied
Psychology, 96(6), p.1289.
•
Magel, J.R., Foglia, G.F., McArdle, W.D., Gutin, B., Pechar, G.S. and Katch, F.I., 1975. Specificity of swim training on maximum oxygen
uptake. Journal of Applied Physiology, 38(1), pp.151-155.
•
Mujika, I. and Padilla S., 2003. Physiological and performance consequences of training cessation in athletes: detraining. In: W.R. Fron-
tera, ed. 2003. Rehabilitation of Sports Injuries: Scientific Basis. Malden, MA: Blackwell Science. pp.117–143.
•
Putlur, P., Foster, C., Miskowski, J.A., Kane, M.K., Burton, S.E., Scheett, T.P. and McGuigan, M.R., 2004. Alteration of immune function in
women collegiate soccer players and college students. Journal of Sports Science and Medicine, 3, pp.234-243.
•
Reilly, T., Dowzer, C. N. and Cable, N. T., 2003. The physiology of deep-water running. Journal of Sports Science, 21(12), pp.959-972.
•
Rutherford, O. M., 1988. Muscular coordination and strength training. Sports Medicine, 5(3), pp.196-202.
•
Sale, D. and MacDougall, D., 1981. Specificity in strength training: a review for the coach and athlete. Canadian journal of applied sport
sciences, 6(2), p.87.
•
Wilmore and Costill, 2005. Physiology of Sport and Exercise: 3rd Edition. Champaign, IL: Human Kinetics.
•
Yakovlev, N.N., 1955. Survey on sport biochemistry. Moscow: FiS.
•
Zatsiorsky, V.M. and Kraemer, W.J., 2006. Science and practice of strength training. Champaign: Human Kinetics.
•
Zatsiorsky, V. M., 1995. Science and practice of strength training. Champaign, IL: Human Kinetics.
[email protected] 06 Aug 2018
FITNESS IN SOCCER
Training models
21
2
TRAINING MODELS
Jan Van Winckel, David Tenney, Kenny McMillan, Paul Bradley
2.1 INTRODUCTION Training models are theoretical models that enable coaches to understand the trai-
ning process and its impact on physical performance. These models can then be
used as a framework to design training programs. Most coaches are aware of the
supercompensation model (the one-factor model), which clearly explains why per-
formance improves after a period of rest. Unfortunately, this model is incomplete,
and it has been replaced over the last few decades by the fitness-fatigue model (the
two-factor model). This model provides coaches with additional insight, enabling
them to make more accurate predictions about the impacts of various training regi-
mes. This allows the training loads of individual athletes to be anticipated and ulti-
mately modified to suit their requirements. Clearly, the primary aim of any soccer
training program is to ensure the players are in peak fitness on match day, so it is
therefore important to also consider fatigue effects resulting from training and its
eventual impact on match fitness.
In recent years, a considerable amount of research has been published on the effect
of different training models. A brief summary of this research is provided below,
ranging from the original model from Hans Selye to the supercompensation model
(the one-factor model) and the fitness-fatigue model (the two-factor model).
[email protected] 06 Aug 2018
FITNESS IN SOCCER
Training models
22
2.2 GENERAL ADAPTATION SYNDROME (GAS)
2.2.1 Hans Selye Dr. Hans Selye, an endocrinologist, was one of the first scientists to describe the
response of the human body to any kind of stress. In 1938, he proposed the Gene-
ral Adaptation Syndrome theory (GAS), which involved two major systems of the
body: the nervous system and the endocrine system. In 1946, he defined GAS as
the sum of all the non-specific, systematic reactions of the body that ensue from
continued exposure to stress.
1. The alarm phase
The first stage of GAS, the alarm reaction, is the immediate reaction to a stressor.
In the initial phase of stress, humans exhibit a “fight or flight” response that pre-
pares the body for action.
The alarm phase is divided into two further phases: the shock phase and the anti-
shock phase.
• In the shock phase, the resistance to the stressor drops temporarily below
the normal range (baseline).
• The anti-shock phase is when the threat or stressor is identified or realized.
The body then starts to respond and is now in a state of alarm.
2. Resistance
The resistance phase depends on the athlete’s level and genetic potential. If stress
continues during this phase, the body adapts to the stressors it is exposed to.
According to Dr. Selye, this adaptation begins after 48 hours and within a period
of four weeks.
3. Recovery or exhaustion
The recovery stage follows once the system’s compensation mechanisms
have successfully overcome the stressor effect. Alternatively, exhaustion may be
the third stage in the GAS model, and at this point, all of the body’s resources are
ultimately depleted, leaving it incapable of maintaining normal function.
General adapta+on syndrome (GAS)
Resistance to stress before exhaus
FITNESS IN SOCCER
Training models
23
2.2.2 Use of the GAS model in sport
Prokop and Rössner (1959) were one of the first to use Selye’s concept of GAS to
explain the concept of periodically decreasing the amount of training. Forbes Car-
lile (1961) applied Selye’s theory to sport in a series of Track Technique articles
named The Athlete and Adaptation to Stress. He suggested using the GAS model as a
theoretical foundation. Indeed, Hans Selye’s GAS can serve as a theoretical frame-
work for adaptation to training, since training can be regarded as a type of stress.
Matvejev (1964), however, criticized the use of the GAS model to explain periodiza-
tion, postulating that the GAS theory was based on pathological material. Coaches
and scientists should be wary of rigidly translating Selye’s biochemical model to
sport, because performance does not only result from the storage or release of bio-
chemical substances.
2.3 THE SUPERCOMPENSATION OR ONE-FACTOR THEORY
The terms supercompensation, superadaptation and adaptive reconstruction
(Russian science) are widely used to explain the results of optimal training and
the effect of subsequent recovery. Overload training is a method of stressing an
athlete at a higher level than formerly tolerated with the aim of stimulating adapta-
tion and thus supercompensation (Steinacker et al., 2002). The supercompensation
effect that can occur after stressing an athlete is a relationship between work and
recovery that leads to homeostatic adaptations to higher levels (Bompa and Haff,
2009). The training phenomenon known as the supercompensation effect was pro-
bably first described by Folbrot in 1941. In the 1950s, the Russian biochemist
Yakovlev (1955) demonstrated supercompensation of muscle and liver glyco-
gen and muscle phosphocreatine during post-exercise recovery. Yakovlev (1967)
classified supercompensation as a four-step process:
Phase 1: Fatigue after training. There is a predictable drop in performance due to
the stress induced by training (1 to 2 hours).
Phase 2: Compensation (rest) phase. Energy stores and performance return to the
baseline (24 to 48 hours).
Phase 3: Supercompensation of performance (36 to 72 hours).
Phase 4: A decrease in the physiological benefits, the so-called detraining pheno-
menon, obtained during the supercompensation phase. This occurs when
the athlete does not apply another stimulus within an optimal period of
time (i.e., during the supercompensation phase) (3 to 7 days).
[email protected] 06 Aug 2018
FITNESS IN SOCCER
Training models
24
Fig. 2.2: Supercompensation or one-factor theory
A sufficient training load results in a temporary decrease in performance.
With an optimal recovery, this stress eventually leads to a greater perfor-
mance than the initial level. This next training load might be higher because of
increased fitness levels and a consequently higher level of load tolerance. The soc-
cer players’ performance level will increase as a result.
However, if too much time elapses between two training sessions, performance
does not increase and can even decrease (detraining).
Fig. 2.3: Excessive time between training loads.
Fig. 2.4: Inadequate recovery periods
This is where the interval between the training stimuli is too short, so recovery
is not complete. The body is still recovering when the next training stimulus is
encountered. According to this model, performance will decrease. However, this
model does have its limitations. For example, a coach would need to wait
until a player is fully recovered before providing a new training stimulus.
In reality, however, a new training stimulus can be imposed on players
before they are fully recovered, such as having two training sessions on the
[email protected] 06 Aug 2018
FITNESS IN SOCCER
Training models
25
same day. This is of course perfectly possible, and it will improve perfor-
mance over the long term when applied properly. So, is the supercompen-
sation model incorrect? This model can be interpreted as the consequence
of accumulated load followed by a rest period that allows supercompensa-
tion to take full effect. Each physical ability—such as speed, endurance, strength,
and so on—has its own response and recovery rates and supercompensation curve.
The replenishment of ATP and CP requires only a few seconds to a few minutes
to return to baseline levels, while the
reloading of glycogen in soccer can
take up to 48 hours. One of the conse-
quences of supercompensation is an
enhanced load tolerance when reco-
very is adequate and the new load is
timed properly.
2.4 FITNESS-FATIGUE MODEL
The GAS or supercompensation
model offers a theoretical framework
for the process of adaptation that is
easy to understand. Both models,
however, have their limitations, and
they cannot be used to predict future
performance. The fitness-fatigue
model was first conceptualized
by Banister (1975). This model
states that a training stimulus
leads to two internal effects on
the body: fatigue (a negative effect) and fitness (a positive effect). The fit- ness-
fatigue model, also known as the two-factor model, associates the superimpo- sed
effects of the fitness and fatigue processes. The principle holds that the fitness
effect of training is relatively small but long lasting, while the fatigue effect of trai-
ning is shorter in duration but greater in magnitude. In this model, the two after-
effects of training fitness and fatigue both influence the preparedness of the player.
Preparedness, unlike fitness, is influenced by acute changes in the subject.
Fig. 2.5: The fitness-fatigue model. The athlete (player) is viewed as a system with training impulse
as input and performance as output.
[email protected] 06 Aug 2018
FITNESS IN SOCCER
Training models
26
A training stimulus results in two effects. There is a “fitness effect,” which is rela-
tively small and disappears slowly, and a “fatigue effect,” which is greater in mag-
nitude but may also dissipate quickly. The extent to which fatigue disappears
depends on the individual, but it may also be influenced by the recovery strategies
employed. Preparedness is the combination of fitness and fatigue.
Fig 2.6: The fitness-fatigue model
This model can be explained by using the following theoretical example:
We assume a normal training stimulus with a value of 6,300 arbitary units (AU) (90
minutes training x 70% = 90 x 70 = 6,300 AU). This creates a fatigue effect of 200 and
a fitness effect of 0.8. (Note that these are abstract figures to illustrate the impact
of a training stimulus). This fitness and fatigue effect is in addition to the existing
fitness level of 80 and fatigue level of 25.
This results in a fitness level of 80.8, which is the existing fitness of 80 plus the fit-
ness of 0.8 acquired through the match, and a fatigue of 225 (200 + 25). The prepa-
redness is the difference between fitness and fatigue. After the match, this is then
-144.2 (fitness – fatigue = preparedness). Although the fitness level increased due to
the load of the match, the preparedness dropped immediately following the match.
The increased level of fatigue masks the increase in fitness. It is only after an ade-
quate recovery and a reduction training load that the increases fitness levels can
be seen.
Detraining
Preparedness is optmized as
fitness levels are still high but
Fitness levels are high
fatigue has dissipated
but are masked due to
accumulated fatigue
[email protected] 06 Aug 2018
FITNESS IN SOCCER
Training models
27
G
1
2
-4
-3
-2
-1
G
Table 2.1: A theoretical example of how the effects (fitness and fatigue) of training load can be
estimated.
Match day: Before the match, the player displays hardly any fatigue (25). He or
she therefore has the necessary freshness (preparedness level of 55) to play in the
match. After playing the match (training load = 100), the player improves in terms
of fitness due to the game, but fatigue also increases, causing the preparedness to
immediately diminish to -144.2 following the match.
Match day + 1: In this example, the day following the match is a complete rest day
(training load = 0). The player’s fitness level drops slightly but not to the extent
that fatigue drops, meaning the player’s preparedness level starts to rise again.
Depending on his or her physical ability (i.e., speed, endurance, etc.), the player’s
performance level only returns to its pre-match level after 48 to 72 hours.
Match day + 2: Two days after the match, a light training session is organized
(active recovery: training load = 20), resulting in fatigue and fitness continuing to
decrease. The preparedness level, however, rises to approximately 80% of its pre-
match level.
Match day + 3–4: During the third and fourth days after the match, loading stra-
tegies to induce overload are imposed. Fatigue can be increased over these two
days (accumulated fatigue) to induce acute fatigue, disrupt homeostasis and elicit
performance enhancement. After these two days, a player will consequently have
improved fitness, but his or her preparedness will decrease because of accumulated
fatigue.
Match day + 5–6: During these two days, tapering strategies are imposed. The trai-
ning load is reduced through decreased training volume in particular.
In
it
ia
l
le
v
e
l
S
u
n
d
a
y
M
o
n
d
a
y
T
u
e
s
d
a
y
W
e
d
n
e
s
d
a
y
T
h
u
rs
d
a
y
F
rid
a
y
S
a
tu
rd
a
y
S
u
n
d
a
y
Training load
100
0
20
80
65
30
10
0
Fitness effect
0.8
-0.48
-0.24
0.64
0.48
-0.24
-0.4
-0.48
Fitness level
80
80.8
80.32
80.08
80.72
81.2
80.96
80.56
80.08
Fatigue effect
200
-120
-70
160
130
-80
-100
120
Fatigue level
25
225
105
35
195
325
245
145
25
Preparedness
55
-144.2
-24.68
45.08
-114.28
-243.8
-164.04
-64.44
55.08
[email protected] 06 Aug 2018
FITNESS IN SOCCER
Training models
28
Training load distribu9on
120
100
80
60
40
20
0
Days of the week
Fig. 2.7: Training load distribution.
Fitness status
81,4
81,2
81
80,8
80,6
80,4
80,2
80
79,8
79,6
79,4
Days of the week
Fig. 2.8: An example of the evolution of fitness during the training week. Fitness increases slightly
during the week.
Fa#gue status
350
300
250
200
150
100
50
0
Days of the week
Fig. 2.9: The course of accumulated fatigue during a training week. Fatigue increases continuously
during a training week (accumulated fatigue). This especially occurs during the training days of
Wednesday and Thursday, when training can be intense and the load can be high. It is therefore
important to incorporate rest or a significantly reduced load (reduce duration of training) before
a game (tapering) to maximize the fitness effect of the training week (delayed transformation of
gains).
Fi
tn
e
ss
le
ve
l
Fa
#g
u
e
le
ve
l
U
ni
ve
rs
al
T
ra
ini
ng
Loa
d
[email protected] 06 Aug 2018
FITNESS IN SOCCER
Training models
29
Preparedness
100
50
0
-50
-100
-150
-200
-250
-300
Fig. 2.10: The evolution of preparedness over the training week. Preparedness drops after the
match because of the fitness level being masked by accumulated fatigue. Tapering strategies are
used at the end of the week, causing the fatigue to dissipate and performance to increase again.
One of the most important extensions to this model is the “specificity of fatigue.”
This means each physical ability has its own fatigue and fitness curve. For example,
when training endurance, aerobic fitness will increase, but there will be a limited
(or even negative) effect on strength.
Fig. 2.11: A modified fitness-fatigue model representing multiple types of fitness and fatigue
aftereffects. The original model presented the effects of training as one fitness curve and one
fatigue curve. In reality, however, there are specific training effects. For example, sprint training
induces different effects when compared to aerobic fitness training. Consequently, there appears
to be specific windows for the adaptation for each physical ability (Gamble, 2012). Particular acute
adaptive responses are described as being restricted and specific to the systems used in the
training stimulus, rather than a generic response (Chiu and Barnes, 2003).
P
P
re
p
ar
e
d
n
es
s
le
ve
l
Ini$al level
Sunday
Monday
Tuesday
Wednesday
Thursday
Friday
Saturday
Sunday
Performance
55
-144,2
-24,68
45,08
-114,28
-243,8
-164,04
-64,44
55,08
[email protected] 06 Aug 2018
FITNESS IN SOCCER
Training models
30
Fig. 2.12: Fitness-fatigue effects during a microcycle in soccer. The figure depicts the (accumulated)
fitness and fatigue curves, the specific fitness and fatigue aftereffects of training, and the resulting
preparedness curve.
[email protected] 06 Aug 2018
FITNESS IN SOCCER
Training models
31
2.5 PERFORMANCE POTENTIAL MODEL
The fitness-fatigue model has been recently criticized for its inability to predict per-
formance with accuracy, as well as for the fact that the model is poorly corrobora-
ted by physiological mechanisms (Hellard et al., 2006). A different approach was
taken by Perl (2001) with the development of the Performance-Potential (PerPot)
meta-model. This model studies the non-linear interaction between load and per-
formance and is based on the antagonistic concept of PerPot.
In this meta-model, the output (performance potential) is influenced by the input
load (training). This input load is controlled by two internal buffer potentials:
the strain potential and the response potential. Both potentials are influenced
equally by training, and they affect performance in an antagonistic way. After cer-
tain delays, the response potential raises the performance potential and the strain
potential reduces the performance potential. The relationship between these delays
specifies the performance profile. An overflow pathway was added to the basic
structure (Perl, 2004) to allow a breakdown if the load over a period of time beco-
mes too high. This overflow pathway reduces the performance potential with a
small delay. As was described in the fitness-fatigue model, the PerPot parameters
need to be adapted individually based on empirical data. In contrast to the fit-
ness-fatigue model, only a few scientific studies has been conducted to validate
PerPot, although Hellard et al. (2006) postulate that the PerPot method appears to
be conceptually very rich.
[email protected] 06 Aug 2018
FITNESS IN SOCCER
32
Training models
SUMMARY
Training models help coaches to understand the training process and can be used
to design training programs. The supercompensation model helped explain why
performance improves after a period of rest, but this model has been replaced
over the last few decades by the more complete fitness-fatigue model. This model
enables coaches to make more accurate predictions about the impacts of their
training regimes. Preparedness is the combination of fitness and fatigue, and the
main aim of the soccer training program is to ensure the players are physically
fit and fatigue free on game day, so that they can cope with the imposed physical
demands of 90 minutes of competitive play. The physiological demands of soc-
cer are discussed in detail in the next chapter.
REFERENCES
•
Budgett, R. 1998. Fatigue and underperformance in athletes: the overtraining syndrome. Br J Sports Med, 32(2), pp.107–110.
•
Bompa, T.O., and Haff, G., 2009. Periodization: theory and methodology of training, 5th ed., Champaign, IL: Human Kinetics, p.424.
•
Carlile, F., 1961. The Athlete and Adaptation to Stress. Track Technique, 5, pp.156-158.
•
Carlile, F., 1961. Scientific Trends in Training the Sportsman. Track Technique, 3, pp.84-88.
•
Chiu, L.Z.F. and Barnes, J.L., 2003. The Fitness-Fatigue Model Revisited – Implications for Planning Short- and Long-Term Training.
Strength and Conditioning Journal, 25(6), pp.42-51.
•
Folbrot, 1941. In: M.C. Siff and Y.V. Verkhoshansky (1999). Supertraining. (4th ed.). Denver, CO., p.81.
•
Gamble, P., 2012. Strength and Conditioning for Team Sports Sport-Specific Physical Preparation for High Performance, Second Edition.
Abingdon: Routlegde.
•
Matvejev, L., 1964. Das problem der periodisierung des sportlichen trainings [The problem of the periodization in sports training].
Moscow.
•
Mohr, M., Krustrup, P. and Bangsbo, J., 2005. Fatigue in soccer: a brief review. Journal of sports sciences, 23(6), pp.593-599.
•
Pfeiffer, M., 2008. Modeling the Relationship between Training and Performance—A Comparison of Two Antagonistic Concepts. Int. J.
Comp. Sci. Sport, 7(2).
•
Perl, J., 2001. PerPot: a Metamodel for simulation of load performance interaction. Electronic Journal of Sport Science, 2.
•
Perl, J., 2004. A neural network approach to movement pattern analysis. Human Movement Science, 23, pp.605-620.
•
Perl, J., 2005. Dynamic Simulation of Performance Development: Prediction and Optimal Scheduling. International Journal of Computer
Science in Sport, 4(2), pp.28-37.
•
Perl, J., 2006. Interaction in Games: Qualitative Analysis by Means of the Load-Performance-Metamodel PerPot. International Journal of
Computer Science in Sport, 5(2), pp.38-41.
•
Prokop, L. and Rössner, F., 1959. Erfolg im Sport: Theorie und Praxis der Leistungssteigerung. H.S. Fürlinger.
•
Selye H., 1938. Experimental Evidence Supporting the Conception of “Adaptation Energy.“ Am J Physiol, August 31 123:(3), pp.758-765.
•
Selye H., 1946. The General Adaptation Syndrome and the Diseases of Adaptation. The Journal of Clinical Endocrinology & Metabolism,
February 1 6(2), pp. 117-230.
•
Steinacker, J.M. and Lehmann, M., 2002. Clinical findings and mechanisms of stress and recovery in athletes. In: Kellmann, M., ed. 2002,
Enhancing recovery: preventing underperformance in athletes. Champaign, IL: Human Kinetics, pp.103–118.
•
Yakovlev N., 1967. Sports biochemistry. Leipzig: Deutche Hochschule für Körpekultur.
[email protected] 06 Aug 2018
FITNESS IN SOCCER
The physical demands of elite soccer match play
33
3
THE PHYSICAL DEMANDS
OF ELITE SOCCER MATCH PLAY
Paul Bradley
3.1
INTRODUCTION
Time-motion analysis is a valuable data-collection technique used to quantify the
match performances of elite soccer players (Carling et al., 2008). Interest has sub-
stantially grown in this area over the last decade, because it enables sports scien-
tists to identify the current demands placed on players in competition and apply
the data to training and testing protocols (Bradley et al., 2011). This has been dri-
ven, above all, by the availability of new technologies that help further our know-
ledge of training and testing modes to optimize soccer performance (Castellano et
al., 2011). One such technology regularly used in elite soccer involves semi-automa-
ted monitoring through video tracking, using systems from match analysis compa-
nies, such as Prozone® and Amisco®, to simultaneously track the movements of
all players, the referee and the ball. This chapter therefore aims to detail the factors
that impact the physical demands of modern elite soccer with special reference to
position, gender, and standard, as well as contextual influences and fatigue.
3.2 ACTIVITY PROFILE
The activity profile of soccer is intermittent, with players regularly alternating bet-
ween brief bouts of high-intensity exercise and longer periods of low-intensity exer-
cise (Rampinini et al., 2007). During elite matches, players cover 9–14 km of distance
in total, with high-intensity exercise accounting for 1–3 km of this (Bangsbo et al.,
1991; Bradley et al., 2009; Di Salvo et al., 2009; Mohr et al., 2003). This results in an
average intensity of approximately 70% of maximal oxygen uptake and elicits blood
lactate concentrations of 4-6 mmol/L (Mohr et al., 2005). However, expressing match
intensity as an average value disguises the unique physiological stress induced
during intense periods (Glaister, 2005). During these periods, heart rate (HR) can
exceed 95% of its maximum, and peak blood lactate concentrations can reach
8-12 mmol/L (Ali and Farrelly, 1991; Bangsbo, 1994). During a typical English Pre-
mier League match, players stand still for 6% of the total time. Low-intensity activity
represents 85% of the total time, which comprises 59% walking and 26% jogging.
High-intensity activity represents 9% of the total time, which is broken down further
into 6% running, 2% high-speed running, and 1% sprinting (Figure 3.1).
[email protected] 06 Aug 2018
FITNESS IN SOCCER
The physical demands of elite soccer match play
34
100%
80%
60%
40%
20%
0%
3.3 POSITIONAL VARIATION
The large differences observed between various playing positions for the energetic
and physical performance characteristics of elite players is one of the most robust
findings from time-motion analysis studies (Di Salvo et al., 2009; Bradley et al.,
2009; Rampinini et al., 2007). When comparing the five most-common positions, it
is clear that central and wide midfielders cover more total distance than any other
position, with the wide midfielders and fullbacks also displaying superior high-in-
tensity activity profiles (Bradley et al., 2009). The attackers and central defenders
consistently show the lowest physical performances during a game (Figure 3.2).
These findings have implications for developing position-specific training drills
that mimic the characteristics of each position by taking into consideration the uni-
que tactical, technical and physical demands of various positions in the team (Di
Salvo et al., 2007). Thus, separate drills for each position can be constructed, eit-
her as a rehabilitation tool or for isolated drills. However, conditioning simulation
drills in which all positions are worked together in unison with game- and posi-
tion-specific ball work are much more fruitful in the applied environment due to
player enjoyment and coach acceptance.
100%
80%
60%
40%
20%
0%
Playing Time
Distance Covered
High-Intensity Running
Sprinting
High-speed running
Running
Jogging
Walking
Standing
Fig. 3.1: Average values of different activities during English Premier League matches. Values are
expressed both as a percent of total playing time and distance covered (Data from Bradley et al.,
2009).
T
ot
a
l
(%)
[email protected] 06 Aug 2018
FITNESS IN SOCCER
The physical demands of elite soccer match play
35
4000
3500
3000
2500
2000
1500
1000
500
0
Central Defenders
Full Backs
Central Midfielders Wide Midfielders
Attackers
Playing Position
Fig. 3.2: Positional variation in high-intensity running profiles during English Premier League
matches (Data from Bradley et al., 2009).
3.4 COMPETITIVE STANDARD
Research has shown players at a higher standard of play to perform more high-in-
tensity running than their peers at lower standards (Bangsbo et al., 1991; Mohr et
al., 2008). For instance, Mohr et al. (2003) found that elite Italian League players
performed 28% more high-intensity running than sub-elite Danish League peers.
Similarly, Ingebrigtsen et al. (2013) reported that distance covered in high-intensity
running was 31–38% greater in players in top-ranking Danish teams when compa-
red with middle- and bottom-ranking Danish teams. Based on this data, one would
assume that the distances covered at high-intensity increase as we move up the
competitive standards, but this is not entirely correct. For instance, studies demon-
strate that players cover more total distance and perform more high-intensity run-
ning when playing against higher-quality opponents in the same domestic league
(Castellano et al., 2011; Di Salvo et al., 2009; Rampinini et al., 2007).
There are also no differences in the activity profiles of international players and
those who play in the best domestic European leagues (Bradley et al., 2010). Thus,
the relationship between competition standard and physical match performance is
more complex than we might initially think. Interestingly, English Premier League
players (top tier) cover less distance at high-intensity than Championship (middle
tier) and League 1 players (bottom tier) (Figure 3.3). Given there were no real dif-
ferences in the physical capacity of the players at each tier, it was concluded that
this trend was related to the style of play used in the lower tiers, with the Cham-
pionship and League 1 teams employing a more direct style of play while the Pre-
mier League teams used a more possession-based style. This was evidenced by
H
ig
h
-i
n
te
n
s
it
y
r
u
n
n
in
g
(
m
)
[email protected] 06 Aug 2018
FITNESS IN SOCCER
The physical demands of elite soccer match play
36
more successful passes in the Premier League and more long passes, headers, clea-
rances and interceptions in the lower tiers (Bradley et al., 2013a). Thus, it seems that
tactical variables and style of play have an influence on the distances covered by
elite players. It is important to note that while Premier League players cover shor-
ter match distances at high intensity, it does not necessarily mean the overall match
demands are markedly different than in the lower tiers, because Premier League
players may display superior accelerations or decelerations and lateral movement
profiles that are metabolically taxing (Osgnach et al., 2010).
Fig. 3.3: Very high-intensity running profiles in the English Premier League (EPL), Championship
(Ch) and League 1 (L1) players. (Data from Bradley et al., 2013a).
3.5 GENDER DIFFERENCES
The relative physiological loadings experienced during matches are similar for
both genders, suggesting that the aerobic system is heavily taxed throughout mat-
ches, particularly during intense periods (Bangsbo, 1994; Krustrup et al., 2003, 2005,
2006, 2010; Mohr et al., 2004). Female players, however, seem to possess a lower
physical capacity than male players across a range of aerobic and anaerobic fitness
tests (Bradley et al., 2011, 2012; Mujika et al., 2009). Thus, it is not surprising that
studies have reported that high-intensity running in elite female matches is around
30% lower than that of their male counterparts at a similarly competitive standard
with similar total distances (Krustrup et al., 2005; Mohr et al., 2008). Recently, Brad-
ley et al. (2013b) analyzed the gender differences in the match performance charac-
teristics for male and female players taking part in the UEFA Champions League.
They found that while male players covered just ~2-5% more total distance than
female players, they performed ~30-35% more high-intensity running and had a
superior technical performance (Table 3.1). This finding illustrates the importance
of high-intensity running to the female game and the inferior anaerobic capabilities
of female players when compared to elite male players. Practical applications are
clear, and this suggests that elite female players may possibly benefit from speci-
fic high-intensity aerobic and speed endurance training in the form of small-sided
games or generic running drills (Ade et al., 2013).
[email protected] 06 Aug 2018
FITNESS IN SOCCER
The physical demands of elite soccer match play
37
Physical/Technical
Indicators
Male Players
Female Players
First
Second
Total
First
Second
Total
High intensity (m)
1049
1063
2112
854
718
1571
Time possession (s)
33.8
35.8
69.6
34.6
31.9
66.5
Total balls lost (No.)
7.5
5.1
12.6
9.2
8.2
17.4
Successful passes (%) 78.1
80.1
79.4
72.0
70.4
71.5
Table 3.1: Gender differences in physical and technical indicators for elite players in the UEFA
Champions League (data from Bradley et al., 2013b).
3.6
MATCH-TO-MATCH VARIABILITY AND STABILITY
When players’ match performances are analyzed across a season, it is very evident
that substantial differences exist between games. Mohr et al. (2003) reported that
the high-intensity running distances of elite players differed by approximately 10%
between successive matches but it differed by 25% between different stages of the
season using the coefficient of variation as the variability measure. Gregson et al.
(2010) also found that English Premier League players’ high-intensity and sprint
profiles differed by 16–30% from one match to the next. The technical profiles of
players seem to also illustrate similar differences, with the total number of passes
for English Premier League players differing by approximately 30-50% from match
to match (Bush et al., unpublished observation). This makes it very difficult for
sports scientists to evaluate the impact of various technical, tactical and physical
training interventions because of limited consistency in the performance measu-
res. Substantial match-to-match variability is less likely to be caused by changes in
physical capacity, because this does not differ substantially in the short term, but it
could also possibly be due to technical, tactical and contextual factors.
3.7 CONTEXTUAL AND TACTICAL FACTORS
Research examining contextual factors—such as match status (i.e., win, lose or
draw), location (i.e., home or away), level of opposition (i.e., top, middle or bot-
tom) and match half—demonstrates these have a real impact on the activity profiles
of elite players (Lago et al., 2012; Catellano et al., 2011). For instance, Castellano
et al. (2011) found the distance covered when the ball was in play (effective play-
ing-time distance) in various movement categories to be greater when playing at
home rather than away, as well as when the opposition team was losing and of a
higher competitive level. Other contextual factors, such as score line but not match
importance, also seem to be important factors in dictating physical performance.
Bradley and Noakes (2013) observed that elite players covered similar high-inten-
sity running distances in matches with differing score lines, but position-specific
trends indicated that central defenders performed 17% less high-intensity running
and attackers 15% more during matches that were decisively won when compared
to matches that were lost. However, high-intensity running distances were com-
[email protected] 06 Aug 2018
FITNESS IN SOCCER
The physical demands of elite soccer match play
38
parable over matches of differing importance (e.g., games linked to relegation or
promotion and local derbies), but trends between halves indicated that declines
only occurred in the second half of critical matches when compared to matches of
less importance.
Tactical factors, such as the playing formation, also seem to be an influential fac-
tor on the physical performance of elite players. For instance, no differences were
found in the overall physical profiles of players playing in 4-4-2, 4-3-3 and 4-5-1 for-
mations, but high-intensity running with ball possession in offensive and orthodox
formations was approximately 30–40% higher than it was in defensive formations
(i.e., 4-3-3 and 4-4-2 vs. 4-5-1). In contrast, around 20% more distance was covered
at high-intensity without possession in defensive formations when compared to
offensive and orthodox formations (Bradley et al., 2011). This coincided with the
lowest ball possession for the defensive formation when compared to the offensive
and orthodox formations (44% vs. 50%), so ball possession could have been a fac-
tor. This clearly indicates the complexity of match play, and sports scientists and
coaches need to consider various contextual and technical factors before making
inferences from the time-motion data supplied by match analysis companies.
3.8 FATIGUE DURING MATCH PLAY
Research demonstrates that physical perfor-
mance declines between the first and second
halves of elite match play (Di Salvo et al.,
2009; Mohr et al., 2003), although others only
observe minimal differences (Bradley et al.,
2013a). Reductions in match running per-
formance in the second half, or temporarily
after the most intense period, could be attri-
buted to fatigue (Bradley et al., 2009; Ben-
diksen et al., 2012; Di Mascio and Bradley,
2013; Krustrup et al., 2006), pacing strategies
(Bradley and Noakes, 2013), or contextual
variables (Lago et al., 2012). They could also
be related to the time the ball is out of play
and the available opportunities to engage in
match activities (Carling and Dupont, 2011).
Although each factor has the potential to
impact the physical performances of elite
players, match-induced fatigue seems evident, because physical capacity markedly
declines after matches in comparison to baseline measures (Krustrup et al., 2010;
Mohr et al., 2004). Thus, fatigue results in an inability to repeatedly cover distances
during critical situations, and it could also reduce technical capabilities that are
important indicators of match outcome (Rampinini et al., 2009). Down regulation
of running performance in the second half could be attributed to fatigue because
studies have reported depleted muscle glycogen stores at the end of a match (Ben-
diksen et al., 2012; Krustrup et al., 2006).
[email protected] 06 Aug 2018
FITNESS IN SOCCER
The physical demands of elite soccer match play
39
There are also temporary declines after intense periods of match play that are rela-
ted to depletions in muscle creatine phosphate, changes in intramuscular acidosis,
or the accumulation of potassium in the muscle interstitium (Krustrup et al., 2006).
Alternatively, some suggest that reductions in match running performance could
be caused by players employing conscious or subconscious pacing strategies aimed
at successfully completing the match (Bradley and Noakes, 2013). Although this is
an attractive hypothesis, there is limited data to support or reject such a statement.
Carling and Bloomfield (2010) observed how teams coped with an early player dis-
missal by sparing low-intensity activity in an attempt to preserve essential high-in-
tensity running, and this possibly suggests pacing or modified tactics. If players
pace their efforts, then only covering “low” to “moderate” distances in the first half
enables them to have the available capacity to maintain match running performan-
ces in the second half. Although, some studies have established this, it is important
to realize that other factors could be responsible for these findings (Bradley and
Noakes, 2013; Rampinini et al., 2007).
It seems players don’t really tax their full physical capacity during matches, but
they certainly do during intense periods when they perform a flurry of high-in-
tensity bouts with minimal recovery, such as during the peak five-minute period.
If you observe the following five-minute period, you will typically see it is 8–12%
below the game mean, possibly indicating temporary fatigue (Figure 3.4). The prac-
tical application of these findings is that sports scientists should condition players
to be able to cope with multiple bouts of intense actions with speed endurance
drills in small-sided games or with a generic drill format (Ade et al., 2013). Typi-
cally, speed endurance maintenance training would be best for this, and coaches
should employ exercise bouts with a varied duration (e.g., 30–90 seconds) with
reduced rest periods (e.g., 1–3 times the exercise duration) across 6–12 repetitions.
Research recommends this type of training to enhance the players’ capacity to sus-
tain high-intensity actions and recover from intense periods (Bangsbo, 1994; Iaia
and Bangsbo, 2010).
Fig. 3.4: The most intense period of English Premier League matches and the drop in performance
in the following five-minute period when compared to the mean five-minute period.
[email protected] 06 Aug 2018
FITNESS IN SOCCER
40
The physical demands of elite soccer match play
SUMMARY
During elite matches, players cover 9–14 km of distance in total, with high-in-
tensity movement accounting for 1–3 km. Central and wide midfielders typically
run more total distance than all other positions, with the wide midfielders and
fullbacks also displaying superior high-intensity activity profiles. Central defen-
ders tend to exhibit the lowest physical performances during a game. However,
the physical profiles of players in various competitive standards are influenced
by the technical, tactical, and physical aspects of the game. For instance, in the
English game, lower-tier teams use a more direct style of play compared to the
top-tier teams, and this results in more distance covered at high intensity. The
distance covered by players is also influenced by match location, opposition
standard, score line and game half. Substantial match-to-match variability is
evident in the physical and technical performance measures for elite soccer. This
is unlikely to be due to changes in physical capacity, but it could possibly be
caused by technical, tactical and contextual factors. Finally, reductions in match
running performance in the second half, or temporarily after the most intense
period, could be attributed to pacing strategies, contextual variables, and deple-
ted muscle glycogen levels. Good nutritional practice may help to attenuate the
decrement in running performance in the second half of matches. The impor-
tance of nutrition in soccer is discussed in the following chapter.
[email protected] 06 Aug 2018
FITNESS IN SOCCER
The physical demands of elite soccer match play
41
REFERENCES
•
Ade, J., Harley, J. and Bradley, P.S. (in review). The Physiological Response, Time-Motion Characteristics and Reproducibility of Various
Speed Endurance Drills in Elite Youth Soccer Players: Small Sided Games vs Generic Running. Int J Sports Phy and Perf.
•
Ali, A. and Farrally, M., 1991. Recording soccer players’ heart rates during matches. J Sports Sci, 9, pp.183-189.
•
Bangsbo, J., 1994. The physiology of soccer--with special reference to intense intermittent exercise. Acta Physiol Scand Suppl, 619,
pp.1-155.
•
Bangsbo, J., Norregaard, L. and Thorso, F., 1991. Activity profile of competition soccer. Can J Sport Sci, 16, pp.110-116.
•
Bendiksen, M., Bischoff, R., Randers, M.B. Mohr, M., Rollo, I., Suetta, C., Bangsbo, J. and Krustrup P., 2012. The Copenhagen Soccer Test:
physiological response and fatigue development. Med Sci Sports Exerc, 44, pp.1595-1603
•
Bradley, P.S., Bendiksen, M., Dellal, A., Mohr, M., Wilkie, A., Datson, N., Orntoft, C., Zebis, M., Gomez-Diaz, A., Bangsbo, J. and Krustrup,
P., 2012. The Application of the Yo-Yo Intermittent Endurance Level 2 Test to Elite Female Soccer Populations. Scand J Med Sci Sports.
E-pub ahead of print
•
Bradley, P.S., Carling, C., Archer, D., Roberts, J., Dodds, A., Di Mascio, M., Paul, D., Diaz, A.G., Peart, D., and Krustrup, P., 2011. The
effect of playing formation on high-intensity running and technical profiles in English FA Premier League soccer matches. J Sports Sci,
29, pp.821-830.
•
Bradley, P.S., Carling, C., Gomez Diaz, A., Hood, P., Barnes, C., Ade, J., Boddy, M., Krustrup, P. and Mohr, M., 2013a. Match performance
and physical capacity of players in the top three competitive standards of English professional soccer. Hum Mov Sci, 32, pp.808-821.
•
Bradley, P.S., Dellal, A., Mohr, M., Castellano, J. and Wilkie, A., 2013b. Gender differences in match performance characteristics of soccer
players competing in the UEFA Champions League. Hum Mov Sci, [E-pub ahead of print].
•
Bradley, P.S., Di Mascio, M., Peart, D., Olsen, P. and Sheldon, B., 2010. High-intensity activity profiles of elite soccer players at different
performance levels. J Strength Cond Res, 24, pp.2343-2351.
•
Bradley, P.S., Mohr, M., Bendiksen, M., Randers, M.B., Flindt, M., Barnes, C., Hood, P., Gomez, A., Andersen, J.L., Di Mascio, M., Bangsbo,
J. and Krustrup, P., 2011. Sub-maximal and maximal Yo-Yo intermittent endurance test level 2: heart rate response, reproducibility and
application to elite soccer. Eur J Appl Physiol, 111, 969-978.
•
Bradley, P.S. and Noakes, T.D., 2013. Match running performance fluctuations in elite soccer: indicative of fatigue, pacing or situational
influences? J Sports Sci, 31, pp.1627-1638.
•
Bradley, P.S., Sheldon, W., Wooster, B., Olsen, P., Boanas, P. and Krustrup, P., 2009. High-intensity running in English FA Premier League
soccer matches. J Sports Sci, 27, pp.159-168.
•
Carling, C. and Bloomfield, J., 2010. The effect of an early dismissal on player work-rate in a professional soccer match. J Sci Med Sport,
13, pp.126-128.
•
Carling, C., Bloomfield, J., Nelsen, L. and Reilly, T., 2008. The role of motion analysis in elite soccer: contemporary performance measu-
rement techniques and work rate data. Sports Med, 38, pp.839-862.
•
Carling, C. and Dupont, G., 2011. Are declines in physical performance associated with a reduction in skill-related performance during
professional soccer match-play? J Sports Sci, 29, pp.63-71.
•
Castellano, J., Blanco-Villasenor, A. and Alvarez, D., 2011. Contextual variables and time-motion analysis in soccer. Int J Sports Med,
32, 415-421.
•
Di Mascio, M. and Bradley, P.S., 2013. Evaluation of the most intense high-intensity running period in English FA premier league soccer
matches. J Strength Cond Res, 27, pp.909-915.
•
Di Salvo, V., Baron, R., Tschan, H., Calderon Montero, F.J., Bachl, N. and Pigozzi, F., 2007. Performance characteristics according to play-
ing position in elite soccer. Int J Sports Med, 28, pp.222-227.
•
Di Salvo, V., Gregson, W., Atkinson, G., Tordoff, P. and Drust, B., 2009. Analysis of high intensity activity in Premier League soccer. Int
J Sports Med, 30, pp.205-212.
•
Glaister, M., 2005. Multiple sprint work: physiological responses, mechanisms of fatigue and the influence of aerobic fitness. Sports
Med, 35, pp.757-777.
•
Gregson, W., Drust, B., Atkinson, G., and Salvo., V.D., 2010. Match-to-match variability of high-speed activities in premier league soccer.
Int J Sports Med, 31, pp.237-242.
•
Iaia, F.M. and Bangsbo, J., 2010. Speed endurance training is a powerful stimulus for physiological adaptations and performance impro-
vements of athletes. Scand J Med Sci Sports, 20(Suppl 2), pp.11-23.
•
Ingebrigtsen, J., Bendiksen, M., Randers, M.B., Castagna, C., Krustrup, P. and Holtermann, A., 2012. Yo-Yo IR2 testing of elite and sub-
elite soccer players: performance, heart rate response and correlations to other interval tests. J Sports Sci, 30, pp.1337-1345.
•
Krustrup, P., Mohr, M., Amstrup, T., Rysgaard, T., Johansen, J., Steensberg, A., Pedersen, P.K. and Bangsbo, J., 2003. The yo-yo intermit-
tent recovery test: physiological response, reliability, and validity. Med Sci Sports Exerc, 35, pp.697-705.
•
Krustrup, P., Mohr, M., Ellingsgaard, H. and Bangsbo, J., 2005. Physical demands during an elite female soccer game: importance of
training status. Med Sci Sports Exerc, 37, pp.1242-1248.
•
Krustrup, P., Mohr, M., Steensberg, A., Bencke, J., Kjaer, M. and Bangsbo, J., 2006. Muscle and blood metabolites during a soccer game:
implications for sprint performance. Med Sci Sports Exerc, 38, pp.1165-1174.
•
Krustrup, P., Zebis, M., Jensen, J.M. and Mohr, M., 2010. Game-induced fatigue patterns in elite female soccer. J Strength Cond Res, 24,
pp.437-441.
•
Lago-Penas, C., 2012. The role of situational variables in analysing physical performance in soccer. J Hum Kinet, 35, pp.89-95.
•
Mohr, M., Krustrup, P. and Bangsbo, J., 2003. Match performance of high-standard soccer players with special reference to development
of fatigue. J Sports Sci, 21, pp.519-528.
•
Mohr, M., Krustrup., P. and Bangsbo, J., 2005. Fatigue in soccer: a brief review. J Sports Sci, 23, pp.593-599.
•
Mohr, M., Krustrup, P., Andersson, H., Kirkendal, D. and Bangsbo, J., 2008. Match activities of elite women soccer players at different
performance levels. J Strength Cond Res 22, pp.341-349.
•
Mohr, M., Krustrup, P., Nybo, L., Nielsen, J.J. and Bangsbo, J., 2004. Muscle temperature and sprint performance during soccer mat-
ches--beneficial effect of re-warm-up at half-time. Scand J Med Sci Sports, 14, pp.156-162.
•
Mujika, I., Santisteban, J., Impellizzeri, F.M. and Castagna, C., 2009. Fitness determinants of success in men’s and women’s football. J
Sports Sci, 27, pp.107-114.
•
Osgnach, C., Poser, S., Bernardini, R., Rinaldo, R. and di Prampero, P.E., 2010. Energy cost and metabolic power in elite soccer: a new
match analysis approach. Med Sci Sports Exerc, 42, pp.170-178.
•
Rampinini, E., Coutts, A.J., Castagna, C., Sassi, R. and Impellizzeri, F.M., 2007. Variation in top level soccer match performance. Int J
Sports Med, 28, pp.1018-1024.
[email protected] 06 Aug 2018
FITNESS IN SOCCER
The physical demands of elitesoccer match play
[email protected] 06 Aug 2018
FITNESS IN SOCCER
Nutrition
43
4
NUTRITION
Jean-Pierre Meert, Sally Hara, David Tenney, Jan Van Winckel
4.1 INTRODUCTION
Nutrition can significantly influence a soccer player’s health and athletic perfor-
mance. Most athletes realize that food choices are important, but many underesti-
mate just how much of an impact the right dietary choices can have on success in
their sport. Good nutrition cannot replace talent, skill, or physical training, but it
can support and enhance all of these. When elite players compete, the small details
often make the difference between a win and a loss. Diet is one such detail. The
foods athletes choose for training and competition will affect their ability to train
and compete. While attention is often given to the composition of pre-match meals,
the everyday training diet is at least as important. A good diet helps promote adap-
tation to training, resulting in greater improvements for the same training load
and/or skills practiced. It also provides nutrients to support the immune system,
aid in post-exercise recovery, minimize injuries, and expedite recovery from inju-
ries. There are many opinions about the best way for athletes to eat, but ultimately,
nutrition is a science rather than an opinion. The emerging field of sports nutrition
involves an understanding of biochemistry, bioenergetics, endocrinology, and exer-
cise science that guides dietary recommendations to help optimize sport perfor-
mance and associated health parameters.
4.2 ENERGY
What is energy? Simply put, energy is the capacity to do work. Food contains
energy, which is ultimately used to power physical activity. Energy is generally
measured in joules (J), where 1 joule is defined as the energy used to move 1 kilo-
gram (kg) a distance of 1 meter (m) with a force of 1 Newton (N). However, the
energy in food is usually measured in calories. A calorie (cal) is defined as the
amount of heat needed to raise the temperature of 1 gram (g) of water by 1 degree
Celsius (°C). In practice, kilocalories are typically used (kcal or Cal). One kcal or
Cal is equal to 1,000 cal. The conversion of kilojoules (kJ) to kilocalories is done by
dividing the value in kJ by 4.2.
1 kcal = 1 Cal = 1,000 cal
1 kJ = 1,000 J
kcal = kJ/4.2
Example: 1,000 kJ = 238 kcal
[email protected] 06 Aug 2018
FITNESS IN SOCCER
Nutrition
44
4.2.1 Energy Requirements
Soccer is an intermittent, high-inten-
sity sport with a high energy expendi-
ture. It is characterized by short bursts
of high-intensity activity combined with
intermittent bouts of rest or low-inten-
sity aerobic activity (e.g., walking or jog-
ging). Studies estimate the average heart
rate of players during a match to be
approximately 85% of maximum heart
rate (HR
max), with a corresponding respi-
ration of 70–75% maximum oxygen con-
sumption (VO
2max). This suggests that
average exercise intensities are around
the lactate threshold, with periods above
and below this threshold during high
energy bursts and recovery periods, res-
pectively. This indicates that the energy
demands are high, so attention must be
given to supplying adequate fuel for
training and competition. It has been
estimated that professional male soccer
players expend about 1,500 kcal per match. Energy expenditure for female players
has been estimated at approximately 1,100 kcal per match. This gender difference is
due in part to smaller body mass and differences in body composition, but it is also
likely linked to a greater tendency by female athletes to significantly under-fuel,
suggesting their performance may become more compromised as the game pro-
gresses because of fatigue caused by low fuel availability. Indeed, with both male
and female players, one of the most common nutritional errors is under-fueling,
resulting in early fatigue, decreased performance, and increased errors and inju-
ries. The total energy requirement for each player is unique and a combination of
the requirements of the basal metabolic rate, the thermal effect of food, the thermal
effect of activity, and in some instances, growth (Burke et al., 2006).
4.2.1.1
A soccer
player’s energy consumption
A player’s energy expenditure can be expressed in an equation that includes the
following elements:
1. Resting metabolic rate (RMR), which consists of the basal metabolic rate
(BMR) and the sleep metabolic rate (SMR)
2. Thermal effect of food (TEF)
3. Energy expenditure for activities of daily living or the thermal effect of the
activities concerned
4. Energy for the player’s sporting activities.
[email protected] 06 Aug 2018
FITNESS IN SOCCER
Nutrition
45
4.2.2 Metabolism
To determine an athlete’s energy requirements, we must start by assessing the base-
line energy needs. Basal metabolic rate (BMR) is the minimum level of energy requi-
red to sustain the vital functions of the human body and regulate body temperature
when awake. A person’s BMR is influenced by age, gender, weight, diet, exercise
and ambient temperature. BMR is calculated based on a person’s oxygen consump-
tion. When resting, the body consumes about 0.3 liters of oxygen per minute and
burns a mixture of (mostly) carbohydrates (CHOs) and fat as fuel. Although the
average non-athlete burns around 2,000 kcal per day, figures over 10,000 kcal/day
have been measured in elite athletes. Beyond the kcal needed for vital functions,
additional energy is needed for the activities of daily life and physical exercise.
When added to the BMR, this is referred to as the active metabolic rate (AMR) and
represents the total number of kcal burned on a typical day.
Several formulas have been developed to estimate BMR values. The equation most
widely accepted to be the most accurate is the Miffl Jeor Equation (kcal/day):
When possible, it is always best to use measured BMR values because studies sug-
gest that calculated values may underestimate the energy expenditure of trained
athletes. This is likely due to higher than average muscle mass and physiological
adaptations to training.
The quantity of energy calculated for BMR is multiplied by an activity factor to
account for relevant daily activity:
In most cases, a player’s daily activity level outside of the sport can be described as
light. Energy needs can thus be estimated by BMR (using the Mifflin-St Jeor Equa-
tion above) and then multiplying the result by an activity factor of 1.3. The kcals
associated with sporting activities are then added.
The energy requirements for sporting activities can be calculated separately using
metabolic equivalent (MET) values. One metabolic equivalent (MET) is defined as
the metabolic rate for someone at rest sitting quietly in a chair (which corresponds
to approximately 3.5 ml O
2/kg/min). The MET value for soccer is generally accep-
ted to be 10.3 (kcal/kg/hr), but it may be higher in some elite athletes.
The energy expenditure for an activity is calculated using the following equation:
(kg body wt) x (MET value) x (hours of activity) = kcal for activity
Very low BMR * 1.3
Low BMR * 1.6
Moderate BMR * 1.7 High BMR * 2.1
Male:
(9.99 x weight) + (6.25 x height) – (4.92 x age) +
5
Female: (9.99 x weight) + (6.25 x height) – (4.92 x age) – 161
weight in kilograms, height in centimeters, age in years
[email protected] 06 Aug 2018
FITNESS IN SOCCER
Nutrition
46
Example: For a 20-year-old male athlete who is 185 cm tall and weighs 80 kg
• Mifflin-St Jeor Equation
(9.99 x 70) +(6.25 x 185 cm) – (4.92 x age) + 5
= 799.2 + 1156.25 – 98.4 = 1857.05 kcal/day (calculated BMR)
• Activity factor to allow for activities of daily living
(1857.05 kcal/day) x 1.3 = 2414.2 kcal/day
• Add in energy needs for 90 minutes of training or game
(80 kg) x (10.3 MET) x (1.5 hr) = 1,236 kcal due to sporting activity
• Total energy requirement per day =
(2,414.2 kcal) + (1,236 kcal) = 3,650.2 kcal/day
4.3 SUBSTRATE UTILIZATION AND MACRONUTRIENT NEEDS
There are four sources of energy in the human diet.
1. CHOs
2. fats
3. proteins
4. alcohol
Energy value of the various nutrition components:
1 g of CHO
=
16 kJ or 4 kcal
1 g of fat
=
37 kJ or 9 kcal
1 g of protein
=
17 kJ or 4 kcal
1 g of alcohol
=
23 kJ or 7 kcal
CHOs and fats are the primary sources of energy for metabolic processes. While
protein can supply energy, it is not its primary function. Protein (or its subcompo-
nents, amino acids) are the building blocks of cells, so the body prioritizes them
as an available substrate for building and
repairing muscles and other tissues. Under
normal resting conditions, protein only con-
tributes 10% or less of the body’s total energy.
However, the body is resourceful, and it will
use whatever is available for fuel, so if there
is limited CHO available, the body will burn
a higher percentage of protein and fat as fuel.
Since fat cannot be used as fuel under anae-
robic conditions, this means a greater percen-
tage of protein is used for fuel when CHO is
limited during intense exercise. The source
of that protein is either muscle catabolism or
free amino acids, which will then be unavaila-
ble for muscle repair and recovery. A player
whose diet is inadequate in CHOs will the-
refore have compromised performance and
recovery.
[email protected] 06 Aug 2018
FITNESS IN SOCCER
Nutrition
47
4.3.1 Carbohydrates (CHO)
4.3.1.1
Varieties
CHOs are composed of carbon, hydrogen and oxygen. Their only function is to
provide a continuous source of energy to cells.
They are classified based on the number of saccharides (sugar molecules) or their
degree of polymerization.
1. Monosaccharides: glucose, fructose and galactose. These single-molecule sugars
are the basic units of all CHOs.
2. Disaccharides: sucrose, lactose and maltose. These contain two sugars attached
to each other. The well-known sucrose, used on a daily basis as table sugar, con-
tains a glucose molecule and a fructose molecule.
Sucrose = glucose + fructose (table sugar)
Lactose = glucose + galactose (milk sugar)
Maltose = glucose + glucose
3. Oligosaccharides are short chains of three to ten monosaccharides linked
together. These are commonly found in dried beans and peas (legumes).
4. Polysaccharides are polymers derived from glucose. These are chains of ten or
more monosaccharide units linked together. There are short-chain (10–15 mono-
saccharide units) products, which are used in sports drinks, obtained through
the enzymatic breakdown of starch and other long-chain products. Starch is
the form in which CHOs are stored in plants. Most starches can be easily bro-
ken down in people’s intestines via enzymes, but a subcategory, referred to as
resistant starch, is more difficult to digest. Resistant starch can be defined as any
starch that escapes digestion in the small intestine and passes to the large inte-
stine for fermentation by the microflora residing there. Some starches that can
be broken down are made resistant by the way they are treated. For example,
baked potatoes that are kept in the refrigerator become resistant. There are two
forms: amylose, a linear chain of glucose molecules, and amylopectine, a highly
branched chain of monosaccharides. There are also non-starch forms, such as
cellulose, pectins and gums. These are classified as fibers and cannot be digested
by humans, but they can be beneficial in regulating bowel function and blood
cholesterol levels.
[email protected] 06 Aug 2018
FITNESS IN SOCCER
Nutrition
48
Training sessions of 2 hours
4.3.1.2
Properties
CHOs are energy providers. This is their main function. Monosaccharides and
disaccharides are sometimes referred to as simple sugars. They are typically sweet
and often used for taste and stimulating appetite. Fructose is the sweetest, with
sucrose, glucose, maltose and lactose in decreasing order of sweetness.
Because simple sugars are easily digested and quickly absorbed into the blood
stream, they are also described as fast sugars, and they are especially useful where
sugar is needed immediately to help increase or maintain blood sugar levels. Thus,
they can provide a quick and easily digested fuel source during sporting activity
as well as aid in glycogen repletion and provide a fuel source for post-exercise
recovery.
Oligosaccharides and polysaccharides are collectively known as complex CHOs,
and these are slower to digest and absorb into the blood stream. Because of this,
they provide a more gradual and sustained rise in blood glucose than an equivalent
amount of simple sugars. These are primarily the starches. They also have impor-
tant roles in sports nutrition:
• They have an important part in glycogen recovery: 8–10 g of CHO per kg of
body weight per 24 hours.
• They help in the immediate recovery after a match or training session: possi-
bly replenishing 1g per kg of body weight.
• 3-4 hours before a match: 4 g of CHO per kg
• During physical exertion: 30–60 g of CHO per hour (can be a combination of
simple CHOs and easily digested complex CHOs, as tolerated by individual
athletes).
140
120
100
80
70% Carbohydrate diet
60
40% Carbohydrate diet
40
20
0
1
2
3
4
Days
Fig. 4.1: CHO reserves
CHO reserves in the form of glycogen in the muscles. In the case of a low-CHO diet, a series of
training sessions will lead to depletion of the muscle glycogen. A high-CHO diet will maintain the
muscle glycogen reserves at an acceptable level.
M
u
sc
le
G
ly
co
gen
(
m
m
o
l/
kg
)
[email protected] 06 Aug 2018
FITNESS IN SOCCER
Nutrition
49
4.3.1.3
Glycemic index and glycemic load
The glycemic index (GI) is a means of identifying the relative rate at which various
types of CHOs are converted to blood glucose when consumed (Table 4.1). The clo-
ser this figure is to 100), the more quickly the blood sugar will rise after the CHO is
consumed. CHOs with a high GI are absorbed quickly and can therefore be inge-
sted during physical exertion.
The term “glycemic load” was introduced in recent years to describe the relative
glycemic response of a normal portion. For example, 50g of glucose has a higher
glycemic load than 50g of carrots. The values used for this are 1–10 for a low load,
11–20 for a medium load and more than 20 for a high load.
Food
Glycemic
index (glucose
= 100)
Serving size
(g)
Glycemic
load per
serving
Bakery products and breads
Baguette, white, plain
95
30
15
White wheat flour bread
71
30
10
Whole wheat bread, average
71
30
9
Wheat tortilla
30
50
8
Beverages
Coca Cola®, average
63
250 mL
16
Fanta®, orange soft drink
68
250 mL
23
Apple juice, unsweetened, average
44
250 mL
30
Gatorade
78
250 mL
12
Orange juice, unsweetened
50
250 mL
12
Breakfast cereals and related products
Cornflakes™, average
93
30
23
Muesli, average
66
30
16
Special K™ (Kellogg’s)
69
30
14
Couscous, average
65
150
9
White rice, average
89
150
43
Quick cooking white basmati
67
150
28
Brown rice, average
50
150
16
Dairy products and alternatives
Milk, full fat
41
250mL
5
Reduced-fat yogurt with fruit, average
33
200
11
Fruits
Apple, average
39
120
6
Banana, ripe
62
120
16
[email protected] 06 Aug 2018
FITNESS IN SOCCER
Nutrition
50
Beans and nuts
Baked beans, average
40
150
6
Cashews, salted
27
50
3
Peanuts, average
7
50
0
Pasta and noodles
Fettucini, average
32
180
15
Macaroni, average
47
180
23
Spaghetti, white, boiled, average
46
180
22
Spaghetti, white, boiled 20 min, average
58
180
26
Spaghetti, wholemeal, boiled, average
42
180
17
Snack foods
Corn chips, plain, salted, average
42
50
11
Microwave popcorn, plain, average
55
20
6
Potato chips, average
51
50
12
Vegetables
Green peas, average
51
80
4
Carrots, average
35
80
2
Boiled white potato, average
82
150
21
Miscellaneous
Hummus (chickpea salad dip)
6
30
0
Pizza, plain baked dough, served with
parmesan cheese and tomato sauce
80
100
22
Table
4.1: “International tables of glycemic index and glycemic load values: 2008” by Atkinson et al.
(2008)
Recovery
25
20
15
10
5
Carbohydrate diet
0
Fat and protein diet
Hours recovery
Fig. 4.2: Effect of diet and the recovery of muscle glycogen reserves after a two-hour training
session
M
us
cl
e
gl
yco
gen
(
m
g/
kg)
[email protected] 06 Aug 2018
FITNESS IN SOCCER
Nutrition
51
4.3.2 Fat
The FATmax zone is the zone where energy is provided primarily by the oxidation
of fat. This zone is located between 55% and 70% of VO
2max or between 65% and
75% of the HR
max. This zone varies considerably between individuals.
It is flawed to claim that the best way of burning fat is through long, monotonous
endurance training. A well-trained athlete burns approximately 220 kcal during
a 30-minute run at 50% of VO
2max. If the same person ran at 75%, he or she would
then burn 330 kcal. At 50% of VO
2max, 50% is produced by the burning of fat, while
the equivalent figure at 75% of VO
2max is 33%. This means that the same amount of
fat is burned in both cases (i.e., 50% of 220 kcal and 33% of 330 kcal, resulting in
110 kcal being consumed from burning off fat in both cases). However, the more
intensive workout at 75 % of VO
2max consumes another 220 kcal from other sources.
This means the more intensive workout will burn more kcal than the low-intensity
exercise, but it will utilize different energy substrates. Additionally, not all fat bur-
ned as a result of exercise is burned during exercise. While CHO may be the pri-
mary fuel used during high-intensity exercise, fat is a significant source of energy
during post-exercise recovery when ample oxygen is available.
4.3.2.1
Dietary Fats
Fats are an important part of a well-balanced diet and have many crucial functions
in the body. They are components for cell membranes, hormones, and of the myelin
sheath that protects nerve cells. Fats are also necessary for temperature regulation,
shock absorption, and the transportation and absorption of fat-soluble vitamins (A,
D, E, and K).
Fat can be used as a fuel during physical exercise and is a significant source of fuel
for physical exertion of a moderate to low intensity (<60% VO
2max) and long dura-
tion (> 30 minutes).
The utilization of fat as an energy substrate requires adequate oxygen, so it is only
a significant source of fuel under aerobic conditions. During high-intensity, anae-
robic activity, there is insufficient oxygen for fat to be oxidized. Other factors that
affect the body’s ability to use fat as a fuel include the number of mitochondria in
the muscle cells and the ratio of different types of muscle fibers. Type I muscle tis-
sue tends to store more triglycerides than type II muscle tissue.
4.3.2.2
Saturated and unsaturated fatty acids
Dietary fats are typically differentiated by their positive or negative effects on our
health. When consumed in excess, saturated fats and trans fats are believed to have
detrimental effects on blood cholesterol levels, possibly contributing to high LDL
cholesterol, cardiovascular disease, and inflammation. With the exception of tropi-
cal oils such as coconut oil and palm oil, most saturated fats come from animal
sources and are relatively solid at room temperature. Examples include butter,
cheese, lard, and fats found in meat and poultry. Trans fats, also known as hydro-
genated fats, are found primarily in processed foods. Monounsaturated fats are
considered to belong to the group of “good fats,” because they are believed to have
a positive effect on cardiovascular health and blood cholesterol. Monounsatura-
ted fatty acids are found in olive oil, avocados, and nuts. Omega-3 fatty acids are
another beneficial dietary fat. They are believed to help regulate blood cholesterol,
decrease inflammation, and stabilize moods and brain health. Additionally, there is
[email protected] 06 Aug 2018
FITNESS IN SOCCER
Nutrition
52
evidence that omega-3 fats may help protect eye health in athletes whose eyes are
often exposed to the sun. Omega-3 fats are found most commonly and abundantly
in fish oils, but they are also found in a less concentrated form in flax seeds and
flax seed oil.
It is also important to be aware that fat is slow to digest and absorb, and it slows
down the transit absorption of other foods consumed with it. Because of this, it
is wise to avoid high-fat food immediately prior to physical exercise in order to
prevent food from uncomfortably sitting in the stomach during exercise. Likewise,
consuming high-fat foods within the hour immediately following exercise may
slow down the absorption of ingested CHOs and protein enough to interfere with
optimal recovery. However, if consumed later, post-exercise dietary fats may be a
good source of energy to help meet the high demands of the sport.
4.3.3 Proteins
The amino acids supplied by dietary proteins are used in the body as building
blocks for growth and the maintenance of muscle and organ tissue. They are also
used for repairing other damaged tissues. Proteins can be used to build muscles and
other tissues (anabolism) and can be broken down into amino acids (catabolism).
Although not a preferred fuel, amino acids can be used as an energy source during
exercise. The oxidation of protein during exercise is inversely related to glycogen
availability. Thus, consuming a diet rich in CHO, which helps maximize glycogen
stores, will in turn decrease the use of protein as a fuel source. This protein-sparing
effect helps prevent the catabolism of muscle protein and the subsequent need to
restore it during recovery (or the resulting risk of injury if not restored). Without
adequate dietary CHO, an athlete’s protein requirements increase because of incre-
ased protein needed for recovery and for fuel. When the diet contains enough
CHO, protein needs are relatively small. Although athletes do have higher protein
requirements than the general population, the requirements are not nearly as high
as many athletes or coaches suspect.
Proteins are composed of amino acids. There are 20 amino acids, of which eight are
considered essential. Essential amino acids must be obtained from the diet because
the human body cannot synthesize them. The biological value (BV) of a protein
refers to its completeness for supplying essential amino acids. Animal proteins
have high biological value, because they contain all of the essential amino acids.
Proteins of plant origin (with the exception of soy protein) lack some of the essen-
tial amino acids, so they are considered to be of lower biological value. In general,
the essential amino acids absent in grains are present in legumes (dried beans, peas
and lentils), and vice versa. Thus, even if a diet contains little or no meat, it can ade-
quately provide all the essential amino acids if it includes a variety of both grains
and legumes. A healthy, balanced diet that contains a variety of foods can easily
supply sufficient protein for even elite athletes.
[email protected] 06 Aug 2018
FITNESS IN SOCCER
Nutrition
53
2
4.4 ATP (ADENOSINE TRIPHOSPHATE)
ATP, or adenosine triphosphate, is the biochemical carrier of energy for the move-
ment of a muscle. We refer to movement rather than contraction because of mus-
cular activity having different movement patterns (i.e., isometric, concentric and
eccentric movement). ATP is present in the muscle cell to a very limited extent,
barely sufficient for a few seconds. However, it can be deployed directly. In other
words, ATP has great power but very limited capacity. In chemical terms, we can
describe it as follows: ATP undergoes hydrolysis in the sarcoplasm, releasing
energy that is used by the muscle filaments (actin and myosin activation).
ATP + H O produces ADP (adenosine diphosphate) + H+ (hydrogen ion) +
Pi (free phosphorous ) + release of energy that can be used directly by the muscle.
Because ATP is the only form of energy that can be used directly by the cells, the
small quantity has to be continuously replenished. This is done by converting the
ADP by-product back into ATP. This requires energy from the various energy sys-
tems, which differ in their speeds of production (their power) and the quantity of
energy they can produce (their capacity).
4.4.1 Replenishment of ATP
To restore ADP to ATP, we have four systems.
1. ATP-CP system: Hydrolysis of phospho-creatine (PCr) in the sarcoplasm produ-
ces the immediate release of energy for converting ADP into ATP.
The quantity of PCr is also limited, but it is the first energy system accessed, it
responds very quickly, and it is sufficient to sustain exertion for about 8 seconds.
This is the energy system responsible for short bursts of energy.
This system is extremely important for soccer and the most important energy
provider for typical high-intensity activities in soccer, such as short and repea-
ted sprints, jumps, tackles, kicks, and so on. The pool of PCr can be increased to a
limited extent through specially adapted training and creatine supplementation.
2. Anaerobic Glycolysis: produces energy in the sarcoplasm to ensure that the
high intensity of an exertion can be sustained for longer than 10 seconds. In this
regard, glycogen from the muscles is converted to pyruvate and lactate via a
number of chemical steps in which no oxygen is used, releasing a limited quan-
tity of energy (two or three ATPs depending on whether the source of glucose
is stored glycogen or glucose coming from the bloodstream). At high intensity,
it is mainly the muscle glycogen that is used and, at lower intensity, the blood
glucose coming from the liver glycogen is used.
3. Oxidative Phosphorylation: For the exertion to be carried out longer, the inten-
sity of the exertion falls and Aerobic Glycolysis (Oxidative Phosphorylation)
takes over. The time that elapses before the system is in full working order is
determined by the level of training and genetic potential, and it follows an expo-
nential function with values between 30 seconds and two minutes (which is
the duration that anaerobic activity can be sustained). Aerobic energy produc-
tion takes place in the mitochondria, with the glucose and fatty acid substrates
converted entirely to water and CO
2. The CHO reserves are limited, while fat
[email protected] 06 Aug 2018
FITNESS IN SOCCER
Nutrition
54
reserves are virtually unlimited. Fats become the primary fuel source during
low-intensity physical exertion where adequate oxygen is available for the oxi-
dation of lipids. This is in contrast to the high-intensity anaerobic exertions,
which are fuelled by CHOs. However, it is important to note that the use of fat as
a fuel is most efficient when there is at least a baseline amount of CHO present.
It is often said that fat burns best in the flame of CHO. Without adequate CHO,
there is an incomplete combustion of fat that produces ketones as a by-product.
While ketones can be used as a fuel source, they are not an efficient source of
fuel, especially for the brain. Ketones are also known as keto acids, and as such,
are a source of metabolic acidosis. CHO is therefore extremely important as a
fuel source in soccer.
4. The Kinase Reaction can produce a limited amount of energy through the com-
bination of two ADPs (i.e., ADP+ADP produces ATP+AMP). This reaction is
important for high-intensity exertions. Excessively high intensity at the begin-
ning of a physical exertion can cause a very high quantity of AMP to be conver-
ted to IMP and further transformed into urea (typical smell of sweat in these
cases), which causes an insufficient store of ADP and a need to discontinue the
exertion.
[email protected] 06 Aug 2018
FITNESS IN SOCCER
Nutrition
55
4.5 ENERGY SYSTEMS
These energy systems differ from each other in terms of:
• The use of substrate: Anaerobic energy consumes 18 times more substrate
(although the end product, lactate, can be later reused by the cardiac muscle,
for example, or converted to glycogen in the liver via the Cori cycle).
• Speed of action (power): the ATP-CP system is faster than anaerobic glycoly-
sis, which in turn is quicker than aerobic phosphorylation.
• The quantity of energy they can produce (capacity):
aerobic > anaerobic > PCr > ATP.
• Their power development expressed in watts: The maximum anaerobic
power is 4–5 times greater than the maximum aerobic power. ATP/PCr gene-
rates a maximum of 5,000 watts, while anaerobic generates 2,000–4,000 watts.
Aerobic generates less than 2,000 watts.
There is also a noticeable difference in energy supply according to the muscle type.
Type I: slow muscle cells, characterized by their fine structure and red color (due
to large amounts of myoglobins), mainly display aerobic energy produc-
tion with little formation of lactate.
They are economical with regard to substrate consumption because of
the total oxidation of the energy sources (i.e., CHO, protein and fat).
Type II: muscle cells, or white muscle cells, are subdivided into:
Type IIa:
These have a mixed aerobic and anaerobic effect and are characteristic of
soccer players (with a part of type IIb probably being transformed into
type IIa).
Type IIb: These are the strongest, but they have a mainly anaerobic metabolism
with very high glycogen consumption.
Conclusion: Given that physical exertion in soccer is partly anaerobic (during
the brief high-intensity exertions) and primarily aerobic (repleting ATP levels
during the longer periods of recuperation), it is clear that the main energy source
for soccer activity is CHO from glycogen stored in the liver and muscles, as well as
blood glucose from food and beverages consumed before and during play .
ATP-CP system
Anaerobic process
Aerobic process
Intensity
95
–100%
60
–95%
< 60 %
Duration
< 10 sec
30 sec to 30 min
Long duration
Fuel
Creatine phosphate
CHOs
(from blood glucose and
stored glycogen )
CHOs, fats, proteins
Residual
product
None
Lactic acid
Water and carbon
dioxide
Recovery
Immediate
20
–60 min
Until the fuel reserves
have been replenished
Table 4.2: Overview of the different energy systems.
[email protected] 06 Aug 2018
FITNESS IN SOCCER
Nutrition
56
4.6 MACRONUTRIENT NEEDS
Due to the limited supply of both sources of CHO (i.e., 350g of muscle glycogen,
120g of liver glycogen, and 5g of blood glucose), constant replenishment via food
and drink is an absolute necessity. Macronutrient needs are sometimes expressed
as percentages of the total kcal needed, which is calculated based on body weight,
age, gender and everyday activities. With this system, 70% of an athlete’s energy
is provided by CHOs, 20% by fat, and the remaining 10% by protein. However,
most sports nutritionists now provide macronutrient recommendations in terms of
grams per kilogram of body weight (g/kg BW), and this is a more precise way of
targeting the needs of individual athletes. With this method, the CHO recommen-
dation for soccer players is 5–7g CHO/kg BW for moderate daily recovery and
match preparation. During times of enhanced daily recovery and match prepara-
tion (e.g., heavy training loads, frequent matches and/or injury recovery) 7–12g
CHO/kg BW is recommended. If the diet does not contain enough CHOs, athletic
performance and muscle recovery will be compromised. The majority of these are
complex CHOs—present in bread, rice, vegetables, and so on—with a small por-
tion of simple sugars that are often added to the food.
The recommended protein intake for the training diet of elite soccer players is
1.4–1.7g/kg BW. While slightly higher protein consumption may be helpful for ath-
letes recovering from injuries or surgery, research suggests there is no advantage to
protein intakes greater than 2g/kg BW in daily training diets. In fact, protein regu-
larly consumed at these levels may have detrimental effects, such as increased risk
of dehydration, kidney stones, calcium loss, GI distress, gout, and liver or kidney
damage. Among other concerns, there is an increased risk of dehydration when
high amounts of protein are consumed due to the obligatory water losses associa-
ted with the excretion of urea, which is a by-product of protein oxidation.
Fat appears to be the
macronutrient
that
requires the least preci-
sion in terms of balan-
cing the diet. Generally
speaking, once CHO
and protein needs have
been calculated, the
remaining kcals can
usually come from the
healthier varieties of
dietary fats. The accep-
table amount of dietary fat for most athletes is between 10% and 30% of total energy
intake. Healthy varieties of fats include monounsaturated fats—such as those
found in nuts, olives and avocados—and omega-3 fatty acids, which are found in
fish oil and flax seed oil. It is best to limit saturated fats (found in cheese and other
dairy products and in meats) and trans fats (found in processed foods containing
hydrogenated oils). Excess amounts (more than 10% of dietary energy) of these lat-
ter two types of fats can increase the risk of heart disease and contribute to inflam-
mation. Omega-3 fats, on the other hand, may actually help decrease inflammation.
[email protected] 06 Aug 2018
FITNESS IN SOCCER
Nutrition
57
4.7
EATING PATTERNS OF SOCCER PLAYERS
Little research has been conducted regarding the dietary habits of soccer players.
Glycogen reserves may decrease quickly during a match through the alternation
between low- and high-intensity moments. A thirty-second sprint at full speed can
reduce the glycogen concentration in the muscles by 30%. Top players work for
two-thirds of a match at 85% of their HR
max. Research has shown that soccer players
expend up to 90% of their glycogen reserves during a match. Exhausting glyco-
gen reserves leads to fatigue, guaranteeing fewer sprints in the second half. Eating
an easily digested CHO before the match and drinking a sports drink (containing
4–6% CHO) during the half-time break increases the distance that can be covered
at high speed in the second half. It is therefore not sufficient to consume a sports
drink just before the match. The body needs to be trained to ingest sufficient CHOs
before and after a match.
At least 9–10g of CHOs per kg of body weight need to be ingested over the few
days before a match and during periods of intense training.
4.7.1 Food intake and beverage consumption before and after a match
4.7.1.1
Prior to commencement of the match
Nutrition is, of course, an important factor in the days leading up to a match. The
day before the match, it is necessary to start replenishing the glycogen reserves in
the muscles (i.e., provide a diet rich in CHOs for the few days before a match).
We use sports meals to enhance the body’s CHO reserves, but trying out new foods
before a match is not advisable. The best time to do this is before training. Always
try to eat the same things prior to a match, because this helps to gather experience
with regard to quantities. A full meal should be eaten at least three hours before
the match starts. Eating within three hours of kick-off time can cause stomach pro-
blems during the game. A relatively empty stomach also helps ensure that the mus-
cles have a sufficient supply of blood and oxygen. High-fat foods are not advisable
because these slow down the digestion process in the stomach.
The meal should be rich in complex CHOs—such as potatoes, rice, grain, fruits,
and vegetables—while the quantity is determined individually and also influenced
by the previous meal. Proteins can also be ingested provided they are not from a
high-fat source.
Examples of pre-match food:
• cornflakes with low-fat milk
• pasta (possibly with a low-fat sauce)
• baked potatoes
• fruit (e.g., raisins, bananas, oranges)
• bread rolls
• rice
On average, around 5g of CHOs per kg of body weight should be ingested
(e.g., 375g for a player weighing 75 kg). Additional CHOs should be eaten around
two hours prior to the match in the form of bread or bananas.
Try to eat or drink another 50g of CHOs 20 minutes before the match starts.
[email protected] 06 Aug 2018
FITNESS IN SOCCER
Nutrition
58
Examples of foods that contain around 50g of CHOs include:
• two bananas
• two slices of bread and jam
• 75g of breakfast cereal
• biscuits
4.7.1.2
DURING THE HALF-TIME BREAK
The glycogen reserves need to be replenished during the half-time break. This can
be achieved by eating two bananas or drinking a high-CHO beverage. Care must
be taken to consume sufficient fluids along with any CHOs in order to prevent an
overly high solute load in the gut. If too concentrated, this will slow gastric empty-
ing and cause “sloshing.”
4.7.1.3
After the match
After the match, the glycogen reserves need to be replenished as quickly as possi-
ble. Muscle glycogen is produced considerably faster after physical exertion. Also
try to consume around 1g of CHO per kg/BW within two hours of the physical
exertion, and do not go to sleep on an empty stomach.
4.8 GLYCOGEN METABOLISM AND NUTRIENT TIMING FOR RECOVERY
In this chapter we have discussed the decisively important role of glycogen as a
fuel for soccer players. Given the limited reserves in the body, it is important to
know how the level of glycogen stored in the muscles and liver can be maintained
or even increased. In other words, we have to understand how the synthesis of gly-
cogen works and what influences this.
Glycogen synthesis (glycogenesis) is regulated via the enzyme glycogenin.
Post-exercise glycogen repletion proceeds in two phases.
1. The rapid Phase 1 is not dependent on insulin and takes about an hour. The for-
mation of glycogen is controlled by the glycogen synthase enzyme, the activity
of which is inversely proportional to the initial glycogen store (i.e., the lower the
glycogen reserves, the more active the enzyme becomes). The enzyme binds the
first glucose molecules together. There is also an increased permeability of the
cell membrane for glucose.
2. Phase 2 is insulin-dependent and ten times slower than phase 1 in the absence
of CHOs. If CHOs are ingested directly after exercise, the synthesis of glycogen
increases, and levels can even become higher than normal. This additional gly-
cogen storage is known as glycogen supercompensation (often referred to as
CHO loading).
This phase of glycogen synthesis is also dependent on the type of exercise per-
formed. A quick review of exercise endocrinology will help explain why. During
moderate-to-high-intensity exercise, catecholamines (epinephrine, norepinephrine,
glucagon, human growth hormone) are released in response to the physiological
stress. These hormones help make fuel available for the active muscles by encoura-
ging glycolysis and gluconeogenesis and by mobilizing fatty acids out of storage.
[email protected] 06 Aug 2018
FITNESS IN SOCCER
Nutrition
59
Insulin is a storage hormone that acts to get substrates (glucose and fatty acids) into
cells for storage, so the release of catecholamines at the onset of exercise initiates a
feedback loop that inhibits insulin secretion.
During moderate-to-high-intensity exertion, the body activates an insulin-inde-
pendent mechanism to transport glucose into the cells via GLUT4 receptors. There
is an increased concentration of GLUT4 glucose transporters, which carry glucose
from the cell membranes into the cells. The muscle’s cells also become more sensi-
tive to insulin during moderate to intense exercise. During post-exercise recovery,
the insulin sensitivity and GLUT4 receptors remain elevated and active for about
60 minutes. At the cessation of exercise, catecholamine levels decrease, allowing
for a restoration of insulin secretion. This can rebound with an insulin response
to CHO that is up to ten times greater than normal. Because insulin is a storage
hormone, heightened insulin sensitivity combined with abundant insulin secretion
allows for an increased capacity to transport glucose and protein into muscle cells
for enhanced glycogen storage and muscle recovery.
Additionally, high-intensity exercise leads to an increase in proteins that convey
lactate outside the cell and aid in the recovery of the cell. Experts emphasize the
importance of refueling within 60 minutes after exercise, because this will take
advantage of the temporarily enhanced ability to transport and store CHO and pro-
tein. The immediate administration of CHO at the cessation of exertion (training or
match) is therefore decisive for glycogen supercompensation.
The question remains as to what CHOs to eat and in what quantity.
Several studies have shown that, up to a certain limit, there is a parallel between the
quantity of CHOs absorbed and the quantity of stored glycogen.
A range of 1.2 to 1.67g of CHOs per kg/BW would appear to be ideal.
Type of CHO: Preferably eat a mixture of simple and complex CHOs with a small
amount of fructose (see below).
Timing: Eat immediately after physical exertion (within 30–60 minutes) and every
15–30 minutes for the next 2–5 hours post-exercise.
Research has also shown that this regime can be continued for a few hours, provi-
ding 1.0–1.5g of CHOs per kg/hour. This can perhaps be provided in several small
snacks and/or beverages every 15–30 minutes.
Providing a small amount of protein post-exercise may enhance muscle recovery.
Although athletes are often inclined to consume large quantities of protein at this
time, research suggests that athletes only need 0.1–0.2g of protein per kg/hour for
recovery from both endurance- and resistance-type exercises. For a 70kg person,
this would be only 7–14g of protein. In practice, this can be easily provided by
consuming 250–500ml (8 –16 fl. Oz.) of low-fat chocolate milk. Chocolate milk is
often touted as the “ideal recovery drink” because it provides the recommended
amounts of CHO and protein, as well as fluid and electrolyte replacement (i.e.,
sodium, potassium and calcium).
[email protected] 06 Aug 2018
FITNESS IN SOCCER
Nutrition
60
Food
Grams (g)
Serving size
CHO (g)
Bread
130
50
Pasta (cooked)
200
50
Museli
75
50
Rice (brown or white)
130
50
pretzels
Tortilla (Corn or flour)
15 cm across,
(6”)
15
Naan Indian Bread
60
Oats, oatmeal, cooked
1 cup
30
Corn
1 cup
30
Quinoa, cooked
1 Cup
45
Potato
250
Sweet potato or Yam
Beans, peas or lentils
½ Cup, cooked
15
Apple, orange
Small (tennis ball size)
15
Mango
1 small ( 1 Cup)
30
Berries
1 Cup
Melon
1/8 th or 1 Cup cubed
watermelon
1.25 Cup
15
Unsweetened juice
4 oz
Jelly or Jam
4 tsp
Milk
8 oz
Kiwi
1
15
Dates
3
15
Pineapple
½ Cup
15
Papaya
1 cup cubed
15
Raisins
2 Tbsp
15
Sorbet
½ Cup
30
Honey
1 Tbls
15
Sugar
1 Tbls
15
Frozen fruit juice bars,
100% juice
1 bar
15
Fruit juice
500 ml
8 oz
30
Table 4.3: CHO content of food.
[email protected] 06 Aug 2018
FITNESS IN SOCCER
Nutrition
61
Fructose is metabolized differently than the other sugars. Most sugars are absorbed
from the intestine into general circulation, where they are then taken up by cells
and metabolized. Fructose, in contrast, is transported from the intestine directly
to the liver, the only place where fructose metabolism occurs. In the liver, fructose
is converted to glycogen, and once the glycogen stores are full, it is converted to
triglycerides (fat). Because of this, fructose does not have a direct effect on blood
sugar and therefore does not elicit an insulin response. Both of these factors cause
two times more glycogen to be stored via glucose.
As already mentioned, fructose is metabolized primarily in the liver, while glucose
is metabolized in the muscles. Because fructose has no direct effect on blood sugar,
it is not an immediately available source of energy for the brain or muscles. Additi-
onally, some athletes have an intolerance to fructose. These individuals often expe-
rience the symptoms of cramps, and fermentation can occur quickly in the area of
the intestine. Fructose is therefore only useful in limited quantities because of its
role in the storage of glycogen in the liver and its pronounced sweet taste.
It does not appear to make a difference whether CHOs are ingested in solid or
liquid form. The type of exertion, however, does have an influence on the formation
of glycogen, because there is a clear difference between prolonged aerobic exertion
(longer than an hour) and short, high-intensity exertions.
In the first case, the synthesis is dependent on the availability of CHOs, while in the
second case, the synthesis runs parallel to the fall in lactate level. (Lactate is used
as a source for glycogen.)
Eccentric exercises (such as in soccer) appear to have a negative influence on gly-
cogen accumulation, possibly due to a decrease in GLUT4 proteins, although this
may be a direct effect of a high demand for glycogen and inadequate CHO in the
training diet. This can be countered by ingesting adequate amounts of CHO and
protein after the training session or match.
4.9 ENERGY BALANCE AND BODY COMPOSITION
4.9.1 Body composition
The body is made up of 73.8% water, 19.4% proteins, and 6.8% minerals. The ideal
body composition varies from sport to sport. The body is divided into two com-
ponents: fat-free mass and fat mass. Correct training can increase the fat-free mass
and reduce the fat mass. The body mass index is a test used to give an indication of
body fat. However, it is a poor indicator of health in athletes because it is merely a
ratio of height to weight. Athletes typically have more muscle mass, which is den-
ser than fat. Athletes with a lot of muscle mass score high on this index, giving an
incorrect impression of body composition.
Example: Weight: 75 kg, height: 1.75 - BMI = 75 /(1.75 x 1.75) = 24.5 kg/m2
BMI is calculated as follows:
BMI (kg/m2) = body weight in kilograms divided by height in meters squared
[email protected] 06 Aug 2018
FITNESS IN SOCCER
Nutrition
62
FAT %
Min.
Max.
Stdev.
Avg
Elite U21
5.00
16.00
2.04
8.45
Elite First team
6.29
14.13
1.68
9.51
Table 4.4: Reference data based on tests at different top clubs (TopSportsLab).
Ectomorph
Mesomorph
Endomorph
Fig. 4.3: Examples of different somatotypes. The somatotype is expressed in three digits. Most
people have a somatotype somewhere in the middle.
Fig. 4.4: Somatotypes in different sports. Over the last decade, soccer players have evolved from
being more ectomorphic to mesomorphic.
[email protected] 06 Aug 2018
FITNESS IN SOCCER
Nutrition
63
Height and weight vary considerably in soccer. A small build is not a disadvantage,
but it can determine the choice of position on the field. In soccer, there are con-
siderable variations between the different positions, with defenders, strikers and
goalkeepers being taller than players of other positions.
A way of describing body composition is the somatotype. This is expressed in three
dimensions:
• endomorphy: indicates the tendency to put on weight
• mesomorphy: indicates the tendency towards muscularity
• ectomorphy: indicates the tendency towards linearity
These values are measured based on the circumference of the person’s limbs, leg
diameter and skinfold measurements. There are also other methods of measuring
the somatotype by estimation. Soccer players tend toward 2-5-2, meaning that they
are more muscular. Each dimension ranges from one to seven (Table 4.5).
Rugby (7 >< 7)
Gaelic football
Soccer
Endomorphy
2.3
2.7
2.0
Mesomorphy
5.9
5.7
5.3
Ectomorphy
1.5
1.9
2.1
Table 4.5: Somatotype of top players in various forms of football
The average fat percentage for men around 25 years of age is around 16%. In the
literature, the value for soccer players is 9–13%, while it is somewhat lower for indi-
vidual athletes (e.g., track-and-field athletes). The values measured for top athletes
are between 3% and 7%. Soccer players average out at around 9-10% fat.
4.9.2 Energy balance
For most elite soccer players, balancing energy for the purpose of weight manage-
ment is not a primary focus (exercise to eat). During active training seasons, the
greatest challenge is supplying enough kcal and CHO to meet the substantial
energy demands that result from training and match play (eat to exercise). Ath-
letes who attempt to create an energy deficit in an effort to lose body fat often end
up compromising their performance and/or increasing their risk of injury. Ideally,
any reductions in body weight should be done during the player’s off-season. It is
impossible to lose weight while simultaneously fueling for optimal performance.
Likewise, it is unwise for an athlete to follow a low-CHO diet in an attempt to
lose weight. This would interfere with the energy available for training and match
play, resulting in reduced performance and increased risk of injury. Also, much of
the weight loss associated with low-CHO diets is due to depleted glycogen stores,
particularly the loss of the water stored with them. This can easily result in a loss
of 5kg, but it will also remove a valuable source of stored fuel for sport while doing
little, if anything, to decrease body fat.
It is better to focus on body composition rather than body weight, especially since
the addition of muscle and/or glycogen can significantly increase weight, because
it is ultimately advantageous if the ability to produce power is increased. Stu-
dies suggest that elite male soccer players have around 8–13% body fat, while top
[email protected] 06 Aug 2018
FITNESS IN SOCCER
Nutrition
64
female players have approximately 16% body fat. The fat percentage is commonly
measured with a skinfold caliper, which estimates the fat percentage on the basis of
skinfold thickness. Care has to be taken with skinfold measurements where age is
not taken into account, because older players tend to have somewhat thicker skin
and are therefore likely to be overestimated. Other methods of estimating body
composition include dual-energy X-ray absorptiometry, hydrostatic weighing, and
bioelectrical impedance.
4.10 VITAMINS, MINERALS AND FREE RADICALS
Vitamins, minerals and phytochemicals are micronutrients. They are only needed in
small quantities, but they are vital in supporting health and growth. Micronutrients
are involved in many metabolic processes. Six of the B vitamins (thiamine, ribof-
lavin, niacin, pyridoxine, pantothenic acid, and biotin) are necessary for the meta-
bolic reactions that produce energy during exercise. Two others, vitamin B12 and
folate, are essential to red blood cell formation, protein synthesis, and the growth
and repair of tissues. Deficiencies of B12 and/or folate result in macrocytic anemia,
which compromises health and performance by limiting the amount of oxygen a
given volume of blood can deliver to working muscles, the brain, and other vital
organs.
4.10.1 Antioxidants
Vitamins C, E, and A (beta carotene), selenium and several phytochemicals serve
as antioxidants, which help to prevent oxidative damage to cells caused by free
radicals. Free radicals, often referred to as “chemical terrorists,” are molecules or
atoms that contain an unpaired electron. They are highly reactive and can initiate
chain-like reactions that can damage cell membranes and DNA, causing cells to
malfunction or die. Antioxidants neutralize free radicals, thus helping to prevent
or reduce the oxidative damage to body cells. Soccer players, like many other ath-
letes, are at increased risk of oxidative damage to cells because the increased oxy-
gen exchange associated with aerobic physical activities increases the exposure of
cells to oxygen by 10–20 times. It is now believed that athletes adapt to regular
training by developing an enhanced antioxidant defense system, so they are better
protected against free radical damage than the occasional exerciser would be. Still,
there may still be some advantage to providing dietary antioxidants to enhance
protection from free radicals. All of the aforementioned antioxidants can be found
in a diet that contains a variety of fruits and vegetables. No supplementation is
necessary with such a diet.
4.10.2 Vitamin D
Vitamin D is a micronutrient that has received increasing interest of late. The
well-established functions of vitamin D include calcium regulation, bone health,
and development and homeostasis of the skeletal muscle and nervous system.
Emerging research suggests that vitamin D may also be significantly involved in
other vital processes, such as signaling gene response, protein synthesis, hormone
synthesis, immune response, and cell turnover and regeneration. A vitamin D
receptor has been discovered within muscle, suggesting that vitamin D may have a
significant role in muscle tissue function. This has raised the question of whether a
[email protected] 06 Aug 2018
FITNESS IN SOCCER
Nutrition
65
vitamin D deficiency would affect athletic performance and injury. Recent studies
suggest that a vitamin D deficiency does indeed compromise athletic performance.
It is estimated that as much as 77% of the general population of the United States
may be deficient in vitamin D (serum vitamin D < 20 ng/ml), suggesting that ath-
letes may have similar levels. A review of studies of various populations of athletes
across the globe suggests a relatively high incidence of vitamin D deficiency (<20
ng/ml) and insufficiency (<32 ng/ml) in athletes worldwide. Furthermore, it has
been suggested that in athletes with vitamin D insufficiency, supplementation with
D3 may improve muscle strength. However, improvement in muscle performance
(e.g., sprint times and vertical jumps) did not occur when serum levels were nor-
malized, but improvements were noted when serum vitamin D levels rose above
40 ng/ml. Thus, it has been recommended for athletes, such as soccer players, to
monitor their vitamin D levels regularly and strive to maintain serum 25(OH)D
levels > 40 ng/ml. To achieve this, a protocol for oral supplementation with 5000
IU of vitamin D3 per day is recommended.
4.10.3 Minerals
In addition to selenium, whose role as an antioxidant has already been discussed,
there are several minerals that are important for soccer players to include in their
diets. Calcium is important for the growth, maintenance and repair of bones. It is
also essential for muscle contractions, nerve conduction, and normal blood clot-
ting. Zinc is involved in building and repairing muscle tissue, maintaining immune
health, and the energy metabolism. Iron is an important component of the oxy-
gen-carrying hemoglobin portion of red blood cells. When iron is deficient, the abi-
lity to carry oxygen to the cells diminishes and fatigue sets in. It therefore follows
that a deficiency in sodium will also cause a drop in performance. Possible causes
of iron deficiency include inadequate dietary intake of iron and inadequate total
energy intake. Recovering from an iron deficiency can take three to six months.
Sodium, potassium and chloride are the three major electrolytes. Electrolytes
become ions in solution and have the ability to conduct electricity. In the body, they
are important for the conduction of electrical nerve impulses and neuromuscular
impulses. These three electrolytes are also important for maintaining fluid balance
in and around the cells. While all of these are lost in sweat to some extent, sodium
is lost in the greatest concentrations and therefore is the most important to replace
during exercise. The amount of potassium typically lost during 90 minutes of play
or practice is relatively small and can be replaced during recovery. While there has
been recent debate in scientific research as to whether or not sodium depletion
results in muscle cramping, the personal experiences of many athletes and coaches
convinces them that it does, at least for some athletes.
Minerals are also best obtained through the diet. These are inorganic substances
that have regulatory and structural functions in the body.
Both vitamins and minerals are present in food to an adequate extent. Try to eat as
varied a diet as possible to obtain all the different types of minerals and vitamins
on a daily basis.
[email protected] 06 Aug 2018
FITNESS IN SOCCER
Nutrition
66
4.11 WATER AND ELECTROLYTE BALANCE IN SOCCER PLAYERS
In addition to glycogen depletion, dehydration can be a significant source of fati-
gue for athletes. In energy production, the largest portion of the chemical energy
released is converted into heat. This heat has to be emitted through physical trans-
fer, although the most significant part is discharged through perspiration.
Although a higher ambient temperature is a hindrance because of the reduced
physical transfer possibilities, the bigger concern is an excessively high level of
humidity, because this makes sweating much more difficult.
A soccer player’s fluid loss can be described as follows:
• Sweat production, which is a consequence of energy production, is deter-
mined by the intensity of the physical exertion.
• Water loss through breathing is normally 200 ml per day, but it can be more in
cases of dry air and high altitudes.
• Urine production is typically 800–900ml per day.
The most important contributor to fluid loss is perspiration, which is an essen-
tial mechanism for thermoregulation. The evaporation of sweat cools the skin, hel-
ping to keep the core temperature within acceptable limits. It has been shown that
relatively small fluid losses (2% of body weight) are sufficient to have a negative
influence on performance. In the event that fluid losses exceed 3%, there is clear
evidence of a fall in VO
2max In addition to water loss, there are electrolyte losses
associated with perspiration. Sodium losses through sweat can vary considerably
between individual athletes. While the concentration of NaCl is generally around
3–4g per liter of sweat, it is considerably higher in some athletes. Furthermore, tole-
rance to external heat and internal heat production is reduced.
Thirst can be a very poor indication of fluid deficiency, so players need to learn to
estimate their losses by, for example, determining their weight losses at the training
facility after several tough workouts. Fat contains less water than muscles (i.e., 10%
in fat compared to 75% in muscle), resulting in substantial differences between the
two. It can generally be said that soccer players do not drink enough fluids, partly
because drink breaks are not provided during the match. After a soccer match or
equivalent training session, players are confronted with two significant negative
phenomena. Firstly, they experience glycogen loss (see above), and secondly, fluid
loss combined with limited salt loss. These can be restored in a combined manner.
Fluid loss can be estimated based on weight loss and then compensated for by
150% (i.e., compensating for 1 liter of fluid loss by drinking 1.5 liters of fluid) to
account for the resumption of diuresis.
Preferably do not drink purified water, as this will lower serum osmolality and
stimulate diuresis, resulting in even greater fluid loss. It is better to drink a 4–6%
CHO solution made from a mixture of glucose and glucose polymer (see sports
drinks) with 0.5–0.7g of sodium per liter. Be careful about consuming alcohol after
a match, because alcohol also stimulates diuresis. It can also only be broken down
in the liver, therefore slowing down other metabolic processes in the liver, such as
the formation of liver glycogen. Gastric emptying can constitute a challenge for
soccer players and athletes in general. This emptying is determined by the volume
and composition of the fluid ingested. The volume is decisive, and the emptying
follows an exponential function, decreasing quickly as the remaining fluid drops.
[email protected] 06 Aug 2018
FITNESS IN SOCCER
Nutrition
67
“Drink large quantities” is the motto here, and this needs to be taught on the trai-
ning ground as some feel it to be bothersome. Gastric emptying also depends on
the glucose content, with concentrated solutions remaining in the stomach for lon-
ger. An increase in osmolality slows down the emptying process, meaning that it
is better to use glucose polymers, which lower the osmolality. Glucose absorption
in the small intestine is an active energy process linked to the transportation of
sodium. Water follows the osmotic gradient in a passive way. The assimilation of
fructose is a passive process that proceeds more slowly and can give rise to osmotic
diarrhea in larger quantities. Research has shown concentrations of CHO above 6%
to slow gastric emptying. It has also been established that a combination of two or
three different CHOs (sugars) are more rapidly absorbed than a single type. It is
believed this is caused by the different monosaccharides being absorbed via diffe-
rent channels, so when there is more than one source of CHO in a sports drink, they
can be absorbed simultaneously.
4.11.1 Sports drink
No sports drink is ideal for everyone and all situations. A compromise has to be
made between proper rehydration and supplying as much energy as possible in the
form of CHOs. Drinks should never be carbonated, however.
The following factors are important in this regard, and these are typically charac-
teristic of sports drinks:
1. The osmolarity (or osmolality) is the number of particles of a substance expres-
ses per liter (osmolarity) or per kilogram (osmolality).
Isotonicity says something about the quantity of particles in a solution, but
not very much about the type of dissolved particles (e.g., sodium, potassium,
CHOs, etc.).
The blood has a tonicity of 290–300 mosmols and contains, in this regard, 0.9g
of NaCl and 5g of glucose per liter. Drinks with the same tonicity are referred to
as isotonic solutions, while those with greater tonicity are described as hyperto-
nic solutions, and those with lower tonicity are referred to as hypotonic soluti-
ons. An isotonic sports drink therefore has an osmolarity comparable to that of
plasma, and it is primarily a thirst quencher, providing water and replenishing
salt and CHO to a limited degree.
The tonicity of a solution plays a role in the emptying of the stomach, the
absorption via the intestine, the quantity of kcal in the form of CHOs, the supply
of water, and the supply of electrolytes, primarily sodium and potassium. The
size of the dissolved particles (i.e., the type of CHO) and the quantity of sodium,
as well as the quantity of CHOs, determine the tonicity.
2. Type of CHO present
Only monosaccharides can be absorbed directly through the intestines, while
other CHOs have to be first broken down by an enzymatic process. In the event
of an immediate need for CHOs, glucose is the best solution, but if it is being
administered for the purpose of glycogen recovery, slow CHOs (i.e., normal
food) are better.
[email protected] 06 Aug 2018
FITNESS IN SOCCER
Nutrition
68
4.11.2 Use of sports drink
The characteristics of a sports drink will determine the best moment to use it:
a. Before and during physical exertion: a solution of fast CHOs, such as dextrose,
sucrose or maltodextrin. Maltodextrin, or dextromaltose, is a sugar obtained
through partial hydrolysis of starch containing a particular quantity of free
glucose. It is given a dextrose equivalent to indicate the quantity of free glucose.
For example, pure starch has an equivalent of 0, while it is 100 for glucose and
lower than 20 for dextromaltose. Its advantage lies in its lower osmolarity,
because it is a larger molecule than other sugars.
The terms “slow and fast CHOs” are relative, because other factors also play a
part. For example, chocolate contains “fast” CHOs, but slower gastric emptying
occurs because of the presence of fat. Much has also been said about rebound
hypoglycemia. This was shown in a study once but not since, and it is very rare
among athletes.
b. Within 15 minutes after the exertion, start rehydrating up to 150% of the quantity of
fluid lost, initially with fast CHOs in an isotonic solution combined with a pro-
tein solution, such as low-fat chocolate milk. Follow this later with slow CHOs
in the form of a normal meal. It is important to repair the structural damage
through a combination of limited amounts of protein and CHO in a ratio of 15
kcal per 1 gram of nitrogen.
c. Depending on the circumstances, take an isotonic solution in the event of severe
dehydration, such as from a tough match or warm environment. A hypertonic
solution (300–500 mosmols) can be used in cold weather, but take care with this,
because high tonicity can quickly lead to stomach and intestinal problems.
d. Depending on the duration of the exertion:
• < 1 hour: 6% solution
• 1–3 hours: 6% solution with 10–20 mg of sodium chloride
• more than 3 hours: 6% solution with 20–30 mg of sodium chloride
The presence of sodium improves the absorption of water and CHOs, prevents
hyponatremia, inhibits urine production, and stimulates the feeling of thirst. In
this case, we also refer to recuperation drinks.
[email protected] 06 Aug 2018
FITNESS IN SOCCER
Nutrition
69
4.12 FOOD SUPPLEMENTS
Food supplements can be dealt with very briefly: They are not necessary. If a player
feels tired, it is better to take a blood test before resorting to food or vitamin sup-
plements. The blood analysis will clearly show where the deficiencies lay, so sup-
plements can then be prescribed in a purposeful and effective manner. A normal,
varied diet is sufficient, although vegetarians should consult the club physician.
4.12.1 Creatine
An adult man weighing 80kg has approximately 130g of creatine reserves, mainly
in the muscles (95%). An average of 2g is lost each day, although this is replenished
through food intake.
Creatine has often been misrepresented in recent years, with claims that it is tan-
tamount to doping and a cause of cramps in soccer players. In many cases, these
accusations are the result of incorrect creatine regimes. It is not the intention here
to either promote creatine or advise against it. It is simply an attempt to put the
ingestion of creatine into the right context. Creatine is available in food, and eating
sufficient quantities of meat, fish and dairy products ensures that a large part of the
creatine needed is ingested. For this reason, the most substantial effects of supple-
ments are measured in vegetarians. The intake of creatine increases the CP reserves
in the muscles. As already demonstrated above, these CP reserves are important for
providing energy during short bouts of physical exertion lasting just a few seconds.
The ingestion of creatine speeds up the recovery of CP reserves. In addition, maxi-
mum muscle strength is increased through the hormonal effect, with muscle relaxa-
tion also being improved. The long-term effects are not yet known. Although no
negative effects have so far been established in the short term, creatine does result
in an increase in weight due to the buildup of fluid in the muscles. Seen in practical
terms, creatine is a fairly expensive supplement. Nonetheless, the doses prescribed
are often excessive.
How should it be used?
1. Quick charge for five days with 20–25g (for players weighing 65–82kg), taken
over three daily doses at 8am, 3pm and 9pm together with 25g of sugar (e.g.,
Glucopur or dextro-maltose) dissolved in water.
65 kg:
7g three times with 25g of sugar
80–85 kg: 8g three times with 25g of sugar
2. After five days
65 kg:
1g with 5g of sugar
80–85 kg: 1.2g of creatine with 5g of sugar
Weight can increase by 1–2kg. Although other side effects, especially regarding the
kidneys, are as yet unknown, it is wise to stop administering for 14 days after 6
weeks. In the event of cramps, it might be possible to take magnesium in consul-
tation with the club physician. Some players do not respond to creatine supple-
ments. Because creatine can cause an increase in weight, performance may drop.
Taking food supplements must therefore be done only in consultation with a sports
physician.
[email protected] 06 Aug 2018
FITNESS IN SOCCER
Nutrition
70
4.12.2 Iron
One of the effects of endurance training is an increase in plasma volume, which
causes the blood volume to rise from 5 liters to 5.8 liters, for example. This results
in a dilution effect because of the production of red blood cells not keeping up with
the increase in plasma volume. The hematocrit can therefore decrease from the nor-
mal 42 to 39. This is referred to as pseudo-anemia, which, as the name suggests, is
not really anemia but rather an advantage because of the work decreasing through
the lower viscosity. The diagnosis is made by the laboratory in this case, with the
ferritin normal.
Real sports anemia is caused by disturbances in the metabolism of iron, caused
by sports participation. A slight iron deficiency can already have significant reper-
cussions for a player’s fitness. The daily iron requirement is 1mg for a man to
replace losses through urination, defecation, and sweating, while 2mg are required
for women because of menstruation. Intensive sports can disrupt Fe metabolism
through malfunctioning absorption, increased loss, hemolysis and a poor diet.
In addition to factors specific to athletes, there are also other non-sporting-specific
causes, such as giving blood, and these may not be compensated for by an athlete
because of the mucosal block (see below), severe menstruation, or frequently occur-
ring periods with small daily losses.
The factors relating to athletes are:
• Dietary mistakes: Following a weight-loss diet in which only 10–15mg are
ingested instead of the required 18mg per day. Western food typically con-
tains 5–6 mg per 1,000 kcal.
• Red meat contains easily absorbable heme iron, but too little is eaten.
• Frequent milk drinks convert bivalent into trivalent iron, which is useless.
• Increased hemolysis, especially when running and through repeated muscle
contractions with damage to the red blood cells.
• A number of physicochemical factors also lead to hemolysis, such as dehydra-
tion, acidosis, increased osmolarity, rises in temperature, higher catecholamine
level, and peroxidation of the red blood cells through free radicals.
Athletes have absorption disturbances in the area of the intestine: Endurance ath-
letes absorb less iron because of apoferritin deficiency. They also have accelerated
intestinal transit, meaning there is less time to absorb iron, and they exhibit what is
known as a mucosal block (i.e., the absorption of iron is limited to 5–7 mg per day).
Finally, athletes also have less acid in their stomachs, with the result that there is
less bivalent iron.
All these factors mean that athletes are more prone to iron deficiency. They need
more iron than non-athletes because:
• They lose more iron through their sport.
• It is more difficult for them to absorb iron because of their sport.
• In particular, a relative iron deficiency is immediately significant for an athlete
because of the rapid negative consequences for performance. There is a close
connection between iron and hemoglobin and VO
2max.
A fall in the iron concentration leads to a decrease in VO
2max, which means a drop in
the O
2 supply to the muscles and a decline in the oxidative processes. This results in
[email protected] 06 Aug 2018
FITNESS IN SOCCER
Nutrition
71
inefficient use of substrate, faster lactate formation and reduced oxidative phosp-
horylation. The athlete’s general capacity to perform therefore declines.
A low iron level can be the cause of poor performance, so it is therefore useful to
determine the ferritin level three times per year.
4.13 RECOMMENDATIONS
We can give a number of recommendations regarding food choices:
1. Alcohol is a non-nutritional food product. It can only be broken down in the
liver at an average rate of 150 mg per kg per hour, inhibiting the formation of
glycogen and slowing down lactate elimination. It also has a diuretic effect and
disrupts the fluid balance.
2. A diet must be varied and balanced with large proportions of fruits and vege-
tables, whole grains, and low-fat dairy products. The calorific value of food is
usually underestimated, while the calorific cost of sport is overestimated. Kilo-
calories intake should therefore be calculated. Fat contains a huge amount of
kilocalories.
3. Energy intake must be balanced against energy consumption.
4. Choose foods that give the appropriate energy balance while meeting the high
energy needs of soccer.
5. Limit saturated fat (i.e., fat that is solid at room temperature) to 10% of the kcal
ingested per day. This particularly applies to animal fats in food products like
cheese, full-fat milk, butter, ice cream, salami, mincemeat, and so on. Note that
eating whole eggs does not appear to negatively affect serum cholesterol levels,
and egg yolks are an excellent source of vitamin D.
6. CHOs are best obtained from fruits, vegetables and whole grains, with whole
products being preferable to juices. During peak training season, however,
when CHO and energy needs are very high, sometimes drinking CHOs in the
form of juice or blended fruit smoothies can be a good strategy for meeting
dietary intake goals. CHOs are absolutely essential given the limited glycogen
reserves in the body and the dependence of the red blood cells, brain, and mus-
cles on them. Candy is a poor source, as are added sugars.
7. For most elite athletes there is no need to limit dietary salt because so much is
lost through perspiration.
[email protected] 06 Aug 2018
FITNESS IN SOCCER
72
Nutrition
SUMMARY
This chapter has conveyed to the reader the importance of nutrition in soccer.
Good nutrition cannot replace talent, skill, or physical ability, but good nutrition
enables a player to train to his maximum and to perform to the best of his ability
on match day. A poorly fuelled player cannot express his technical and physical
abilities on match day and is also more susceptible to injury. Adequate CHO
intake is essential in order for a player to recovery quickly for the next game.
Protein intake is also essential for repairing damaged muscle fibers. An adequate
intake of vitamins and minerals is needed to support recovery and the immune
system. As we discussed in the previous chapter, the physical demands of the
modern game are high, so it is important that the modern soccer player optimi-
zes his nutritional strategies in order to cope with these demands. Good nutriti-
onal practices are also essential for the soccer player to cope with the demands
of intensive weekly training, so that physical abilities can be improved. These
physical abilities, and the importance of high-intensity interval training, are
now discussed in the following three chapters.
REFERENCES
•
Atkinson, F.S., Foster-Powell, K., and Brand-Miller, J.C., 2008. Diabetes Care, 31 (12), pp. 2281-2283.
•
Burke, L., Loucks, A. and Broad, N., 2006. Energy and carbohydrate for training and recovery. J of Sports Sciences, 24(7), pp.675-685.
•
Dunford M. ed., 2006. Sports Nutrition: A Practice Manual for Professionals 4th edition. American Dietetics Assoc.
•
Duren, D.L., Sherwood, R.J., Czerwinski, S.A., Lee, M., Choh, A.C., Siervogel, R.M. and Chumlea, W.C., 2008. Body Composition Methods:
Comparisons and Interpretation. J Diabetes Sci Technol, 2(6), pp.1139–1146.
•
Frankenfield, D., Roth-Yousey, L. and Compher, C., 2005. Comparison of predictive equations for resting metabolic rate in healthy nono-
bese and obese adults: a systematic review. J Am Diet Assoc, 105(5), pp,775-89.
•
Higgins, J.A., Higbee, D.R., Donahoo, W.T., Brown, I.L., Bell, I.L. and Bessesen, D.H., 2004. Resistant starch consumption promotes lipid
oxidation. Nutrition & Metabolism, 1(8).
•
Hossein-nezhad, A. and Holick, M.F., 2013. Vitamin D for Health: A Global Perspective. Mayo Clin Proc, 88(7), pp.720-55.
•
Jenkins, M.A.,1995. Antioxidants and Free Radicals. SportsMed Web. http://www.rice.edu/~jenky/sports/antiox.html
•
Jette, M., Sidney, K. and Blumchent, G., 1990. Metabolic Equivalents (METS) in Exercise Testing, Exercise Prescription, and Evaluation of
Functional Capacity. Clin. Cardiol., 13, pp.555–565.
•
Massey, L. K., 2003. Dietary animal and plant protein and human bone health: A whole foods approach, Journal of Nutrition 133:
862S–865S. 30
•
McArdle, W., Katch, F.L. and Katch, V.L., 2012. Sports and Exercise Nutrition. 4th edition. Baltimore, MD: Williams and Wilkins.
•
Ogan, D. and Pritchett, K., 2013. Vitamin D and the Athlete: Risks, Recommendations, and Benefits. Nutrients, 5(6), pp.1856-1868.
•
Position of the American Dietetic Association, Dietitians of Canada, and the American College of Sports, 2009. Medicine: Nutrition and
Athletic Performance. J Am Diet Assoc,109, pp.509-527.
•
Schwellnus, M.P., Drew, N. and Collins, M., 2011. Increased running speed and previous cramps rather than dehydration or serum sodium
changes predict exercise-associated muscle cramping: a prospective cohort study in 210 Ironman triathletes. Br J Sports Med, 45(8),
pp.650-6.
•
Sjödin, A.M., Forslund, A.H., Westerterp, K.R., Andersson, A.B., Forslund, J.M. and Hambraeus, L.M., 1996. The influence of physical
activity on BMR. Medicine and Science in Sports and Exercise, 28(1), pp.85-91.
[email protected] 06 Aug 2018
FITNESS IN SOCCER
Physical abilities and the role of aerobic fitness
73
5
PHYSICAL ABILITIES
AND THE ROLE OF AEROBIC FITNESS
Jan Van Winckel, Werner Helsen, Bart De Roover, Steven Vanharen
5.1 INTRODUCTION
The physical preparation of elite soccer players has become an indispensable part
of contemporary professional soccer due to the high fitness levels required to cope
with the ever-increasing energy demands of match play (Carling et al., 2008; Iaia
et al., 2009). Team sport athletes require a high level of aerobic fitness in order to
generate and maintain power output during repeated high-intensity efforts. A
well-developed level of aerobic fitness also helps to recover quickly between these
high-intensity efforts (Bishop and Spencer, 2004). This ability to recover between
bouts of high-intensity activity and subsequently repeat these efforts is a critical
physical ability of the modern-day soccer player (Gabbett and Mulvey, 2008).
The amount of high-intensity exercise carried out accounts for about 15–19% of
the total distance covered and 10–15% of match play (Stone and Kilding, 2009).
Although 60% of the time between consecutive high-intensity actions across match
performance is spent walking, evidence shows that per game, top-class soccer play-
ers perform 150–250 intense actions (Mohr, Krustrup and Bangsbo, 2003), with a
high-intensity action every 72 seconds (Bradley et al., 2009). Based on the physical
demands and characteristics of team sport competition, and the potential impor-
tance of aerobic fitness, it is clear that a significant portion of the conditioning pro-
grams for soccer players should focus on improving their aerobic fitness in order to
repeatedly perform high-intensity exercise bouts and recover adequately between
these bouts (Stone and Kilding, 2009). Aerobic fitness measurements such as maxi-
mum oxygen uptake (VO
2max) and the anaerobic threshold may also discriminate
between players of different competitive levels (Stølen et al., 2005), so soccer trai-
ning programs should regard aerobic conditioning as an important part of the sea-
sonal training plan (Impellizzeri et al., 2005).
[email protected] 06 Aug 2018
5.2 PHYSICAL ABILITIES
We have adapted the classification developed by Steinhofer (Steinhofer, D., Leistungssport, Vol. 26, No. 6, 1993) to define the various physical
abilities and the corresponding training methods. This classification will be used throughout this book to set up training plans.
Physical
ability
Methodical
Training
Training Me-
thods
Abbrevia-
tion
Characteristics
Volume
(min)
Repetiti-
ons
Intensity
(average
velocity)
Intensity
(HR )
max
%
Intensity
(VO
)
2max
%
Work/
rest
ratio
Aerobic
Endurance
Continuous
principle
(without reco-
veries)
Long slow dis-
tance
LSD
Long slow distance.
Uninterrupted low load
intensity high volumes
60 - 100
1
60
60
40
8/1
Continuous
extensive
ConE
Uninterrupted low to
medium load intensity
high volumes
15 - 30
1-4
70
70
58
5/1
Variable enduran-
ce method
CV
Unplanned intensity
changes
30 - 45
1-3
60-100
60-100
40-100
5/1
Fartlek variable
method
Fa
Systematic intensity
changes
30 - 45
1-3
60-100
60-100
40-100
5/1
Continuous
intensive
ConI
High intensity, medium
volumes
8-15
3-5
75
75
65
3/1
Table 5.1: Aerobic endurance and the different training methods
F
IT
N
E
SS
IN
S
O
C
C
E
R
Ph
ys
ic
a
l a
b
ili
ties
a
n
d
th
e
ro
le
o
f a
ero
b
ic
fit
n
ess
74
[email protected] 06 Aug 2018
Physical ability
Methodical
Training
Training Methods
Abbreviation
Characteris-
tics
Volume
(min)
Repetitions
Intensity
(average
velocity)
Intensity
(HRmax)
%
Intensity
(VO
)
2max
%
Work/rest
ratio
Anaerobic end-
urance
Interval
principle
(incomplete
recoveries)
Interval method (Medium to intensity, medium to high volumes)
VO
Interval
2max
V Int
O2
High intensity,
high volume
5-8
6-12
85-90
85-90
75-83
2/1
Long interval
loads
Lint
2 to 5 minutes
3-5
5-8
90-95
90-95
83-90
2/1
Medium interval
loads
Mint
1 to 3 min
1-3
8-15
90-95
90-95
83-90
2/1
Short interval
loads
Sint
15 s to 1 min
30-
60sec
10-20
90-95
90-95
83-90
2/1
Repetition method (High intensity, limited to low to medium volumes)
VO
repetition
2max
VO Rep
2
High intensity,
high volume
4
6-12
85-90
90-100
83-100
2/1
Long repetition
load
LRep
2 min
2-3
3-5
90-95
95-100
90-100
2/1
Medium repetition
MRep
1 min to 2 min
1-2
8-12
90-95
95-100
90-100
2/1
Short repetition
loads
Srep
15 s to 1min
15-
60sec
8 tot 10
90-95
95-100
90-100
2/1
Table 5.2: Anaerobic endurance and the different training methods
F
IT
N
E
SS
IN
S
O
C
C
E
R
Ph
ys
ic
a
l a
b
ili
ties
a
n
d
th
e
ro
le
o
f a
ero
b
ic
fit
n
ess
75
[email protected] 06 Aug 2018
FITNESS IN SOCCER
Physical abilities and the role of aerobic fitness
76
5.3 AEROBIC FITNESS
A high level of aerobic fitness is important for the modern-day soccer player. A high
VO
2max has been correlated with work-rate during a game and is reported to aid
recovery during high-intensity intermittent exercise (Reilly, 1997). An increase in
the capacity of the O
2 transport system leads to a higher aerobic contribution to the
energy expended, taxing the anaerobic energy system less and subsequently redu-
cing fatigue by saving glycogen and preventing decreases in muscle pH (Impel-
lizeri et al,. 2006). Helgerud et al. (2001) concluded that enhanced aerobic fitness
in soccer players improved their performance by increasing the distance covered
(20%), enhancing work intensity, and increasing the number of sprints (100%) and
involvements with the ball during a match (24%). This study found a 10% incre-
ase in VO
2max after the addition of 20 specific training sessions to a normal soc-
cer training regime in 10 weeks, a finding reproduced by McMillan et al.(2005). A
reduced attention to aerobic conditioning during the competitive season, in some
sports, suggests that the importance of aerobic endurance may be underrated. This
may be warranted in some instances, such as if other aspects (technical or physical)
are shown to be more important. Accordingly, it appears that coaches, along with
strength and conditioning professionals, prioritize training regimens that focus on
improving anaerobic fitness during the competitive season. This is most probably
because high-intensity activities are associated with important game-winning situ-
ations, such as scoring points in basketball or scoring a try in rugby union. Howe-
ver, it should be emphasized that a lack of aerobic conditioning is also very likely
to influence the ability to repeatedly perform, and recover from, high-intensity acti-
vity (e.g., sprints), so the absence of aerobic conditioning during the competitive
season, regardless of sport, may not represent best practice in terms of optimizing
the condition of athletes (Stone and Kilding, 2009).
Continuous extensive and continuous intensive training drills train soccer players
to be able to sustain 90 minutes of competitive match play. These drills particu-
lary invoke beneficial peripheral (muscular) adaptations in soccer players, but also
are of benefit to the cardiovascular (central) system. For example, these training
drills increase muscular capilliarisation and increase the concentration of specific
intra-muscular enzymes that helps the player to burn more fats during match-play,
therefore crucially preserving muscle glycogen stores. Some examples of these trai-
ning drills are now presented in a soccer-specific manner.
[email protected] 06 Aug 2018
FITNESS IN SOCCER
Physical abilities and the role of aerobic fitness
77
5.4 SOCCER-SPECIFIC TRAINING DRILLS USING THE CONTINUOUS
PRINCIPLE
5.4.1 Continuous extensive
Explanation:
Create two diamond-shaped forma-
tions next to each other with a mini-
mum of six players. The positions of
the cones can be position specific.
Player X1 plays to player X3, who sets
the ball to player X2, who then plays to
player X4. Player X4 dribbles with the
ball toward the starting position X5 on
the other side.
Progression
X1 – X2 – X3 – X4 – X5-…
Variation:
Player X1 plays to player X2, who
sets it back to X1. Player X1 passes to
player X3, who sets it back to player
X2, who then plays to player X4.
Explanation:
X1 passes to X2, who receives, turns,
and then plays the ball to X3. X3 passes
to X4, who receives the ball and plays
the ball to the GK using the inside of
the foot and keeping the ball low. After
finishing, X4 dribbles back with the
ball, performs a SAQ exercise as indi-
cated, and begins a new exercise at the
other side to ensure both feet are being
used.
Variations
• X1 passes to X2, who plays back to
X1. X1 then plays to X3, who recei-
ves, turns and plays to X4. X4 shoots
the ball into the hands of the GK.
• X1 passes to X2, who plays back to
X1. X1 then plays to X3. X3 plays
back to X2, who passes to X4. X4
then finishes by putting the ball in a
corner of the goal.
• X1 passes to X2, who plays back to
X1. X1 then plays to X3. X3 plays
back to X2, who passes to X4.
X4 then puts the ball back to X3,
making a feint before receiving the
ball again from X3 and finishing in a
1v1 situation with the GK.
• Integration of defenders.
Comments
• Passing quality
• Continuous running exercises
Progression
X1 – X2 – X3 – X4 – X5 – X6 – X7 – X8
[email protected] 06 Aug 2018
FITNESS IN SOCCER
Physical abilities and the role of aerobic fitness
78
Explanation
Positions can be changed and the passing direction
can also be altered. The exercise starts with a throw
from the goalkeeper or a pass from the coach.
Variations
• Different passing directions.
• Different formations
Progression
Stay in position or rotate:
X1-X2-X3-X4-X5-X6-X6-Y1-Y2-...
Explanation:
X1 plays to X2, who then plays to X3. X3 takes the position of X4.
Variation
• X1 passes to X2. X2 passes to X1, and X1 plays to X3.
• X1 passes to X2. X2 passes to X1, who plays to X3. X2 then puts (passive) pressure on X3, and
X1 asks for the ball on the inside or outside for a 1-2. X3 then has the option to take on the
defender and go past X2 or engage in a 1-2 with X1.
• X1 to X2, who sets it back to X1. X1 plays to X3, who does a 1-2 with X2.
Progression:
X1-X2-X3-X4-X5-6-X1
[email protected] 06 Aug 2018
FITNESS IN SOCCER
Physical abilities and the role of aerobic fitness
79
5.4.2 Continuous intensive
Explanation
X1 plays to X3, who then plays the ball to X2.
X2 plays the ball to X4, who puts the ball, over
the ground using the inside of the foot, to the
GK. After finishing, X4 returns down the mid-
dle and begins a new exercise at the other side,
so both left and right sides are practiced.
Variations
• X1 to X2, X2 to X1, X1 plays to X3, X3 to X2,
who then plays the ball to X4, who recei-
ves, turns and shoots into the hands of the
keeper, still with a controlled shot.
• X1 to X2, X2 to X1, X1 to X4. X4 plays to
X3, who then dribbles and shoots on goal.
If desired, X3 can make a skill movement
before finishing.
• Integration of defenders.
Progression:
• Playing to the goalkeeper with inside of the
foot.
• Playing into the goalkeeper’s hands
• Playing to the corners with the inside of the
foot.
• Normal finishing to score a goal.
Comment
Adapt distances to the objective of the peri-
odization and the number of players.
Progression
X1 – X2 – X3 – X4
[email protected] 06 Aug 2018
FITNESS IN SOCCER
Physical abilities and the role of aerobic fitness
80
Explanation
The game is played 10v10 on the field
with one neutral player of each team
on both sides of the pitch. The neutral
players have to play the ball back into
the game while using a maximum two
touches and then change position with
the player he received the ball from.
The aim is to get width into the game.
Variations
• The neutral player gets the ball, puts it
back in the game with one touch and
then changes position.
• The neutral player receives the ball
and is obliged to dribble into the field
before playing the ball to one of his
teammates (decision making).
• Same as variation 2, but when drib-
bling into the field, his third touch of
the ball needs to be a pass (speed of
execution).
• Variation in the number of touches.
• Variation in how to make goals (one
touch, keep possession after goal…..)
• If you want to bring depth in the
game, you can put the neutral players
between the small goals.
Comments
Emphasize the movement of the neutral players
along the side of the field. They need to participate
in an active way and anticipate the changing posi-
tions of the players in the field.
Explanation
The game is played using 10v10 in the
middle of the pitch. Each player is given
a particular number. The coach calls out
four numbers each time. These players
have to leave the box as quickly as pos-
sible, run around one of the sticks sur-
rounding the pitch, and return to their
positions as quickly as possible. This
means there are six playing against 10
every time the coach calls four numbers
from the same team.
Variations
• You can vary the amount of numbers
you call from each team, so the teams
play against each other in different
numbers, changing the intensity each
time.
• When calling the number of a player,
you can add the number of a specific
cone around which they have to run,
as well as the direction (Left/Right)
(different distances).
• Numbers can be paired, so players
from both teams have to leave the box.
• Play one or two touches.
Comments
• Players can be set up in a normal playing system.
• Assistant coaches can control offside rule.
[email protected] 06 Aug 2018
FITNESS IN SOCCER
Physical abilities and the role of aerobic fitness
81
Explanation
Player X1 plays the ball to X2. Player X2
plays the ball straight back to player X1.
Player X1 receives the ball and passes
to X3, and player X3 plays straight to
X2, who passes back to X3. X3 receives
and plays a long ball to X5. The same
exercise is then started on the other side
with another ball.
After X3 has kicked a long ball, he has
a ball played to him by the coach and
finishes in one or two touches. He then
runs to position X4.
Comments
• Various passing configurations are
possible.
• The exercise is best started off with
one ball
Progression
X2 – X1 – X3 – X4
Explanation
The play starts with a dribble by X1. X1
plays the ball to X3, who plays to X2.
X2 then dribbles inside and plays to X4,
who receives, turns, and plays the ball
to the other side (to X5). After X4 has
given the pass to X5, the GK throws a
ball toward X4, which he has to control
and finish. Same exercise at both sides
with both groups working simultane-
ously. The coach gives a signal when
the next players can begin to coordinate
and control the intensity.
Variations
• X1 to X3, who plays it back to X1. X1
to X2, who dribbles inside and plays
to X4. X4 puts it back to X2, who
gives a long ball to X5.
• X1 to X3, who puts it back to X1. X1 to
X2, who puts it back to X3. X3 plays
to X4, who plays it back to X2. X2
gives the long ball to X5.
• Integration of defenders.
Comments
• Various passing configurations are
possible.
• The exercise can be started off with
one ball
Progression
X1-X3-X2-X4-X5-X6-X7-X8
[email protected] 06 Aug 2018
FITNESS IN SOCCER
82
Physical abilities and the role of aerobic fitness
SUMMARY
Both low-to-moderate-intensity “extensive” soccer exercises and more intense,
but shorter, “intensive” soccer drills are important to improve soccer-specific fit-
ness. Continuous extensive games (e.g., 4 x 20 minute bouts of 11v11 on a full-size
pitch) train the soccer players’ capacity to complete 90 minutes of competitive
match play. More intensive soccer drills of shorter duration (e.g., 8 x 4 minute
bouts of 4v4 small-sided games) train soccer players to play at a high intensity
and cope with the demands of an intensive period during a game. High-intensity
interval training is discussed in the next chapter.
REFERENCES
•
Bishop, D. and Spencer, M., 2004. Determinants of repeated-sprint ability in well-trained team-sport athletes and endurance-trained
athletes. J Sports Med Phys Fitness, 44(1), pp.1-7.
•
Bradley, P.S., Sheldon, W., Wooster, B., Olsen, P., Boanas, P. and Krustrup, P., 2009. High-intensity running in FA Premier League soccer
matches. Journal of Sports Sciences, 27, pp.159–168.
•
Gabbett, T.J. and Mulvey, M.J., 2008. Time–motion analysis of small-sided training games and competition in elite women soccer players.
Journal of Strength and Conditioning Research, 22, pp.543–552.
•
Helgerud J., Wisløff, U., Engen L. and Hoff, J. (2001) Aerobic endurance training improves soccer performance. Medicine and Science in
Sports and Exercise, 33:11, pp.1925-1931
•
Impellizzeri, F.M., Rampinini, E. and Marcora, S.M., 2005. Physiological assessment of aerobic training in soccer. J Sports Sci, 23(6),
pp.583-92.
•
Impellizzeri, F.M., Marcora, S.M., Castagna, C., Reilly, T., Sassi, A.Iaia, F.M., 2006. Physiological and performance effects of generic versus
specific aerobic training in soccer players. International Journal of Sports Medicine, 27, pp.483–492
•
McMillan, K., Helgerud, J., Macdonald, R., and Hoff, J.,2005 Physiological adaptations to soccer-specific endurance training in professi-
onal youth soccer players. Br J Sports Med 39: pp.273–277.
•
Mohr, M., Krustrup, P. and Bangsbo, J., 2003. Match performance of high-standard soccer players with special reference to development
of fatigue. Journal of Sports Sciences, 21, pp.519–528.
•
Reilly, T., Atkinson, G. and Waterhouse J., 1997. Travel fatigue and jet-lag. J Sports Sci., 15(3), pp.365-9.
•
Stølen, T., Chamari, K., Castagna, C. and Wisløff, U., 2005. Physiology of Soccer: An Update. Sports Me, 35, pp.501–536.
•
Stone, N.M. and Kilding, A.E., 2009. Aerobic Conditioning for Team Sport Athletes. Sports Med, 39(8), pp.615–642.
[email protected] 06 Aug 2018
FITNESS IN SOCCER
High-intensity interval training
83
6
HIGH-INTENSITY INTERVAL
TRAINING (WITH SPECIAL REFERENCE
TO SMALL SIDED GAME PLAY)
Kenny McMillan, Jan Van Winckel, Guido Seerden, Werner Helsen
6.1 INTRODUCTION TO HIGH-INTENSITY INTERVAL TRAINING (HIIT)
Interval training can be defined as a single or repeated interval of sport-specific
exercise with no additional resistance (Paton and Hopkins, 2004), while high-inten-
sity training refers to exercise performed above the second ventilatory threshold
(Seiler and Kjerland, 2006). Because training at high intensity puts a high strain
on the player, high-intensity training can be organized through interval training.
Interval training at high intensities (i.e., just below or around VO
2max) improves
endurance performance through improvements in all of the three components of
the aerobic system: VO
2max, anaerobic threshold, and running economy.
HIIT (High-Intensity Interval Training) may consist of high-intensity workloads
(> 85% VO
2max) executed for a short duration (between 30 seconds and 4 minutes)
interspersed with recovery times in between each exercise bout (usually in a 1:1, 1:2
or 2:1 ratio). HIIT can be traced back to as long ago as 1912, when the Finnish Olym-
pic long-distance runner Hannes Kolehmainen was reported to be using interval
training in his workouts (Billat, 2001). Several years later in the 1930s, the German
professor Dr. Woldemar Gerschler further developed interval training at the Uni-
versity of Freiburg. Gerschler teamed up with cardiologist Dr. Herbert Reindel, and
together they developed a training system consisting of running intense but short
distances followed by brief recovery “intervals” (Sears, 2001). Gerschler did not
allow a runner to begin the next repetition until the HR had returned to 120bpm
(Jenkins, 2005).
[email protected] 06 Aug 2018
FITNESS IN SOCCER
High-intensity interval training
84
Today, HIIT is regarded as one of the most effective means of improving the physi-
cal performance of athletes (Buchheit and Laursen, 2013a). Indeed, in already well-
trained athletes, the supplementation of high-intensity training on top of an already
high training volume seems to be extremely effective (Laursen, 2011; Laursen and
Jenkins, 2002). Various studies have shown the significant effects of HIIT in as little
as 2–3 weeks (Acton-Jacobs et al., 2013; Bogdanis et al., 2013; Buchan et al., 2013;
Tjonna et al., 2013; Boyd et al., 2013). Scientific research on the optimum length
of high-intensity intervals is equivocal, although positive results have been found
with various interval lengths ranging from 30 seconds up to 4 minutes (Little et al.,
2010; Esfarjani and Laursen, 2007; Laursen et al., 2002; Billat et al., 2000; Smith et al.,
1999). With regards to the training intensity, scientific research demonstrates that
sub-maximal (i.e., 90–95% VO
2max) (Zuniga et al., 2011) or maximal intensities (100%
VO
2max) (Bishop et al., 2011) elicit the greatest adaptations. In their review on HIIT,
Buchheit and Laursen (2013a) suggest that maximal or close to maximal intensities
are the most effective at increasing aerobic capacity because they stress the oxygen
transport system the most, activate more and larger motor units of muscle fibers,
and are performed at near maximal cardiac output. While there is evidence that
there are still benefits to be gained from HIIT training programs using lower inten-
sities (Boyd et al., 2013), the most profound benefits are realized at higher intensi-
ties (Acton-Jacobs et al., 2013; Boyd et al., 2013; Cicioni-Kolsky et al., 2013; Moholdt
et al., 2013).
When examining the effect of training intensity distribution on aerobic fitness vari-
ables in elite soccer players, Castagna et al. (2011) reported that even though almost
two-thirds of players’ training time was spent at low intensities, only the time spent
at high intensity (90% of HR
max) was related to changes in aerobic fitness. Impelliz-
zeri et al. (2005) reported similar findings and demonstrated a significant correla-
tion between time spent in high-intensity zones and changes in oxygen uptake at
lactate threshold. These results highlight the effectiveness of high-intensity training
in soccer. It is believed that an optimal stimulus to elicit both maximal cardiovascu-
lar and peripheral adaptations is one where athletes spend at least several minutes
per session in their “red zone,” which generally means reaching at least 90% VO
2max
(Buchheit & Laursen, 2013b). High-intensity training that raises the HR to above
90% of HR
max should constitute at least 7–8% of the total weekly training plan for
elite soccer players during preseason and in-season (Castagna et al., 2013).
[email protected] 06 Aug 2018
FITNESS IN SOCCER
High-intensity interval training
85
6.2 HIIT EFFECTS ON CARDIOVASCULAR AND MUSCULAR ADAPTATIONS
The cardiovascular and muscular adaptations to HIIT are summarized in the table
below.
Effects of High Intensity Interval Training
Cardiovascular adaptations
• Increased cardiac muscle capillary density
• Lowered HR at similar pre-training work levels
• Increase cardiac efficiency and the maximal mitochondrial capacity of the heart
(Hafstad et al., 2011).
• Increased stroke volume (Helgerud et al., 2007)
• Lower blood lactate levels for a given work intensity
• Increased left ventricle volume and increased contractibility (Slordahl et al., 2004)
• Increase in VO
(Daussin et al., 2008)
2max
Muscular adaptations
• Increased transcription and biogenesis of mitochondria in the skeletal muscle cells
of highly trained athletes (Acton-Jacobs et al., 2013)
• Increase in mitochondria (number and size) (Gibala, 2009)
• Increase in maximal activities of mitochondrial enzymes in skeletal muscle
(Kubekeli et al., 2002; Laursen and Jenkins, 2002)
• Increased proportion of Type IIa fibers (Billat, 2001)
• Optimized oxidative phosphorylation
• Increase in oxidative enzymes (Burgomaster et al., 2008)
• Activation of PGC-1
via AMPK pathways
• Increase in fat oxidative capacity (Talanian et al., 2007)
• Increase in GLUT4 and glycogen
Table 6.1: Overview of the effects of HIIT
6.3 LACTATE FORMATION DURING HIIT
During oxygen-independent glycolysis, glucose/glycogen molecules are processed
and broken down inside the muscle cells. Each molecule of glucose is broken down
to deliver ATP, and two molecules of lactic acid are produced (a proton and lactate).
Many coaches still believe that lactate is a metabolic dead-end only formed under
anaerobic conditions, with lactate playing the role of the toxic by-product. This
oxygen-independent glycolysis works continuously (even during rest) and not
only when sufficient oxygen is unavailable (Brooks, 1986). All energy systems are,
to a greater or lesser extent, active all the time, and their contributions depend on
the energy requirements and therefore the intensity and duration of exercise.
The level of lactate found in the blood and muscles is the difference between lactate
produced and lactate processed. At some point of increasing intensity, lactate pro-
duction will become higher than lactate clearance. In the past, this was referred to
as the anaerobic threshold or the Onset of Blood Lactate Accumulation (OBLA).
We use the term lactate threshold in this book. This lactate threshold is determined
not just by lactate production but also by the ability of muscle cells to remove and
process lactate. If lactate levels accumulate, as may happen during HIIT, glycolysis
is inhibited and the muscle fiber fatigues due to the protons associated with lactate
ions.
[email protected] 06 Aug 2018
FITNESS IN SOCCER
High-intensity interval training
86
6.4 LACTATE CLEARANCE DURING HIIT
Lactate can be cleared via two mechanisms. It can be metabolized back to pyru-
vate and processed in the muscle cell by oxidative phosphorylation, which is an
oxygen-dependent process. On the other hand, lactate can leave the muscle cell
through the cell membrane. It may then be absorbed and utilized in oxidative meta-
bolism by other muscle cells within the same muscle, or it may leave the muscle
and enter the circulation system.
Once in the circulation, lactate can be:
• Transported to other skeletal muscles where it can be stored
• Used by the heart for oxidative energy production
• Transported from the peripheral tissues to the liver by means of the Cori
Cycle, where it is then reformed into pyruvate through the reverse reaction
using lactate dehydrogenase
• Transported to the brain for oxidative energy production.
The lactate shuttle, which describes the movement of lactate intracellularly and
intercellularly (cell to cell), was hypothesized by Dr George Brooks in the 1980s.
This theory states that lactate produced at sites with high rates of glycolysis and
glycogenolysis can be shuttled to adjacent or remote sites, including the heart and
other skeletal muscles, where the lactate can be used as a gluconeogenic precursor
or substrate for oxidation (Brooks, 2009). During HIIT, fast-twitch fibers begin pro-
ducing lactate at high rates. Because fast-twitch fibers are not built well for oxida-
tive phosphorylation, lactate is emitted and subsequently picked up by slow-twitch
fibers, which are better equipped for oxidative phosphorylation, or the circulatory
system may carry it to the heart, the liver, the brain or less active muscles.
6.4.1 Monocarboxylate transporters (MCTs) and HIIT
Monocarboxylate transporters (MCTs) are proton-linked plasma membrane trans-
porters that carry molecules having one carboxylate group (monocarboxylates),
such as lactate and pyruvate, across biological membranes.
In the literature, at least 14 MCTs have been identified, although MCT1 and MCT4
seem to be most relevant to lactate and pyruvate transportation within cardiac and
skeletal muscle (Bonen, 2001). MCT1 and MCT4 have been identified as H+/lactate
symporters capable of mediating the bidirectional transport of lactic acid across the
plasma membrane (Halestrap and Meredith, 2004).
MCT1 is the most important MCT for endurance athletes because it is the key
lactate mover in muscle cells. Slow-twitch muscle fibers in particular have relati-
vely large amounts of MCT1 in their membranes. The presence of large quantities
of MCT1 in slow-twitch fibers and cardiac muscle cells demonstrates that MCT1 is
probably responsible for clearing lactate to cells that are better equipped for oxida-
tive phosphorylation.
Unlike MCT1, MCT4 is more common to fast-twitch muscle fibers, suggesting that
MCT4 is better equipped to transport lactate out of the muscle cell. Exercise trai-
ning can increase the expression of both MCT1 and MCT4 in muscle cells, and this
effect is related to the intensity of training. MCT4, like other glycolytic enzymes, is
up-regulated by hypoxia. This adaptive response allows the increased lactic acid
produced during hypoxia to be rapidly cleared from the cell (Ullah et al., 2006).
[email protected] 06 Aug 2018
FITNESS IN SOCCER
High-intensity interval training
87
Although the research into MCTs is still in its infancy, it can already be concluded
that lactate processing can be improved through appropriate training. To improve
lactate clearance and processing in soccer players, training at fluctuating high
intensities (i.e., HIIT) is necessary. During soccer-specific HIIT for example, lactate
is produced, and during recovery intervals, the body is trained to efficiently utilize
and clear the lactate. Therefore, HIIT is important to improve MCT concentrati-
ons, lactate processing, lactate clearance, the lactate threshold, and performance
capacity.
6.5 HIGH-INTENSITY INTERVAL TRAINING VERSUS LOW-INTENSITY
CONTINUOUS TRAINING
Both HIIT and low-intensity continuous training are important in improving aero-
bic fitness. The main goal of interval conditioning is to induce a greater training
stimulus at intensities higher than what would be tolerated in a single bout of
continuous exercise (Wenger and Bell, 1986). Continuous low-intensity training
recruits predominantly slow-twitch motor units, while HIIT will recruit additio-
nal fast-twitch motor units for relatively short durations (Enoka and Duch, 2008).
The cardiovascular adaptations that occur with HIIT are similar, and in some cases
superior, to those that occur with continuous endurance training (Helgerud et al.,
2007; Wisløff, Ellingsen and Kemi, 2009). Moreover, HIIT can often produce a broad
range of physiological effects in less time than high-volume low-intensity conti-
nuous exercise (Londeree, 1997; Daussin et al., 2008; Psilander et al., 2010). This
may be because the time course for performance improvement with increases in
training volume may not occur as rapidly as when using acute increases in high-in-
tensity training (Laursen et al., 2002; Laursen, 2011).
However, some important physiolo-
gical adaptations occur in response to
low-intensity continuous training that
are not observed with HIIT (Laursen,
2011). For instance, Ingham et al. (2008)
demonstrated that a low-intensity con-
tinuous training group improved their
speeds at lactate threshold to a greater
extent than the mixed-intensity training
group. It is often purported that these
periods of relatively low intensity and
high training volumes may provide
the “aerobic base” needed to facilitate
the specific adaptations that occur in
response to HIIT (Laursen, 2011). The
periodization of continuous extensive
soccer drills (e.g., 2 x 15 minutes of 9 v 9
play at an intensity of 70-75% of HR
max)
and higher intensity “intensive” drills
(e.g., 6 x 4 minutes of 4 v 4 small sided
game play play) throughout the soccer
season is discussed in Chapters 14 to 18.
[email protected] 06 Aug 2018
FITNESS IN SOCCER
High-intensity interval training
88
6.6 HIGH-INTENSITY INTERVAL TRAINING WITH OR WITHOUT THE BALL
In soccer, two different conditioning methods are usually used to improve fitness:
conditioning exercises without the ball and conditioning exercises with the ball.
Conditioning exercises using the ball are being increasingly implemented in soccer
practice (Hoff et al., 2002; McMillan et al., 2005). The main advantage of skill-based
conditioning games and exercises over traditional interval training without the ball
(e.g., generic running drills) is that they also provide the opportunity to develop
decision-making and problem-solving skills while under stressful physical loads
(Gabbett, 2001). Moreover, soccer-specific conditioning drills such as small-sided
games (SSGs) may be slightly more strenuous than traditional training approaches
(Impellizzeri et al., 2005). These higher responses in soccer players may be attribu-
ted to use of the ball, which increases the metabolic cost of performing any given
activity (Little and Williams, 2006; Kelly and Drust, 2009). The motivation and ent-
husiasm of players may also be greater when engaging in soccer-specific conditio-
ning games and drills (Stone and Kilding, 2009).
6.6.1 Generic continuous running drills
Fig. 6.1: The “Hoff track” used for soccer-specific interval training.
[email protected] 06 Aug 2018
FITNESS IN SOCCER
High-intensity interval training
89
Hoff and Helgerud (2004) argue that continuous interval training for 3–8 min using
a working intensity of 90–95% of HR
max should elevate VO2max of soccer players by
enhancing stroke volume and thereby increasing cardiac output. Hoff et al. (2002)
designed a soccer-specific dribbling track (Hoff track) for this purpose, and they
reported that this form of interval training resulted in physical loads equivalent to
94% HR
max and 92% VO2max, which are optimal intensities for developing aerobic
fitness (figure 6.1). When using the Hoff track to conduct 4 x 4 minute intervals at
90-95% of each players HR
max, McMillan et al. (2005) increased the average VO2max
of the Celtic FC U-18’s squad by approximately 10% in only 10 weeks. Two inter-
vals sessions were performed per week in addition to the normal soccer training
regime.
Importantly, by using the Hoff track soccer players can improve their aerobic end-
urance in a safe and controlled manner, due to the low number and magnitude of
accelerations and decelerations involved (low neuromuscular load), and of course
a lack of tackles and body contact. When using SSGs for fitness training, there is
always the risk of injury due to lots of twisting and turning movements, mistimed
tackles and body collisions.
6.6.2 Generic intermittent running drills
Soccer coaches can also prescribe high-intensity intermittent drills to improve anae-
robic and aerobic fitness. Generic running drills involving short exercise times and
recoveries (e.g., 15s running:15s recovery and 30s running:15s recovery are typi-
cal examples). Work-rest ratios, running velocity, accelerations, decelerations and
changes of direction can all affect the intensity of these drills. Running at intensities
close to or just over the velocity at VO
2max (vVO2max) for a period of 5 – 8 minutes is
an example of a generic intermittent running drill that would serve useful to soccer
players. The running velocity at the end of the 30-15 Intermittent Fitness Test (vIFT)
as described in Chapter 7 is an example of an individualized running velocity that
can be used to design and implement effective generic intermittent running drills
to improve a soccer player’s endurance capabilities. Since the main scope of this
chapter is on high-intensity SSG play, the reader is referred to the excellent work of
Buchheit and Laursen (2013a; 2013b) for a comprehensive overview of such drills
and the physiological adaptations they manifest.
One of the main advantages of using generic running drills to improve the end-
urance capabilities of soccer players is that intensity can be easily controlled and
individualized for each player. For example, when using the Hoff track, each player
runs at his own individualized running speed to keep his HR at between 90-95%
HR
max. Another example would be a squad of players all performing intermittent
running at 90% of their vVO
2max or vIFT.
[email protected] 06 Aug 2018
FITNESS IN SOCCER
High-intensity interval training
90
6.7 SMALL-SIDED GAMES (SSGs)
Recently, many people have tried to rediscover the usefulness of SSGs within soc-
cer fitness training (Aguiar et al., 2012; Clemente et al., 2012, Hill-Haas et al., 2011).
SSGs have the benefit that they reproduce the movements, technical conditions, and
physiological intensities of a real soccer game (Gamble, 2004; Owen, 2003; Gregson
and Drust, 2000; Little, 2009) while simultaneously obliging players to deal with
pressure and decision making in a fatigued status (Gabbet and Mulvey, 2008). They
also help players to develop their technical and tactical skills within a realistic
game situation. Research has shown that athletes regard match-like training sessi-
ons to be the most important practice activities for improving performance (Singer
and Janelle, 1999; Hodges and Starkes, 1996; Starke et al., 1996; Helsen, Starkes, and
Hodges, 1998). Moreover, SSGs also increase the players’ motivation and compli-
ance when compared to traditional fitness training sessions because they find them
more sport specific (Gregson and Drust, 2000; Little, 2009).
Due to the interaction between technical ability, tactical skills, and the physical
component, the use of SSGs can be more time efficient as these three factors can be
trained alongside each other (i.e., concurrent training) (Gregson and Drust, 2000;
Little, 2009). Nevertheless, this depends on the specific game format. Some vari-
ables affect the exercise intensity, time-motion characteristics, and technical load.
Coaches try to change the training stimulus by altering variables such as:
• the size of the pitch
• number of players involved
• use of goalkeepers
• type of ball possession
• goal orientation
• tactical obligations
• coach encouragement
• training regimen
• players’ characteristics
Fig. 6.2: The factors influencing the intensity of
a small-sided game.
It is hard not to get lost within the massive amount of research data, so presented
below is a brief overview together with some practical implications of the different
types of SSGs and the effect they may have on the acute physiological responses of
the players, as well as long-term physiological adaptations.
[email protected] 06 Aug 2018
FITNESS IN SOCCER
High-intensity interval training
91
6.7.1 Pitch size
Increasing the pitch size results in higher cardiovascular strain (Aroso et al., 2004;
Tessitore et al., 2006), although Clemente et al. (2012) concluded that there is no
consensus within the literature about the effects of pitch size on HR. Overall, incre-
ased pitch area increases HR, rate of perceived exertion (RPE) and blood lactate
concentration. However, when looking at the effect of pitch dimensions on exercise
intensity within SSGs, we need to differentiate between the absolute and relative
pitch areas. The absolute area is the total pitch area (e.g., 40x20m), while the rela-
tive pitch area is the total pitch area divided by the total number of players (Hill-
Haas et al., 2011). This gives the individual playing area for a player (e.g., 10 square
meters). Rampinini et al. (2007) found that a larger absolute pitch size resulted in
higher exercise intensities (HR, RPE and blood lactate concentration) compared
to medium- and small-sized pitches. On the other hand, Kelly and Drust (2009)
stated that the pitch size does not influence the intensity of SSGs when the num-
ber of players involved is kept constant, but rather that it only altered the number
of tackles and shots. It did not significantly change the number of other technical
actions, such as passing, receiving, turning, dribbling, interception and heading.
Casamichana and Castellano (2010) indicated that an increase in relative playing
area results in a larger physical (i.e., total distance covered; distance covered in
low-, medium- and high-intensity running; distance covered per minute; work-to-
rest ratio; maximum speed; and sprint frequency) and physiological workload (i.e.,
percent of HR
max, percent of mean HR, time spent above 90% HRmax). The effective
playing time and RPE was also higher. Some motor behaviors (i.e., interception,
control and dribble, control and shoot, clearance, and putting the ball in play) were
shown less frequently, however. Some other studies have even found lower exer-
cise intensities with an increased relative pitch area (Rampinini et al., 2007).
6.7.1.1 Pitch size and tactical training
Fradua et al. (2013) looked at pitch sizes extrapolated from full-size professional
matches in relation to the training of tactical aspects. Individual playing areas of
65–110 square meters with a length-to-width ratio of 1:1–1:1.3 are recommended
while training different tactical components. Coaches may use a relative pitch
area of 90 square meters (within a range of 70–110 square meters) for playing out
from the back and finishing, while 80 square meters (range 65–95 square meters) is
recommended to recreate transition play in the middle of field. Also, longer width-
to-length ratios are suggested for training transition play at this part of the field
(length-to-width ratio of 1:1.3), and a square-shaped pitch (1:1) is recommended for
playing out from the back and finishing sessions.
[email protected] 06 Aug 2018
FITNESS IN SOCCER
High-intensity interval training
92
6.7.2 Number of players involved
6.7.2.1
Decreasing the number of players
Generally, a lower number of players results in a higher exercise intensity, with
increased HR, RPE and blood lactate concentration (Duarte et al., 2009; Owen et al.,
2004; Sampaio et al., 2007; Williams and Owen, 2007). For example, a 3v3 results
in higher HRs with more goal attempts, dribbling, passing, tackling, high-inten-
sity activities, and total distance covered, combined with less jogging and walking,
than during a 5v5 (Platt et al., 2001). An interesting observation was that players
covered greater distances moving backward and sideways in a 4v4 compared to
an 8v8 (Jones and Drust, 2007). Reductions in the number of players also increased
the ball contacts per player (Balsom, 1999; Jones and Drust, 2007). This increased
individual possession of the ball might be the reason for an increase in exercise
intensity (Balsom, 1999; Reilly and Ball, 1984). Castellano et al. (2011), on the other
hand, stated that reducing the number of players does not alter the physical load
but rather just the physiological workload. A 3v3 provoked higher HR responses
and RPE scores than a 4v4, 5v5 or 6v6 (Rampinini et al., 2007). Therefore, the smal-
ler format was shown to be more intense.
This was also concluded in some research studies concerning youth soccer. The
physiological demands were found to be higher during 2v2 and 3v3 games when
compared to a 4v4 game (Dellal et al., 2011a). In another study, the HR and per-
centage of HR
max were higher during 3v3 and 4v4 games in comparison to 1v1
and 2v2 games, although the 1v1 game showed higher blood lactate concentra-
tion (Köklü et al., 2011). It was therefore concluded that smaller game situations
(e.g., 1v1) might support anaerobic adaptations for youth soccer players (Köklü
et al., 2013), but they also increase the technical demands. Players increased their
number of touches from, on average, 13 ball contacts in a ten-minute 8v8 game to
36 ball contacts in a ten-minute 4v4 (Jones and Drust, 2007).
6.7.2.2
Increasing the number of players
Generally, a greater number of players reduces the exercise intensities during SSGs.
Owen et al. (2004) found a lower mean HR and peak HR when players were added
to a SSG. They also concluded that an increase in the number of players on the pitch
leads to a decrease in technical actions per player.
6.7.2.3
Player number in relation to pitch area
An increase in absolute pitch area and player number may also result in a greater
relative pitch area, as has been shown in several studies (e.g., Rampinini et al.,
2007), and it seems that this lowers exercise intensity (Jones and Drust, 2007). This
observed reduction in the physiological parameters (Jones and Drust, 2007; Katis
and Kellis, 2009; Rampini et al., 2007) might have been the result of increasing the
total number of players or a failure by the additional players to cover more ground
within the absolute pitch area. When we decrease the number of players while
keeping the relative pitch area constant, the physiological and perceptual workload
increases as a result (Hill-Haas et al., 2009a).
[email protected] 06 Aug 2018
FITNESS IN SOCCER
High-intensity interval training
93
6.7.2.4
Having a floater or numbers up/numbers down
Some studies have focused on the effects of having a fixed overload or underload
situation, also known as having numbers up or numbers down, and the effect of
having a floater (a player who is only allowed to play with the team in possession
of the ball). Underloaded teams showed higher RPE scores compared to the nume-
rically superior team but with no differences in blood lactate concentrations and
%HR
max. A 4v3 or a 6v5 showed no significant difference in physiological and per-
ceptual responses compared to the games with a floater (3v3 +1 and 5v5 +1), but it
seems that playing with a floater might be more beneficial for developing aerobic
fitness. The floater covered more total distance, completed more sprints (>18km/h)
and had a higher RPE score post-training when compared to the players on either
the overloaded or underloaded team (Hill-Haas et al., 2010). Coaches sometimes
put players returning from injury into the position of floater because they may have
less risk of a contact injury due to the fact they cannot defend. However, coaches
need to be aware of the abovementioned facts before they put a player in a floater
position. That said, if you want to increase a rehabilitating player’s aerobic fitness,
you might want to consider him or her as a floater in a SSG.
6.7.3 Rule modifications
6.7.3.1
The use of goalkeepers
Generally, the use of goalkeepers may decrease exercise intensity, both in terms of
physiological and physical load. The HR of the players will drop (Sassi et al., 2004;
Mallo and Navarro, 2008) because players will protect their goal more carefully,
and this reduces the tempo of the game. Dellal et al. (2008) did find an increase
in HR while using goalkeepers in an SSG, and this might be due to an increase in
players’ motivation to attack and defend. The total distance and the time spent in
high-intensity running will also decrease, and the time spent standing and wal-
king will increase correspondingly (Mallo and Navarro, 2008). Players will have a
higher HR and cover more distance when playing without a goalkeeper, and they
will also have more ball contacts and make more short passes (Mallo and Navarro,
2008). Köklü et al. (2013) not only found an increase in HR but also in RPE, blood
lactate concentration, total distance covered, and greater distances at speeds of
7.0-12.9 km/h, 13.0-17.9 km/h and greater than 18 km/h. So, if coaches want to
place higher physiological strains on players, they should choose SSGs without
goalkeepers if they want to reduce the physiological strain, or vice versa.
If we look at the use of goalkeepers and the pitch dimensions in relation to tactical
training, we can divide the pitch into six different areas: areas 1 and 2 for playing
out from the back, 3 and 4 for midfield play, and 5 and 6 for finishing. Therefore,
we can use the guidelines set up by Fradua et al. (2013). The distance noted is the
distance between the goalkeeper and his closest teammate, according to the loca-
tion of the ball, regardless of being in or out of possession of the ball. The following
distances are suggested: 5–15m for zone 1, 10–20m for zone 2, 15–25m for zone 3,
20–30m for zone 4, and 25-35m for zones 5 and 6.
[email protected] 06 Aug 2018
FITNESS IN SOCCER
High-intensity interval training
94
6.7.3.2
Ball possession
Possession play generally affects the players’ physical and physiological respon-
ses, meaning that the game demands are higher (Castellano et al., 2013). When the
number of players was altered in a possession-based SSG, the HR response did not
show a significant change, but the physical demands decreased with a decrease in
player numbers.
An alteration in the type of possession game can also influence the technical and
physical demands of SSGs. Forcing the players to play one-touch leads to less suc-
cessful passes and duels. Therefore, more balls were lost during the game. It also
leads to higher blood lactate concentrations, RPE, and total distance covered in
high-intensity runs and sprints (Dellal et al., 2011b; Dellal et al., 2012a). Even a
permitted maximum of two touches leads to a higher perceptual training response
in terms of a higher RPE score (Sampaio et al., 2007) and high-intensity running
(Dellal et al., 2012a). Free play, on the other hand, led to lower RPE scores but only
for defensive midfielders, wide midfielders and forwards (Dellal et al., 2012a). A
coach can therefore manipulate the technical, physical and physiological demands
by altering the amount of touches allowed.
6.7.3.3
Goal orientation
It seems that changing the rules of the game influences the technical, physical and
physiological load, but also altering the task and goal orientation can influence
the acute physiological response. Duarte et al. (2010) showed that players’ HRs
were less variable during an SSG with goals scored by dribbling over a line when
compared to both double and central goal orientations. Therefore, if you want an
SSG with less variation in HR, it might be better to choose an SSG with a line goal
constraint.
6.7.3.4
Tactical obligations
Besides giving the players technical constraints to deal with during SSGs, we can
also alter the tactical objectives during the game. Obliging players to put pressure
on the team in possession results in a higher mean HR (Sassi et al., 2004). Player-
to-player marking increases blood lactate concentration (Sassi et al., 2004) and RPE
scores (Sampaio et al., 2007). Therefore, coaches can also alter the physiological
load by giving the players tactical assignments during SSGs.
[email protected] 06 Aug 2018
FITNESS IN SOCCER
High-intensity interval training
95
6.7.4 Coach encouragement
Even though we want our players to be internally motivated, active and consistent,
coach encouragement provokes a significant increase in players’ physiological res-
ponses during SSGs (Balsom, 1999). Higher HR, blood lactate concentration, and
RPE scores were noted for SSGs with coach encouragement when compared to
SSGs without. It even had a greater impact on these factors than an alteration in
pitch size and playing numbers (Rampinini et al., 2004).
6.7.5 Training regimen
6.7.5.1
Continuous vs. intermittent
An SSG can be conducted in either a continuous or an intermittent manner. Casa-
michana et al. (2013) stated that a continuous format leads to higher physical load.
However, others (Hill-Haas et al., 2009b) have found that the intermittent format
increased distances covered faster than 13 km/h. These latter researchers also
found higher percentages of HR
max and RPE scores. Both regimens can be used for
aerobic maintenance training during the in-season (Hill-Haas et al., 2009b). The-
refore, coaches can alter the physical and physiological loads by choosing either a
continuous or an intermittent SSG.
6.7.5.2
Work-to-rest ratio
A factor that also influences the players’ physical and physiological loads is the
work-to-rest ratio. Unfortunately, there is a lack of research looking at the effect of
different ratios within SSGs, so we cannot make a clear recommendation of which
ratios might be better for alternating the load, but coaches need to keep in mind
that this is also a crucial factor when using SSGs in fitness training.
6.7.5.3
SSG duration
The duration of an SSG can also influence the exercise intensity, but it does not
affect the technical actions per minute. When we increase the duration of a 3v3
from 2 minutes to 4 and 6 minutes, there is a significant effect of duration on HR.
The HR response was lower in the first setting when compared to the other two,
but the intensity dropped when moving from the 4-min to the 6-min SSG. The RPE
score increased linearly with duration. Even though the differences were small in
this study (Fanchini et al., 2011), coaches may change the duration of an SSG to
influence the physiological load.
6.7.5.4
Number of sets and repetitions
The number of sets and repetitions can also alter the technical, physical and physio-
logical performance. Generally, the amount of high- and very-high-intensity acti-
vity decreases, while blood lactate concentration, RPE and HR response increase
from the first repetition of an SSG to the fourth and last repetition. The amount of
duels and percentage of successful passes is also higher at the beginning of the first
two repetitions when compared to the last. Therefore, more balls were lost during
the four reps (Dellal et al., 2012b). Hence, the number of sets and repetitions also
seems to be an important variable in determining the training stimulus when fit-
ness training with SSGs.
[email protected] 06 Aug 2018
FITNESS IN SOCCER
High-intensity interval training
96
6.7.6
Players’ characteristics
6.7.6.1
Fitness level
Stone and Kilding (2009) reviewed the literature carefully and concluded that play-
ers with the highest VO
2max had the lowest percentage of VO2max during SSGs. It
follows that maybe the players with high VO
2max values should play as floaters in
order to get a higher aerobic workload during SSGs (Hill-Haas et al., 2010). Indeed,
a ceiling effect on improving aerobic fitness when solely using SSGs for fitness
training may be evident for players who have a very high level of aerobic fitness
(McMillan, unpublished observations). These players may have to include generic
running sessions into their weekly training regime (i.e,. 4x4 min runs at 90-95% of
HR
max, McMillan, 2005) in order to further improve their aerobic fitness.
6.7.6.2
Skill level
A lower skill level usually results in a lower technical performance during SSGs,
but with higher physical and physiological loads. Amateurs had a lower percen-
tage of successful passes, and even though they had a greater amount of ball pos-
session, they lost more balls per possession time. In contrast, they were involved in
fewer duels per minute (Dellal et al., 2011c), but this may be explained by the fact
that professional soccer players have better anticipation skills (Reilly et al., 2000)
and a faster running speed (Kaplan, Erkmen and Taskin, 2009). The type of ball
possession and goal orientation in SSGs had a strong influence on the HR response
of amateur soccer players. For example, an SSG with free play and an objective to
keep possession of the ball showed a higher HR compared to an SSG with a floater
or the presence of a neutral zone (Dellal et al., 2011c).
Non-professionals also covered less distance overall, especially during high-inten-
sity running and sprinting in one-touch soccer and free play. Reducing the amount
of touches allowed (one or two touches) led to a greater difference between ama-
teurs and professionals in terms of physical load. Amateurs also showed higher
RPE and blood lactate concentrations, whereas the HR responses, expressed in per-
centages of HR
max were similar to professionals (Dellal et al., 2011c). Therefore, Del-
lal et al. (2011c) recommend that amateur coaches use at least two touches, while
professional soccer coaches should use only one or two touches per ball possession
to recreate an elite game situation within SSGs. Coaches should also ensure that fit-
ness and skill mismatches are not present between the teams participating in SSGs.
6.7.6.3
Age
Dellal et al. (2011a) stated that youth players do not have the same technical abili-
ties and experience as adults, and this could lead to greater physical demands for
youth soccer players within SSGs. However, youth players with lesser skill may
not be able to achieve and maintain the required physiological stress because they
are unable to consistently maintain the speed of the technical executions. This may
lead to counterproductive training sessions (Castagna et al., 2005). Therefore, the
age of the players has to be taken into account when developing SSGs.
[email protected] 06 Aug 2018
FITNESS IN SOCCER
High-intensity interval training
97
6.8 TRAINING TIME DISTRIBUTION
When examining the effect of training intensity distribution on aerobic fitness vari-
ables in elite soccer players, Castagna et al. (2011) reported that even though almost
two-thirds of players’ training time was spent at low intensities, only the time spent
at high intensity (90% of HR
max) was related to changes in aerobic fitness. Impelliz-
zeri et al. (2005) reported similar findings and demonstrated a significant correla-
tion between time spent in high-intensity zones and changes in oxygen uptake at
lactate threshold These results highlight the effectiveness of high-intensity training
in soccer. It is believed that an optimal stimulus to elicit both maximal cardiovascu-
lar and peripheral adaptations is one where athletes spend at least several minutes
per session in their “red zone,” which generally means reaching at least 90% VO
2max
(Buchheit and Laursen, 2013b). High-intensity training that raises the HR to above
90% of HR
max should constitute at least 7–8% of the total weekly training plan for
elite soccer players during preseason and in-season (Castagna et al., 2013).
[email protected] 06 Aug 2018
FITNESS IN SOCCER
High-intensity interval training
98
6.9 SOCCER-SPECIFIC TRAINING DRILLS
The drills presented below are examples of soccer-specific drills than can be per-
formed as high-intensity interval training to elicit anaerobic and aerobic adaptations.
6.9.1 VO
2max interval
Explanation
Position play 7v6 in the box. When the ball is
intercepted, the defending team plays the ball
to the other side, where their teammate asks for
the ball and continues to play 7v6. In the middle
of the field, we put three openings, marked by
cones. This is done to oblige the waiting player
to move during the game and ask for the ball
through one of these openings.
Variation
If the team in possession of the ball can make
ten consecutive passes, they can finish on the
goal and keep possession of the ball when they
score. One player of this team can infiltrate the
16 meter and score in a 1v1 situation with the
GK. Afterwards the coach puts a ball back into
play.
Comments
When the ball is out of play, the coach puts a
new one into play. The defending team has to
intercept the ball and then play to the other side
in order to become the attacking team.
Explanation
This game is played 6v6 in the center zone.
When three successive passes have been made,
a player in the end zone can be played to. This
player may then finish with a maximum of two
touches.
Variations
• Number of touches:
• Unlimited
• Two or three touches
• Two teams of eight players on the entire pitch,
with the two end zones in the large rectangle.
• One-touch finishing.
Comment
• The game is played with offside.
• The reference point is the line of the end zone.
[email protected] 06 Aug 2018
FITNESS IN SOCCER
High-intensity interval training
99
Explanation
A possession game with three teams of
four players. Two teams of four players
try to keep possession, while the third
team of four players tries to win the ball.
The team that loses the ball becomes the
defending team. This way, the game is
played 8 against 4.
Variations
• When the defending team recovers
the ball, they need to dribble outside
of the field to emphasize the infiltra-
tion into the available space. The two
possession teams need to prevent
this (transition). If the two possession
teams prevent them from dribbling
outside the field, they keep posses-
sion of the ball.
• After the defending team recovers
the ball, they need to dribble outside
the area and score in one of the small
goals. The two other teams need to
prevent this.
• Number of touches on the ball:
• Unlimited
• Two touches
• Mandatory one touch after playing two
touches
• Ball may not be played to a teammate
• The ball may not be passed back to the player
you received the ball from.
Explanation
This game is played 6v6 in the center
of the pitch. A player can enter the end
zone after three successive passes and
finish on the big goal or score in one of
the two small goals, which are placed
in the beginning of the end zone. The
player who has to finish on goal has a
maximum of two touches.
By adding the small goals to the game,
we
create
more
decision-making
moments for the players and emphasize
the transition movements of the players.
Variations
• When a player enters the end zone and
receives a pass, one opposing player
can enter the end zone to defend.
• When a player enters the end zone
and receives a pass, one of his team-
mates can enter the end zone as well,
together with one opponent, and
finish in a 2v1 situation plus the GK.
• Number of touches:
• Unlimited
• Two or three touches
• Two teams of eight players on the entire
pitch with the two end zones in the box.
• One-touch finish
• Numbers of passes before playing to
the end zone
Comment
• The game is played using the offside rule.
• The reference point is the line of the end zone.
[email protected] 06 Aug 2018
FITNESS IN SOCCER
High-intensity interval training
100
6.9.2 VO
2max
interval and repetition exercises
Explanation
3+GK versus 3+GK+2. A transition exer-
cise with two teams of six players each.
Three players of each team wait next to
the goal, with one player keeping a ball
at his feet in order to be ready to enter
the pitch as quickly as possible. Each
time the ball crosses the goal line (as well
as in the event of a goal), the team stan-
ding behind that goal line can immedia-
tely enter the pitch by dribbling the ball,
which means that the attacking team has
to change over to defense straightaway.
Variations
Number of players: 3 v 3
Comments
At least one pass must be made before a
goal can be scored.
[email protected] 06 Aug 2018
FITNESS IN SOCCER
High-intensity interval training
101
Explanation
Possession game with 5v5. A point can
be scored by playing to a teammate in
one of the two end zones.
Variations
• The team that scores a goal can gain an
extra point by having a second player
entering the end zone and receiving
the ball from the first player that ente-
red the end zone. The defending team
is now allowed into the end zone to
prevent the pass from the first to the
second player and therefore avoid
conceding another point.
• The game can also be played with two
goalkeepers in the end zones.
• Free play, one or two touches.
Comment
Coaches monitor offside rule on the
offside lines (line between the two
zones).
[email protected] 06 Aug 2018
FITNESS IN SOCCER
High-intensity interval training
102
6.9.3 Long interval and repetition exercises
Explanation
3v3 in the playing area. Three suppor-
ting players from each team stand on
three sides of the rectangle. The three
supporting players can occupy the four
sides of the pitch, encouraging them
to see and use the free space and make
space for each other. The players inside
the field play a possession game, using
the three supporting players, and try to
make ten consecutive passes in order to
score a point. The players inside cannot
use the same supporting player twice
in a row, obliging them to change direc-
tions. The supporting players cannot
defend each other.
Variations
• Number of touches on the ball
• Points can be scored in other ways, for
example by:
• Passing to a third player
• 1–2 after passing to the second
player, etc.
• It’s possible to add small goals, and a
team may score after a certain number
of consecutive passes.
Comment
Players off the pitch cannot pass directly to each
other.
[email protected] 06 Aug 2018
FITNESS IN SOCCER
High-intensity interval training
103
Explanation
Three teams of six players each. Two
teams of six players (attacking) take
up their places in the outer boxes. The
defending team puts three players in
the middle section and three players
play 6v3 in one of the two rectangles.
The two attacking teams play the ball
around, and they can also play the ball
to the other rectangle. The players in the
middle section of the defending team
then try to win the ball in that rectan-
gle, while the other three players move
to the middle section. They try to inter-
cept the ball from being played to the
other rectangle. The game is played for
two minutes. The defending team tries
to intercept the ball as often as possible.
The teams are then changed.
Variations
• Number of touches
• Can also be played with three teams of
eight players each
Comments
• Coaches play a new ball into the
vacant rectangle whenever the ball
goes out.
• Coaches keep track of how often the
attacking teams lose the ball.
[email protected] 06 Aug 2018
FITNESS IN SOCCER
High-intensity interval training
104
6.9.4 Short interval and repetition exercises
Explanation
The game is started by one of the coa-
ches who centers to the GK, who then
launches the counter-attack. The game
is played 4v2 or 4v3, depending on the
progression. The players are given a
limited amount of time to score.
Comments
Defenders can score in the other goal
when they recover the ball.
Progression
Groups of four attackers and two or
three defenders.
[email protected] 06 Aug 2018
FITNESS IN SOCCER
High-intensity interval training
105
SUMMARY
High-Intensity Interval Training is a time efficient and very effective way of
improving a football player’s anaerobic and aerobic fitness levels. Training drills
with or without the ball can be both used, but as much training should be per-
formed with the ball as possible. Therefore, SSGs are an excellent choice of drill
to improve a player’s physical abilities. The coach has to remember that factors
such as pitch size, number of players, rules, and coach encouragement can all
affect the intensity of SSG play. Soccer players with very high levels of fitness
may benefit from the addition of individualized generic running drills to their
training program. Performing 4 x 4 min intervals at 90-95% of HR
max using the
Hoff track is a useful drill to use in addition to SSG play. Although perhaps less
motivating for players to perform, it is easier to control the intensity of generic
running drills, making it easier to individualize training. Using a combination
of SSG play and generic running drills during a high-intensity interval training
session is suggested as an optimal way of improving the anaerobic and aerobic
fitness of soccer players. It seems important that high-intensity interval training
that raises the HR to above 90% of HR
max should constitute at least 8 to 10% of
the total weekly training plan for elite soccer players during the preseason and
in-season periods.
REFERENCES
•
Acton-Jacobs, R., Fluck, D., Bonne, T.C., Burgi, S., Christensen, P.M., Toigo, M. and Lundby, C., 2013. Improvements in exercise perfor-
mance with high-intensity interval training coincide with an increase in skeletal muscle mitochondrial content and function. Journal of
Applied Physiology.
•
Aguiar, M., Botelho, G., Lago, C. , Maças, V. and Sampaio, J., 2012. A Review on the Effects of Soccer Small-Sided Games. Journal of
Human Kinetics, 33, pp.103–113.
•
Aroso, J., Rebelo, N. and Gomes-Pereira, J., 2004. Physiological impact of selected game-related exercises. Journal of Sports Sciences,
22, p.522.
•
Balsom, P., 1999. Precision football. Kempele, Finland: Polar Electro Oy.
•
Billat, L.V., 2001. Interval Training for Performance: A Scientific and Empirical Practice: Special Recommendations for Middle- and
Long-Distance Running. Part II: Anaerobic Interval Training. Sports Medicine, 31(2), pp.75-90.
•
Bishop, D., Girard, O. and Mendez-Villanueva, A., 2011. Repeated-Sprint Ability – Part II Recommendations for Training. Sports Med,
41(9), pp.741-756.
•
Bogdanis, G.C., Stavrinou, P., Fatouros, I.G., Philippou, A., Chatzinikolaou, A., Draganidis, D., Ermidis, G. and Maridaki, M., 2013. Short-
term high-intensity interval exercise training attenuates oxidative stress responses and improves antioxidant status in health humans.
Food and Chemical Toxicology.
•
Bonen, A., 2001. The expression of lactate transporters (MCT1 and MCT4) in heart and muscle. Eur J Appl Physiol, 86(1), pp.6-11.
•
Boyd, C.J., Simpson, C.A., Jung, M.E. and Gurd, B.J., 2013. Reducing the intensity of interval training diminishes cardiovascular adapta-
tion but not mitochondrial biogenesis in overweight/obese men. PloS ONE, 8(7).
•
Brooks, GA., 1986. The lactate shuttle during exercise and recovery. Med Sci Sports Exerc, 18(3), pp.360-8.
•
Buchheit, M. and Laursen, P.B., 2013a. High-intensity interval training, solutions to the programming puzzle. Part 1: Cardiopulmonary
Emphasis. Sports Medicine, 43, pp.313-338.
•
Buchheit, M. and Laursen, P.B., 2013b. High-intensity interval training, solutions to the programming puzzle. Part 2: Anaerobic energy,
neuromuscular load, and practical applications. Sports Medicine, doi 10.1007/s40279-013-0066-5.
•
Burgomaster, K.A., et al, 2008. Similar metabolic adaptations during exercise after low volume sprint interval and traditional endurance
training in humans. Journal of Physiology, 586 (1), pp.151-160.
•
Casamichana, D. and Castellano, J., 2010. Time–motion, heart rate, perceptual and motor behaviour demands in small-sides soccer
games: Effects of pitch size. Journal of Sports Sciences, 28(14), pp.1615-1623.
•
Casamichana, D., Castellano, J. and Dellal, A., 2013. Influence of Different Training Regimes on Physical and Physiological Demands
During Small-Sided Soccer Games: Continuous Vs. Intermittent Format. Journal of Strength and Conditioning Research, 27(3),
pp.690-697.
•
Castagna, C., Impellizzeri, F.M., Chaouachi, A., Bordon, C. and Manzi, V., 2011. Effect of training intensity distribution on aerobic fitness
variables in elite soccer players: A case study. J Strength Cond Res, 25(1), pp.66–71.
•
Castagna, C., Impellizzeri, F.M., Chaouachi, A. and Manzi, V., 2013. Preseason variations in aerobic fitness and performance in elite-stan-
dard soccer players: a team study. J Strength Cond Res, 27(11), pp.2959-65.
•
Castellano, J., Casamichana, J. and Dellal, A., 2013. Influence of Game Format and Number of Players on Heart Rate Responses and
Physical Demands in Small-Sided Soccer Games. Journal of Strength and Conditioning Research, 27(5), pp.1295-1303.
•
Cicioni-Kolsky, D., Lorenzen, C., Williams, M.D. and Kemp, J.G., 2013. Endurance and sprint benefits of high-intensity and supramaxi-
mal interval training. European Journal of Sport Science, 13(3), pp.304-311.
•
Clemente, F., Couceiro, M.S., Martins, F.M.L. and Mendes, R., 2012. The usefulness of small-sided games on soccer training. Journal of
Physical Education and Sport, 12(1), Art 15, pp.93 – 102.
•
Daussin, F.N., Zoll, J., Dufour, S.P., Ponsot, E., Lonsdorfer-Wolf, E., Doutreleau, S., Mettauer, B., Piquard, F., Geny, B., Richard, R.,
2008. Effect of interval versus continuous training on cardiorespiratory and mitochondrial functions: relationship to aerobic perfor-
[email protected] 06 Aug 2018
FITNESS IN SOCCER
High-intensity interval training
106
mance improvements in sedentary subjects. American Journal of Physiology: Regulatory, Integrative and Comparative Physiology, 295,
pp.264-272.
•
Dellal, A., Chamari, K., Pintus, A., et al., 2008. Heart rate responses during small-sided games and short intermittent running training in
elite soccer players: a comparative study. J Strength Cond Res, 22(5), pp.1449-57.
•
Dellal, A., Jannault, R., Lopez-Segovia, M. and Pialoux, V., 2011a. Influence of the Numbers of Players in the Heart Rate Responses of
Youth Soccer Players within 2 vs. 2, 3 vs. 3 and 4 vs. 4 Small-sided Games. Journal of Human Kinetics, 28, pp.107-114.
•
Dellal, A., Chamari, K., Owen, A.L., Wong, D.P., Lago-Penas, C. and Hill-Haas, S., 2011b. Influence of technical instructions on the physio-
logical and physical demands of small-sided soccer games. European Journal of Sport Science, 11(5), pp.341-346.
•
Dellal, A., Hill-Haas, S., Lago-Penas, C. and Chamari, K., 2011c. Small- sided games in soccer: Amateur vs. professional players’ physio-
logical responses, physical, and technical activities. J Strength Cond Res, 25(9), pp.2371–2381.
•
Dellal, A., Owen, A., Wong, D.P., Krustrup, P., van Exsel, M. and Mallo, J., 2012a. Technical and physical demands of small vs. large sided
games in relation to playing position in elite soccer. Human Movement Science, 31, pp.957–969.
•
Dellal, A., Drust, B. and Lago-Penas, C., 2012b. Variation of Activity Demands in Small-Sided Soccer Games. International Journal of
Sports Medicine, 33, pp.370-375.
•
Duarte, R., Batalha, N., Folgado, H. and Sampaio, J., 2009. Effects of exercise duration and number of players in heart rate responses and
technical skills during Futsal small-sided games. Open Sports Sci J, 2, pp.37-41.
•
Enoka, R.M. and Duchateau, J., 2008. Muscle fatigue: what, why and how it influences muscle function. J Physiol, 586, pp.11–23.
•
Esfarjani F., Laursen P.B., 2007. Manipulating high-intensity interval training: effects on VO2max, the lactate threshold and 3000 m run-
ning performance in moderately trained males. J Sci Med Sport, 10, pp.27–35.
•
Fanchini, M., Azzalin, A., Castagna, C., Schena, F., McCall, A. and Impellizzeri, F.M., 2011. Effect of bout duration on exercise intensity
and technical performance of small-sided games in soccer. J Strength Cond Res, 25(2), pp.453–458.
•
Fradua, L., Zubillaga, A., Caro, Ó., Fernández-García, Á.I., Ruiz-Ruiz, A. and Tenga, A., 2013. Designing small-sided games for training
tactical aspects in soccer: Extrapolating pitch sizes from full-size professional matches. Journal of Sports Sciences, 31(6), pp.573-581.
•
Gabbett, T., 2001. Increasing training intensity in country rugby league players. Rugby League Coaching Magazine, 20, pp.30-31.
•
Gabbett, T.J. and Mulvey, M.J., 2008. Time–motion analysis of small-sided training games and competition in elite women soccer players.
Journal of Strength and Conditioning Research, 22, pp.543–552.
•
Gamble, P.A., 2004. Skill-based conditioning games approach to metabolic conditioning for elite rugby soccer players. J Stren Cond Res,
18, pp.491–497.
•
Gibala, M., Little, J., van Essen, M., Wilkin, G., Burgomaster, K., Safdar, A., Raha, S. and Tarnopolsky, M., 2006. Short-term sprint interval
versus traditional endurance training: similar initial adaptations in human skeletal muscle and exercise performance. J Physiol, 575(3),
pp.901-911.
•
Gibala, M., 2009. Molecular responses to high-intensity interval exercise. Applied Physiology, Nutrition, and Metabolism, 34(3),
pp.428-32.
•
Gibala, M.J., Little, J.P., MacDonald, M.J. and Hawley, J.A., 2012. Physiological adaptations to low-volume, high-intensity interval trai-
ning in health and disease. J Physiol, 590(5), pp.1077–1084.
•
Gregson, W. and Drust, B., 2000. The physiology of football drills. In-sight, 3(4), pp.1-2.
•
Hafstad, A.D., Boardman, N.T., Lund, J., Hagve, M., Khalid, A.M., Wisløff, U., Larsen, T.S., Aasum, E., 2011. High intensity interval trai-
ning alters substrate utilization and reduces oxygen consumption in the heart. J Appl Physiol., 111(5), pp.1235-41.
•
Halestrap, A.P. and Meredith, D., 2004. The SLC16 gene family-from monocarboxylate transporters (MCTs) to aromatic amino acid trans-
porters and beyond. Pflugers Arch, 447, pp.619–628.
•
Helgerud, J., Høydal, K., Wang, E., Karlsen, T., Berg, P., Bjerkaas, M. and Hoff, J., 2007. Aerobic High-Intensity Intervals Improve VO2max
More Than Moderate Training. Medicine & Science in Sports & Exercise, 39(4), pp.665-671.
•
Helsen, W., Starkes, J. and Hodges, N., 1998. Team sports and the theory of deliberate practice. Journal of Sport and Exercise Psychology,
20, pp.12–34.
•
Hill-Haas, S.V., Dawson, B.T., Coutts, A.J. and Rowsell, G.J., 2009a. Physiological responses and time–motion characteristics of various
small-sided soccer games in youth players. Journal of Sports Sciences, 27(1), pp.1-8.
•
Hill-Haas, S.V., Rowsell, G.J., Dawson, B.T. and Coutts, A.J., 2009b. Acute physiological responses and time-motion characteristics of two
small-sided training regimes in youth soccer players. J Strength Cond Res, 23(1), pp.111–115.
•
Hill-Haas, S.V., Coutts, A.J., Dawson, B.T. and Rowsell, G.J., 2010. Time-motion characteristics and physiological responses of small-
sided games in elite youth players: The influence of player number and rule changes. J Strength Cond Res, 24(8), pp.2149– 2156.
•
Hill-Haas, S.V., Dawson, B.T., Impellizzeri, F.M. and Coutts, A.J., 2011. Physiology of Small-Sided Games Training in Football: A Syste-
matic Review. Sports Med, 41(3), pp.199-220.
•
Hoff, J., Wisloff, U., Engen, L.C., Kemi, O.J., and Helgerud J., 2002. Soccer specific aerobic endurance training. Br J Sports Med, 36,
pp.218-21.
•
Hoff, J. and Helgerud, J., 2004. Endurance and strength training for soccer players. Physiological considerations: A review. Sports Med,
34, pp.165–180. Hodges, N. and Starkes, J., 1996. Wrestling with the nature of expertise: A sport-specific test of Ericsson, Krampe and
Tesch-Romer’s (1993) theory of deliberate practice. International Journal of Sport Psychology, 27, pp.400–424.
•
Impellizzeri, F.M., Rampinini, E. and Marcora, S.M., 2005. Physiological assessment of aerobic training in soccer. J Sports Sci, 23(6),
pp.583-92.
•
Ingham, S.A., Carter, H., Whyte, G.P. and Doust, J.H., 2008. Physiological and performance effects of low- versus mixed-intensity rowing
training. Med Sci Sports Exerc, 40, pp.579–584.
•
Jenkins, S.P.R., 2005. Sports science handbook: the essential guide to kinesiology, sport and exercise science. Volume 2. Essex: Multi-sci-
ence publishing.
•
Jones, S. and Drust, B., 2007. Physiological and technical demands of 4 v 4 and 8 v 8 games in elite youth soccer players. Kinesiology,
39(2), pp.150-6.
•
Kaplan, T., Erkmen, N. and Taskin, N., 2009. The evaluation of the running speed and agility performance in professional and amateur
soccer players. J Strength Cond Res, 23, pp.774–778.
•
Katis, A. and Kellis, E., 2009. Effects of small-sided games on physical conditioning and performance in young soccer players. J Sports
Med, 8, pp.374-80.
•
Kelly, D.M. and Drust, B., 2009. The effect of pitch dimensions on heart rate responses and technical demands of small-sided soccer
games in elite players. J Sci Med Sport, 12(4), pp.475-9.
•
Köklü, Y., Aşçı, A., Koçak, F.Ü., Alemdaroğlu, U. and Dundar, U., 2011. Comparison of the physiological responses to different small-si-
ded games in elite young soccer players. J Strength Cond Res, 25, pp.1522-1528.
•
Köklü, Y., Sert, Ö., Alemdaroğlu, U. and Arslan, Y., 2013. Comparison of the Physiological Responses and Time Motion Characteristics
of Young Soccer Players in Small Sided Games: The Effect of Goalkeeper. Journal of Strength and Conditioning Research, Published
Ahead of Print.
•
Kubukeli, Slohrdal Starke et al., 2002. Training techniques to improve endurance exercise performances. Sports Med, 32, pp.489-509.
•
Laursen, P.B., 2010. Training for intense exercise performance: high-intensity or high-volume training? Scandinavian Journal of Medicine
& Science in Sports, pp.201-10.
•
Laursen, P.B. and Jenkins, D.G., 2002. The Scientific Basis for High-Intensity Interval Training: Optimising Training Programmes and
Maximising Performance in Highly Trained Endurance Athletes. Sports Medicine, 32(1), pp.53-73.
•
Little, T. and Williams, A.G., 2006. Suitability of soccer training drills for endurance training. J Strength Cond Res, 20(2), pp.316-9.
•
Little, T., 2009. Optimizing the use of soccer drills for physiological development. Strength Cond J, 31(3), pp.1-8.
•
Little, J., Safdar, A., Wilkin, G., Tarnopolsky, M. and Gibala, M., 2010. A practical model of low-volume high-intensity interval training
induces mitochondrial biogenesis in human skeletal muscle: potential mechanisms. Journal of Physiology, 588(6), pp.1011–1022.
•
Londeree, B.R., 1997. Effect of training on lactate/ventilatory thresholds: a meta-analysis. Med Sci Sports Exerc, 29, pp.837–843.
•
McMillan, K., Helgerud, J., Macdonald, R. and Hoff, J., 2005. Physiological adaptations to soccer-specific endurance training in professi-
onal youth soccer players. Br J Sports Med, 39, pp.273–277.
[email protected] 06 Aug 2018
FITNESS IN SOCCER
High-intensity interval training
107
•
Mallo, J. and Navarro, E., 2008. Physical load imposed on soccer players during small-sided training games. J Sports Med Phys Fitness,
48, pp.166–171.
•
Moholdt, T., Madssen, E., Rognmo, O. and Aamot, I.L., 2013. The higher the better? Interval training intensity in coronary heart disease.
Journal of Science and Medicine in Sport, doi.org/10.1016/j.jsams.2013.07.007
•
Owen, A., 2003. Physiological and technical analysis of small-sided conditioned training games within professional football. Wrexham:
SAGE Publications.
•
Owen, A., Twist, C. and Ford, P., 2004. Small-sided games: the physiological and technical effect of altering pitch size and player num-
bers. Insight FACA J, 7(2), pp.50-3.
•
Paton, C.D. and Hopkins, W.G, 2004. Effects of High-intensity Training on Performance and Physiology of Endurance Athletes. Sport
science, 8, pp.25–40.
•
Rampinini, E., Impellizzeri, F.M., Castagna, C., Abt, G., Chamari, K., Sassi, A. and Marcora, S.M., 2007. Factors influencing physiological
responses to small-sided soccer games. J Sports Sci, 25(6), pp.659-66.
•
Rampinini, E., Sassi, A., Morelli, A., Mazzoni, S., Fanchini, M., Coutts, A.J., 2010. Repeated-sprint ability in professional and amateur
soccer players. Appl Physiol Nutr Metab; 34, pp.1048-54.
•
Reilly, T. and Ball, D., 1984. The net physiological cost of dribbling a soccer ball. Res Q Exerc Sport, 55, pp.267-71.
•
Sampaio, J., Garcia, G., Macas, V., Ibanez, J., Abrantes, C. and Caixinha, P., 2007. Heart rate and perceptual responses to 2x2 and 3x3
small-sided youth soccer games. Journal of Sports Science and Medicine, 6(10), pp.121–122.
•
Sassi, R., Reilly, T. and Impellizzeri, F.M., 2004. A comparison of small-sided games and interval training in elite professional soccer
players. J Sports Sci, 22, p.562.
•
Sears, S., 2001. Running Through the Ages. Jefferson, NC: McFarland and Company Inc.
•
Seiler, K.S. and Kjerland, G.Ø., 2006. Quantifying training intensity distribution in elite endurance athletes: is there evidence for an ‘‘opti-
mal’’ distribution? Scand J Med Sci Sports, 16, pp.49–56.
•
Singer, R. and Janelle, C.M., 1999. Determining sport expertise: From genes to supremes. International Journal of Sport Psychology, 30,
pp.117–150.
•
Slørdahl, S.A., Madslien, V.O., Støylen, A., Kjos, A., Helgerud, J. and Wisløff U., 2004. Atrioventricular plane displacement in untrained
and trained females. Medicine & Science in Sports & Exercise, 36(11), pp.1871-1875.
•
Smith, D.J., 2003. A Framework for Understanding the Training Process Leading to Elite Performance. Sports Medicine, 33(15),
pp.1103-1126.
•
Stone, N.M. and Kilding, A.E., 2009. Aerobic Conditioning for Team Sport Athletes. Sports Med, 39(8), pp.615–642.
•
Talanian, J.L., Galloway, S.D., Heigenhauser, G.J., Bonen, A. and Spriet, L.L., 2007. Two weeks of high-intensity aerobic interval training
increases the capacity for fat oxidation during exercise in women. Journal of Applied Physiology, 102(4), pp.1439-1447.
•
Tessitore, A., Meeusen, R., Piacentini, M.F., Demarie, S. and Capranica, L., 2006. Physiological and technical aspects of ‘‘6- a-side’’ soccer
drills. Journal of Sports Medicine and Physical Fitness, 46, pp.36–43.
•
Tjonna, A.E., Leinan, I.M., Bartnes, A.T., Jennsen, B.M., Bibala, M.J., Winett, R.A. and Wisloff, U., 2013. Low- and high-volume of inten-
sive endurance training significantly improves maximal oxygen uptake after 10-weeks of training in healthy men. PloS ONE, 8(5):
e65382. doi:10.1371/journal.pone.0065382.
•
Ullah, M.S., Davies, A.J. and Halestrap, A.P., 2006. The plasma membrane lactate transporter MCT4, but not MCT1, is up-regulated by
hypoxia through a HIF-1alpha-dependent mechanism. J. Biol. Chem, 281, pp.9030-9037.
•
Wenger, H.A. and Bell, G.J., 1986. The interaction of intensity, frequency and duration of exercise training in altering cardiorespiratory
fitness. Sports Med, 3(5), pp.346-5.
•
Williams, K. and Owen, A., 2007. The impact of player numbers on the physiological responses to small sided games. J Sports Sci Med,
6(10), p.100.
•
Wisløff, U., Ellingsen, Ø. and Kemi, O.J., 2009. High-intensity interval training to maximize cardiac benefits of exercise training? Exercise
Sport Science Review, 37(3), pp.139-146.
•
Zuniga, J.M., Berg, K., Noble, J., Harder, J., Chaffin, M.E. and Hanumanthu, V.S., 2011. Physiological responses during interval training
with different intensities and duration of exercise. J Strength Cond Res, 25(5), pp.1279-84.
[email protected] 06 Aug 2018
1os
I FITNESS IN SOCCER
High-intensity interval training
[email protected] 06 Aug 2018
FITNESS IN SOCCER
Speed, agility and quickness (SAQ) and repeated sprint ability (RSA)
109
7
SPEED, AGILITY AND QUICKNESS
(SAQ) AND REPEATED
SPRINT ABILITY (RSA)
Jan Van Winckel, Nick Winkelman, Renaldo Landburg, Paul Bradley
7.1 INTRODUCTION
Although most of a game is played at low intensity, many high-intensity actions are
also involved, such as sprinting, jumping, turning and tackling. Around 2% of the
total distance covered during a match is sprinting, while another 10% of the total
distance covered is from high-intensity running. This equates to a 10–15m sprint
every 90 seconds (Bangsbo, 2006). Most of these sprints are short bouts of exertion
(< 15m). Straight-line sprinting is the most frequently occurring action prior to a
goal, for both the scoring and assisting players. Professional players have become
faster over time, indicating that sprinting ability is becoming more and more
important in modern soccer (Haugen et al., 2013). In a recent study, Andrzejewski
et al. (2013) conducted a detailed analysis of the sprinting activity of professional
soccer players during the 2008–09 and 2010–11 UEFA Europa League seasons. The
study demonstrated that the mean total sprint distance covered by players (>=24
km/h) amounted to 237m ± 123m. In terms of the position of play, forwards cove-
red the longest sprint distance (345m ± 129m), which was 9% further than midfiel-
ders (313m ± 119m) and more than twice that of central midfielders (167m ± 87m).
The average number of sprints performed by the soccer players was 11 ± 5. Another
notable fact was that 90% of sprints performed by professional soccer players were
shorter than five seconds, while only 10% lasted longer than five seconds.
[email protected] 06 Aug 2018
FITNESS IN SOCCER
Speed, agility and quickness (SAQ) and repeated sprint ability (RSA)
110
7.2 NATURE OR NURTURE
Speed is partly innate. Each individual has a unique blueprint by which their neuro-
muscular system is expressed within the human body. These individual differences
can allow one individual to run faster, while another may be more inclined to run
farther. Although it seems that speed is partly innate, deliberate practice plays an
important role in the development of talent. Balyi (2004) described a potential win-
dow of trainability that seems to exist. Young athletes should train speed at critical
moments in order to maximize genetic potential. Strength and power programs
have been shown to improve speed, with superior running mechanics affecting the
development of speed significantly. Sander et al. (2013) investigated the influence
of a two-year strength training program on power performance in elite youth soc-
cer players. The players who completed the strength training program displayed
significantly better improvements in sprinting (up to 6%) when compared to the
control group. The researchers suggest that it seems beneficial for youth players
to perform strength training to exploit the reserve capacity in sprint performances.
Similar to this, Comfort et al. (2013) examined the association between strength and
sprint performance. The researchers concluded that leg strength is closely related
to both sprint and jump performance in well-trained players. Finally, they stressed
the importance of using squat exercises as part of a periodized training program.
7.3 BIOMECHANICS OF SPRINTING
7.3.1 Stride length and stride frequency
Speed is simply the product of the frequency (Freq) and length (L) of a runner’s
steps.
Speed = L step . Freq step
Sprinters achieve faster top speeds not by swinging their limbs more rapidly in
the air, but by applying greater forces to the ground. How fast an athlete runs is
determined during contact with the ground. Both the greater stride lengths and
frequencies of faster runners result from the application of greater mass-specific
ground forces in shorter periods of time. Lockie et al. (2013) investigated stance
kinetics and step kinematics. Their results indicated that faster acceleration in field
sport athletes involved longer steps with shorter contact time. Greater vertical force
production was linked with shorter contact time, illustrating efficient force produc-
tion. Greater step lengths during acceleration were facilitated by higher vertical
impulses and appropriate horizontal force. The researchers concluded that speed
training for team sport players should be customized to encourage these technique
adaptations.
7.3.2 Arm swinging
Humans walk with a moderate step width (+/-12 cm), which guarantees balance
and minimizes energetic cost (Donelan et al., 2001). Conversely, humans run with
a step width of almost zero. This jeopardizes balance and requires a greater ener-
getic cost. While running, arm swings support the lateral balance and reduce the
[email protected] 06 Aug 2018
FITNESS IN SOCCER
Speed, agility and quickness (SAQ) and repeated sprint ability (RSA)
111
energetic cost. When running without arm swings, the net metabolic power demand
increases by 8% when compared to running with arm swings. Once a runner is up
to speed, the arms swing largely like passive pendulums. Pontzer et al. (2009) sup-
ports a passive arm swing hypothesis for upper-body movement. During human
walking and running—in which the trunk and shoulders act primarily as elastic
linkages between the pelvis, shoulder girdle and arms—the arms act as passive
mass dampers, reducing torso and head rotation, and the upper-body movement
is primarily powered by the lower-body movement. Although arm movements do
not control leg movements and have very little effect on the all-important ground
reaction forces, the arms and legs need each other to achieve proper running form.
7.3.3 Muscle actions
Running gait can be divided into two phases with regard to the lower extremity:
the stance phase and swing phase (Nicola et al., 2012). These can be further divided
into absorption (foot strike), propulsion, initial swing and terminal swing.
Fig. 7.1: Absorption (foot strike), propulsion, initial swing and terminal swing.
• Swing phase. At the end of the stance phase, when the foot has straightened
out and left the ground, the hip, knee and foot are stretched. The glutei and
the hamstrings are used to stretch the hip, while the calf muscles cause the foot
to stretch. The iliopsoas muscle (the muscle that bends the hip) then comes
into action to move the lead leg forward. The hamstrings ensure the bending
(flexion) of the knee, and the tibialis anterior (the muscle above the shinbone)
causes the foot to bend (dorsal flexion). The adductors work to prevent the
thigh from turning outwards. Finally, the knee extends through the action of
the quadriceps to prepare the body for landing.
• Stance phase. When running, the large muscle groups work eccentrically to
prevent the runner from sagging at any of his joints by counteracting flexion of
the ankle, flexion of the knee and flexion of the hip. When landing, the glutei
pull in order to stretch the hip. The antagonists of the thigh, the hamstrings
and quadriceps, work mainly to stabilize the knee and control the movement.
The antagonists also work together in the lower leg to allow the foot to straigh-
ten in a controlled manner. The tibialis anterior at the front of the tibia works
eccentrically, while the calf muscle (gastrocnemius) works concentrically. No
more muscle activity can be undertaken to push the body forward in this sup-
port phase because the center of gravity is behind the point of support. It is
the movement of the body that ensures it is carried over this point of support.
[email protected] 06 Aug 2018
FITNESS IN SOCCER
Speed, agility and quickness (SAQ) and repeated sprint ability (RSA)
112
7.4 RUNNING TECHNIQUE
The running motion we are familiar with from the world of athletics cannot be
fully applied to soccer. The shortest sprint distance in athletics, the 100m, is more
than three times longer than the longest typical sprint covered by a player during
a match. The expression of speed is relative to the absolute distance and the pha-
ses leading to the final distance. Fast people, whether on a field or on a track, will
adopt similar running forms based on the distance. Soccer involves cutting, turn-
ing, changing direction, falling, jumping, stopping, accelerating and various other
basic forms of movement. A player must always have as much contact as possible
with the ground in order to be able to anticipate changing situations.
The following are specific to soccer:
• The distance is very short, which means that the support point is mainly
behind the body. The quadriceps and calf muscles, as well as the glutei and
the lower-back muscles, therefore push on this support point. This movement
is similar to track athletes over the first 15m.
• A soccer player should be able to change direction quickly. A high heel or
knee lift will make the swing phase too long and therefore compromise a swift
change of direction.
• Soccer players do not run around bends, like on a track, but rather turn at
sharp angles.
• Sprint distances in soccer are very short, meaning that stride length needs to
be restricted. For this reason, stride frequency is more important and must the-
refore increase greatly over the first few meters. However, coaches should be
cautious when trying to artificially influence stride frequency, because it could
threaten an athlete’s natural running flow.
• Cross-coordination (opposite arm/leg) is not always possible in practical
terms because of different arm movements, such as holding off an opponent.
• The start of the movement does not only go in a forward direction but rather
from all angles and positions, such as crossovers, side stepping, landing from
a jump, accelerating away, and so on.
Soccer players therefore have to train especially on short, fast running actions, and
these can be combined with a good stretch reflex and a high stride frequency.
7.5 SPEED, AGILITY, QUICKNESS AND CUTTING
Straight-sprint training appears to have little or no influence on the improvement
of sprinting that involves changes of direction (Young et al., 2001), and this was
confirmed by Tsitskarsis et al. (2003). These researchers found a weak relationship
between straight-sprint performance and speed performance when changes of
direction are involved. In an interesting investigation by Little and Williams (2005),
the specificity of acceleration, maximum speed, and agility in professional soccer
players was examined. Although the performances in the three tests were all signi-
ficantly correlated, the coefficients of determination (R2) between the tests were just
39, 12, and 21% for acceleration and maximum speed, acceleration and agility, and
maximum speed and agility, respectively. The investigators concluded that accele-
ration, maximum speed, and agility are specific qualities and relatively unrelated
to one another. They therefore suggested the use of specific testing and training
procedures for each speed component when working with elite players.
[email protected] 06 Aug 2018
FITNESS IN SOCCER
Speed, agility and quickness (SAQ) and repeated sprint ability (RSA)
113
7.6 DEFINITIONS
Agility and change of direction (COD): An agility task may be best described as a
rapid, whole-body change of direction or speed in response to a stimulus (Shep-
pard and Young, 2006). Other attempts to define agility have focused on the physi-
cal demands only, generally a change of direction involving the whole body, as
well as rapid movement and direction change of limbs (Tsitskarsis et al., 2003). The
unique distinction between the definition used by Sheppard and Young (2006) and
other previous definitions is the inclusion of reaction to a stimulus, rather than just
change-of-direction speed (COD). Agility is an open skill, while COD is a closed
skill (Sheppard and Young, 2011).
Quickness: Moreno (1995) identified quickness as “a multi-planar or multi-directi-
onal skill that combines acceleration, explosiveness, and reactiveness.” Quickness
can be defined by the speed of agility or COD over short distances.
Cutting: Unlike the term quickness, cutting seemingly refers only to the specific
portion of a directional change when the athlete’s foot touches the ground to initi-
ate the change of direction (Sheppard and Young, 2006).
7.7 SOCCER-SPECIFIC SAQ DRILLS
SAQ is the harmonious and economical cooperation of the senses, nerves and
muscles to produce a specific, controlled movement and a rapid situation-specific
reflex. This requires the entire locomotor apparatus to work together in a coordina-
ted way in the following areas:
• speed of execution
• angle of movement
• direction of movement
• activation and deactivation of synergists and antagonists
• muscle tension
• number of motor units recruited
Speed, agility and quickness are critical for success in soccer. SAQ-specific exercises
in soccer therefore have to be directed toward the following objectives:
• Making SAQ exercises dependent on visual stimuli: Instead of training with
a whistle, drop a ball, for example, when the players are supposed to take off.
• Break up rhythms: A sprint in soccer is characterized by accelerations and
changes in direction.
• Fast foot contacts and soccer-specific activities.
• Link a coordination exercise with an activity specific to soccer, such as by orga-
nizing a passing or finishing exercise after a sprinting activity.
[email protected] 06 Aug 2018
FITNESS IN SOCCER
Speed, agility and quickness (SAQ) and repeated sprint ability (RSA)
114
7.7.1 Effectiveness of SAQ sessions
Young and Rogers (2013) examined the effect of two different training methods on
planned and reactive agility tests. Twenty-five young adult Australian Rules foot-
ball players (U18) were randomly assigned to two training groups:
1. The change of direction group
2. The small-sided game group
Players participated in one or two 15-minute sessions per week, with 11 sessions
being conducted over a 7-week period during the season. A planned AFL agility
test and a video-based reactive agility test were performed before and after inter-
vention. The small-sided games group improved total time in the reactive agility
test (P = 0.008, effect size = 0.93) and this was entirely due to a very large reduc-
tion in decision time. Meanwhile, the change-of-direction training produced small
to trivial changes in all of the test variables. In another study by Jovanovic et al.
(2011), the effects of SAQ training methods on power performance in soccer play-
ers were investigated. The SAQ training program appears to be an effective way
of improving some areas of power performance in young soccer players during
the in-season period. Soccer coaches could use this information in the process of
planning in-season training. Without proper planning of SAQ training, soccer
players will most likely be confronted with decreased power performance. Finally,
Bloomfield et al. (2003) compared the effectiveness of two methodologies for speed
and agility conditioning for random-, intermittent-, and dynamic-activity sports
like soccer and investigated the necessity of specialized coaching equipment. Two
groups participated in either a programmed method (PC) or a random method
(RC) of conditioning, with a third group receiving no conditioning (NC). The PC
participants used the SAQ conditioning method, while the RC participants played
supervised small-sided soccer games. The PC group was also subdivided into two
subgroups, where participants either
used specialized SAQ equipment or
no equipment. PC in the form of SAQ
exercises was found to be a superior
method for improving speed and agi-
lity parameters, and this study found
that specialized SAQ equipment was
not a requirement to observe signifi-
cant improvements. In addition, the
authors recommended the presence
of a fitness specialist in speed and
agility conditioning to lead, direct,
and control PC, particularly the spe-
cificity and overload. This appears
to be more beneficial than the lais-
sez-faire approach of RC when trying
to improve aspects like speed, power,
and agility.
[email protected] 06 Aug 2018
FITNESS IN SOCCER
Speed, agility and quickness (SAQ) and repeated sprint ability (RSA)
115
7.8 SPEED
Speed comprises a number of different components:
1. Reaction/starting speed: The first three or four strides
2. Acceleration: 10–20m
3. Speed endurance: 60–70m
4. Repeated sprint ability: Repeated sprints sometimes with little recovery time in
between.
7.8.1 Reaction speed
Seen in neuro-physiological terms, reaction speed is the time interval during which
the nerve impulses are conducted to the brain, where they are processed and then
sent to the respective muscles. The reaction speed is determined by various factors,
including age and gender. Although it has already been proven in the past that
sprinters react more quickly than long-distance runners, no differences were found
in the reaction time between different skill groups. Professional soccer players do
not have a quicker reaction speed than amateur players. The best-known exam-
ple of this is the boxer Mohammed Ali, who had a very slow visual reaction time
(190msec), yet he is one of the best boxers of all time because of his ability to antici-
pate more quickly than others.
7.8.2 Starting speed
The energy for this type of exertion is supplied by the ATP still present in the mus-
cles. ATP is always found in the cell, although it can fall to 40%, while CP (creatine
phosphate) can be exhausted.
• Duration: One or two seconds
• Intensity: 100%
• Repetition: 8–10
• Work-rest ratio: 1:10
7.8.3 Acceleration
• Duration: 2–6 seconds
• Intensity: Building up to 100%
• Repetition: 4–6
• Work-rest ratio: 1:10
Varley et al. (2013) compared the match activity profiles of elite players from Aus-
tralian Rules football (AF), rugby league (RL) and soccer (SOC) using identical
movement definitions. Rugby league players undertook the highest relative num-
ber of accelerations (1.10 ± 0.56 per min). Repeated sprint bouts were rare for all
codes. RL and SOC players performed less running than AF players, possibly due
to limited open space because of field size and code-specific rules.
7.8.4 Speed endurance
• Duration: 6–10 seconds
• Intensity: Building up to 100%
• Repetition: 4–6
• Work-rest ratio: 1:6
[email protected] 06 Aug 2018
FITNESS IN SOCCER
Speed, agility and quickness (SAQ) and repeated sprint ability (RSA)
116
7.8.5 Repeated sprint ability (RSA)
We have already discussed how the ability to repeatedly perform short-duration,
high-intensity, intermittent exercise bouts with relatively short recovery times (e.g.,
repeated sprint ability or RSA) is an important attribute of the modern-day soc-
cer player. The mean time recorded during an RSA test predicts the amount of
high-intensity running and the total sprint distance covered during a professional
soccer match (Rampinini et al., 2007), and this finding suggests that improving RSA
should result in greater physical performance in team sports (Bishop et al., 2011). It
has been suggested that the ability to resynthesize phosphocreatine (PCr) may be
an important determinant of the ability to reproduce sprint performance (Bishop
et al., 2011). A short recovery time between repeated sprints leads to only a partial
restoration of PCr stores (Bogdanis et al., 1996). Importantly, Haseler et al. (1999)
demonstrated that PCr restoration is limited by O
2 availability. This suggests that
individuals with an elevated aerobic fitness should be able to more rapidly resyn-
thesize PCr between repeated sprints (Bishop and Spencer, 2010; Rampinini et al.,
2010; Bishop et al., 2011). Indeed, high-intensity interval training (HIIT: 6–12 reps [2
minutes at ~100% VO
2max: 1 minute rest]), can significantly improve the resynthesis
of phosphocreatine during the first 60 seconds after high-intensity exercise (Bishop
et al., 2008).
Sloth et al. (2013) reviewed the effects of sprint interval (repeated sprint ability)
training. All 19 studies in their review used consistent training methods. The trai-
ning sessions included 3–7 30m maximal sprints with 2–5 minutes recovery.
They found that high-intensity sprint interval training improves fitness or VO
2max
(maximal oxygen consumption) by 4–13%. Compared to traditional endurance
training (long, slow distance runs—Steinhofer terminology), the improvements in
aerobic fitness were almost equal. Moreover, a small improvement in running eco-
nomy was found, meaning that players used less energy for the same load. Finally,
sprint interval training also improved anaerobic fitness and resistance to short-
term fatigue, thus improving repeated sprint ability.
Perroni et al. (2013) investigated the effect of eight weeks of preseason training on
RSA in soccer players. An RSA test, consisting of 7 × 30m sprints with 25 seconds
of active rest, was administered to the players, before and after the eight weeks of
preseason soccer training. An overall significant difference was found between the
seven sprints performed pre- and post-training. The study shows that each sprint
time was significantly faster in the pre- than in the post-RSA tests. Dellal and Wong
del (2013) compared the performance in RSA and repeated COD among elite soc-
cer players in different age categories. The researchers discovered that the RSA and
repeated COD are dependent on age, so coaches should therefore plan a specific
program differentiating RSA and repeated COD, while the individualized training
could begin at U17.
Bishop et al. (2011) gave two key recommendations based on the existing literature:
1. It is important to include some training to improve single-sprint performance.
This should include (i) specific sprint training, (ii) strength/power training, and
(iii) occasional high-intensity (>VO
2max) training (e.g., repeated, 30-second, all-
out efforts separated by ~10 minutes of recovery) to increase anaerobic capacity.
[email protected] 06 Aug 2018
FITNESS IN SOCCER
Speed, agility and quickness (SAQ) and repeated sprint ability (RSA)
117
2. It is also important to include some interval training to better improve the ability
to recover between sprints (if the goal is to improve fatigue resistance). High-in-
tensity (80–90% of VO
2max) interval training, interspersed with rest periods (e.g.,
one minute) that are shorter than the work periods (e.g., two minutes) efficiently
improves the ability to recover between sprints by increasing aerobic fitness
(VO
2max and the lactate threshold), the rate of PCr resynthesis, and buffering
capacity.
• Duration: Varying from 1–6 seconds per sprint
• Intensity: Building up to 100%
• Repetitions: 5–10 sprints in one set
• Work-rest ratio: 1:2 between different sets of sprint exercises
7.9 TIPS
• SAQ training can be completed at the beginning or end of the session or as
part of a warm up.
• All aspects of speed (e.g., agility, change of direction, quickness, and cutting)
should be at least maintained in every microcycle.
• Take into account the mechanical load while training agility, quickness, and
cutting. These kinds of training sessions have limited impact (in cases of ade-
quate recovery) on the physiological load, but they can have a considerable
mechanical load.
• Try to integrate your sessions with the technical/tactical objectives of training,
but ensure this doesn’t compromise the quality of execution.
• Respect work-rest ratios when developing speed.
• Warm up properly before doing SAQ training.
• Don’t do static stretching before SAQ training (This is discussed in more detail
in Chapter 19).
• Power, RSA and resistance (plyometrics) training can be performed on the
field, but this should be done intelligently as part of a periodized plan and
only then in the loading phase of the microcycle.
[email protected] 06 Aug 2018
FITNESS IN SOCCER
Speed, agility and quickness (SAQ) and repeated sprint ability (RSA)
118
7.10 EXERCISES
Explanation
Two teams are formed next to the goal.
X1 plays the ball to X2 and immedia-
tely sprints around the flag. X2 takes
the ball and tries to score from outside
the penalty box with a maximum of two
touches. X1 then receives the ball from
the following player.
Variation
X1 plays the ball to X2. X2 passes to X1.
X1 plays to X3. X2 then receives the ball
from X4. (See figure)
Comment
The coach plays a new ball in if the ball
goes out.
Advancing
The players stay on the same side each time,
with each player kicking six times before being
changed.
Explanation
Player X1 crosses to X4, who then sprints
to the position for goal. X4 finishes and
immediately sprints out of the 16-meter
box. He then takes the place of X1, who
then runs behind the goal to position X2.
Comment
Emphasis on the sprint action and imme-
diate sprint after finishing.
Advancing
X4 – X1 – X2 – X3 – X4
[email protected] 06 Aug 2018
FITNESS IN SOCCER
Speed, agility and quickness (SAQ) and repeated sprint ability (RSA)
119
Explanation
Players do a passing/finishing exercise
with starting, acceleration, or maximal
speed incorporated. X1 plays to X2, who
then plays back to X1. X1 plays the ball
deep, and X2 sprints toward the cone
and crosses the ball. X3, X4, X5 and X6
sprint toward the box and finish the
cross. Make two groups who work x
times left and x times right and make a
competition out of this play. X1 goes to
X2, and X2 goes to X1 (they stay at the
same two positions at both sides of the
exercise). X3, X4, X5 and X6 can go one
position to the right each time.
Variation
• Coach can emphasize different run-
ning lines toward the goal.
• Adapt distances and maybe the work-
rest ratio for different kinds of speed
training.
Comment
Assistant coach keeps track of the scored goals.
Advancing
You can do the exercise position specific.
Explanation
Both players set off when the signal is
given by the coach (by dropping the
ball from his hands, a visual signal). The
players run the course discussed before-
hand. The first player to run between the
flags gets a point.
Variation
The course can be altered using the same
cones.
Comment
Let the players count the points themsel-
ves and give the loser an additional task.
In the event of a tie, they both lose.
Advancing
The players change places each time.
[email protected] 06 Aug 2018
FITNESS IN SOCCER
Speed, agility and quickness (SAQ) and repeated sprint ability (RSA)
120
Explanation
Both players set off when the signal is
given by the coach (by dropping the
ball from his hands, a visual signal). The
players run the course discussed befo-
rehand. On reaching the ball, they try
to score in the small goals. Scoring gets
them one point. The first player to run
between the flags also gets a point.
Comment
Let the players count the points themsel-
ves and give the loser an additional task.
In the event of a tie, they both lose.
Advancing
The players change places each time.
When the player gets back, he takes the
ball he has kicked and replaces it ready
for the next player.
Explanation
Player X1 plays a long ball to player X2
in the center circle. Player X2 receives
the ball and tries to score. Player X1,
who passed the ball, becomes a defen-
der and tries to intercept the ball. Only
the attacking player may score.
Variation
The defender can also score.
Comments
The players get a point by scoring a goal
Advancing
X2 – X1 – X2
[email protected] 06 Aug 2018
FITNESS IN SOCCER
Speed, agility and quickness (SAQ) and repeated sprint ability (RSA)
121
Explanation
The player on the right can choose him-
self when to set off. Once the player cros-
ses the imaginary start line, the other
player can try to tap him. The person
tapping has to cover the same course as
the starting player. The starting player
tries to get back over the start line. If he
crosses the start line, he scores a point.
Variation
In the first set, the player may only run
up to the second row. He can then sprint
one row further each time.
Comment
Let the players count the points themsel-
ves and give the loser an additional task.
In the event of a tie, they both lose.
Advancing
The players change places each time.
[email protected] 06 Aug 2018
FITNESS IN SOCCER
122
Speed, agility and quickness (SAQ) and repeated sprint ability (RSA)
SUMMARY
Speed of movement is one of the most important components of soccer. Profes-
sional players are getting quicker and quicker over time, meaning that sprin-
ting ability and the ability to control speed is becoming more important in the
modern game. Therefore, soccer players should perform specific exercises in
order to improve their acceleration, maximum sprinting speed, and change of
direction capabilities. By simultaneously improving maximal sprinting speed
and endurance, a player can also improve repeated sprint ability, which enables
him to perform to his maximum during intense periods of match play.
REFERENCES
•
Andrzejewski, M., Chmura, J., Pluta, B., Strzelczyk, R. and Kasprzak, A., 2013. Analysis of sprinting activities of professional soccer
players. J Strength Cond Res, 27(8), pp.2134-2140.
•
Balyi, I. and Hamilton, A., 2004. Long-term athlete development: Trainability in childhood and adolescence. Windows of opportunity.
Optimal trainability. Victoria, BC: National Coaching Institute British Columbia & Advanced Training and Performance Ltd.
•
Bangsbo, J., Mohr, M. and Krustrup, P., 2006. Physical and metabolic demands of training and match-play in the elite football player.
Journal of Sports Sciences, 24(7), pp.665-674.
•
Bishop, D. and Spencer, M., 2004. Determinants of repeated-sprint ability in well-trained team-sport athletes and endurance-trained
athletes. J Sports Med Phys Fitness, 44(1), pp.1-7.
•
Bishop, D., Girard, O. and Mendez-Villanueva, A., 2011. Repeated-Sprint Ability – Part II Recommendations for Training. Sports Med,
41(9), pp.741-756.
•
Bishop, D., Edge, J., Thomas, C and Mercier, C., 2008. Effects of high-intensity training on muscle lactate transporters and postexercise
recovery of muscle lactate and hydrogen ions in women. Am J Physiol Regul Integr Comp Physiol, 295, pp.R1991–8.
•
Bloomfield, J., Polman, R., O’Donoghue, P. and McNaughton, L., 2003 or 2007. Effective speed and agility conditioning methodology for
random intermittent dynamic type sports. J. Strength Cond. Res., 21(4), pp.1093–1100.
•
Bogdanis, G.C., Nevill, M.E., Boobis, L.H. and Lakomy, H.K., 1996. Contribution of phosphocreatine and aerobic metabolism to energy
supply during repeated sprint exercise. J Appl Physiol, 80, pp.876-84.
•
Cavagna, G.A., Heglund, N.C. and Taylor, C.R., 1977. Mechanical work in terrestrial locomotion: two basic mechanisms for minimizing
energy expenditure. Am. J. Physiol., 233, pp.R243-R261.
•
Dellal, A. and Wong del, P., 2013. Repeated Sprint and Change-of-Direction Abilities in Soccer Players: Effects of Age Group. J Strength
Cond Res, 27(9), pp.2504-2508.
•
Donelan, J.M., Kram, R. and Kuo, A.D., 2001. Mechanical and metabolic determinants of the preferred step width in human walking.
Proceedings of the Royal Society B: Biological Sciences, 268, pp.1985–1992.
•
Haseler, L.J., Hogan, M.C. and Richardson, R.S., 1999. Skeletal muscle phosphocreatine recovery in exercise-trained humans is dependent
on O2 availability. J Appl Physiol, 86, pp.2013-8.
•
Haugen, T., Tønnessen, E., Hisdal, J. and Seiler, S., 2013. The Role and Development of Sprinting Speed in Soccer. Int J Sports Physiol
Perform, [Epub ahead of print].
•
Jovanovic, M., Sporis, G., Omrcen, D. and Fiorentini, F., 2011. Effects of speed, agility, quickness training method on power performance
in elite soccer players. J Strength Cond Res, 25(5), pp.1285-1292.
•
Little, T. and Williams, A.G., 2005. Specificity of acceleration, maximum speed, and agility in professional soccer players. J. Strength
Cond. Res., 19(1), pp.76–78.
•
Lockie, R.G., Murphy, A.J., Schultz, A.B., Jeffriess, M.D. and Callaghan, S.J., 2013. Influence of sprint acceleration stance kinetics on velo-
city and step kinematics in field sport athletes. J Strength Cond Res, 27(9), pp.2494-2503.
•
Mann, R. and Sprague P., 1980. A kinetic analysis of the ground leg during sprint running. Res Q Exerc Sport, 51(2), pp.334-48.
•
Moreno, E., 1995. Developing quickness part 2. Strength and Conditioning, 17, pp.38–39.
•
Nicola, T.L. and Jewison, D.J., 2012. The Anatomy and Biomechanics of Running. Clinical Journal of Sports Medicine, 31, pp.187–201.
•
Perroni, F., Corvino, M., Cignitti, L. and Minganti, C., 2013. RSA response to preseason training in semiprofessional soccer players. Sport
Sciences for Health, 9, pp.59-64.
•
Pontzer, H., Holloway, J.H. 4th, Raichlen, D.A. and Lieberman D.E., 2009. Control and function of arm swing in human walking and
running. The Journal of Experimental Biology, 212, pp. 523–534.
•
Rampinini, E., Bishop, D., Marcora, S.M., Ferrari Bravo, D., Sassi, R. and Impellizzeri, F.M., 2007. Validity of simple field tests as indica-
tors of match-related physical performance in top-level professional soccer players. Int J Sports Med, 28, pp.228-35.
•
Sander, A., Keiner, M., Wirth, K. and Schmidtbleicher, D., 2013. Influence of a 2-year strength training programme on power performance
in elite youth soccer players. Eur J Sport Sci, 13(5), pp.445-51.
•
Sheppard, J.M. and Young, W., 2011. Training agility and change-of-direction speed (CODS). In: M. Cardinale, R. Newton and K. Nosaka,
eds. 2011. Strength and Conditioning: Biological Principles and Practical Applications. Wiley-Blackwell. pp. 363-376.
•
Sheppard, J.M. and Young, W.B., 2006. Agility literature review: Classifications, training and testing. Journal of Sports Sciences, 24(9),
pp.919-932.
•
Sloth, M., Sloth, D., Overgaard, K. and Dalgas, U., 2013. Effects of sprint interval training on VO2max and aerobic exercise performance:
A systematic review and meta-analysis. Scandinavian Journal of Medicine and Science in Sports, 23(6), pp.e341–e352.
•
Tsitskarsis, G., Theoharopoulus, A. and Garefis, A., 2003. Speed, speed dribble and agility of male basketball players playing in different
positions. Journal of Human Movement Studies, 45, pp.21–30.
•
Varley, M.C., Gabbett, T. and Aughey, R.J., 2013. Activity profiles of professional soccer, rugby league and Australian football match play.
J Sports Sci., Sep 9 [Epub ahead of print].
•
Weyand, P.G., Sternlight, D.B., Bellizzi, M.J. and Wright, S., 2000. Faster top running speeds are achieved with greater ground forces not
more rapid leg movements. Journal of Applied Physiology, 89(5), pp.1991-1999.
•
Young, W. and Rogers, N., 2013. Effects of small-sided game and change-of-direction training on reactive agility and change-of-direction
speed. Journal of Sports Sciences, [Epub ahead of print 9 September].
•
Young, W.B., McDowell, M.H. and Scarlett, B.J., 2001. Specificity of sprint and agility training methods. Journal of Strength and Condi-
tioning Research, 15(3), pp.315–319.
[email protected] 06 Aug 2018
FITNESS IN SOCCER
Fitness testing
123
8
FITNESS TESTING
Jan Van Winckel, Kenny McMillan, Jean-Pierre Meert,
Balder Berckmans, Werner Helsen
8.1 INTRODUCTION
Monitoring the physical abilities critical to soccer performance allows sports scien-
tists and coaches to gain valuable information that can be subsequently used effec-
tively to optimize training and recovery. However, in complex sports like soccer,
the ability to isolate and evaluate specific physical abilities can be problematic.
The physiological and mechanical demands of soccer require players to be profi-
cient in numerous aspects of fitness, such as aerobic and anaerobic power, muscle
strength, flexibility, speed, agility and quickness (Reilly and Doran, 2003). These
physical demands can vary according to playing position, players’ individual abi-
lities, and the tactical guidelines imposed by the coach (Reilly, 2003). Ultimately,
match analysis of physical performance (e.g., distance covered) only provides the
coaching staff with a one-dimensional perspective, because players do not always
maximally exert their physical capacities during match play due to factors such as
tactics, score, and opposition standard. In this regard, research into elite match play
has found the work rate to be associated with that of the opposing team, as well as
their competitive level (Rampinini, 2007).
The main purpose of fitness tests is to build a physical profile of the player or
squad. There are also other reasons for periodic fitness tests, such as being able to
objectively assess the impact of training interventions (e.g., determine if the play-
ers’ physical abilities have improved over the season), as well as to inform the coa-
ches and sports scientists when a player is ready to return to training and, more
importantly, to competition following an injury.
[email protected] 06 Aug 2018
FITNESS IN SOCCER
Fitness testing
124
8.2 CRITERIA
Fitness testing for soccer players should meet the following criteria:
• They must be objective: A test’s results must be reproducible from day to day
and from one rater to the next, thus minimizing any subjective interpretation.
This gives the best chance of observing sensitive changes in fitness over the
season (improvements and decrements).
• It must be specific: A test must be specific to soccer and therefore assess physi-
cal parameters important to performance (e.g., utilize similar movements,
muscle groups, and energy systems).
• It must be valid: A test must actually measure what it professes to measure.
• A test should not require technical competence because of the learning effect
being too great. For example, if speed is being measured, it should be measu-
red without the ball, because the player’s technical skill will influence the
result of the test.
• It must be comprehensible: A test must be as simple as possible to minimize
learning effects and maintain reproducibility.
• It must be standardized in terms of administration, organization and environ-
mental factors. Ideally, tests should be conducted at the same time of day, the
same day in the microcycle, and after a similar amount of load or recovery.
Even the presence of parents or encouragement from the staff can affect the
test result.
• It must respect necessary recovery between tests. Coaches should be guided
by the time needed for replenishment of metabolic substrates when consi-
dering the recovery time between tests. Coaches should taper for at least 48
hours before conducting a test in order to reduce the effect of accumulated
fatigue and allow players to be tested in an optimal physical condition (Viru
and Viru, 2001).
• It must be reliable. Intra-rater reliability is the degree of agreement among
multiple repetitions of a diagnostic test performed by a single rater. Inter-ra-
ter reliability is the degree of agreement among different raters. A statistical
measure of inter-rater reliability is Cohen’s Kappa, which ranges in general
from 0 to 1.0. Larger numbers mean better reliability, and values approaching
zero suggest that any agreement can be attributed to chance alone. As a rule of
thumb, Kappa values from 0.40 to 0.59 are considered moderate, 0.60 to 0.79
are considered substantial, and 0.80 and greater are believed to be outstanding
(Landis and Koch, 1977).
• It must follow a logical order between consecutive tests. The National Strength
and Conditioning Association (NSCA) (Harman, 2008) suggests the following
order: resting and non-fatiguing tests first (e.g., resting heart rate (HRr), body
composition, flexibility, and jump tests), followed by tests for agility, power
and strength; sprints; local muscular endurance; and anaerobic and aerobic
capacity.
• Preferably, a test should measure isolated physical abilities (e.g., not speed and
endurance together). A test that measures too many factors at once does not
provide useful information to the coaches and sports scientists as to why the
player performs well or not. It is therefore difficult to set up a specific indivi-
dualized program.
[email protected] 06 Aug 2018
FITNESS IN SOCCER
Fitness testing
125
8.3 WHY MEASURE?
Measuring physical ability is important for both players and coaching staff for a
number of reasons.
8.3.1 For the players
• Testing provides feedback about the training process. This gives players a
clear understanding of their personal development.
• Reference data. Tests give an indication of a player’s strengths and weak-
nesses, with the results providing reference data for an individualized trai-
ning program. This makes it possible to outline a performance profile for each
player.
• Tests convey information about the player’s state of fitness. Playing soccer at
a high level is a strain on the body (overload principle), and this can result in
overload injuries. Tests can enable overtraining to be detected.
• A testing program is an educational process, helping the player to understand
the objectives of the training program.
• Regular testing increases the player’s motivation. Being more aware of one’s
own possibilities will encourage the player to conscientiously follow the trai-
ning program.
8.3.2 For the coach
• Setting positions. Based on the test results, the coach can designate players
to playing positions where their physical abilities are best suited to match
demands. For example, a player with a good acceleration and high peak run-
ning speed may be more suited to playing as a winger.
• The test results enable the coach to create a team profile. This may give the
coach a better insight into the strengths and weaknesses of his team. As an
example, speed tests can give the coach an idea of the speed of his defenders,
and this information can then be used to advise the defensive line on how high
up the field they should initiate pressure.
• Reference data. Test results are good indicators for the rehabilitation process.
Match fitness can be checked based on earlier results.
• Testing data can provide coaching staff with objective feedback on the effecti-
veness of a training program and enable the evaluation and adjustment of the
training schedule in order to optimize results.
[email protected] 06 Aug 2018
FITNESS IN SOCCER
Fitness testing
126
8.4 TEST ENVIRONMENT
The test environment and conditions must be consistent and standardized for the
testing data to be interpreted correctly. For example, if an initial fitness test is con-
ducted on the pitch in a warm environment, but the following test is carried out
in an indoor air-conditioned facility with a hard-floor surface, the two tests will
produce differing results.
Always note the conditions in order to simplify the analysis of the results:
• Time (The time of day can influence the result.)
• Equipment used (Is the time measured electronically or manually?)
• Periodization phase
• Training sessions 48 hours prior to the beginning of the test
• The order of the different tests
• Noise pollution
• Temperature and humidity
• Number of hours of sleep
• Emotional state of the athlete
• Medication
• Caffeine and other beverages
• Time and contents of the last meal
• Test environment
• Knowledge of the test (Is there a possible learning effect? Is the test “user
friendly”?)
• Accuracy (such as the unit of time, distances, etc.)
• Warming up (Was there enough time to warm up?)
• People present (Try to keep the number of people present as low as possible to
minimize outside influence.)
• Players’ motivation (Is the player motivated for this type of test?
• Encouragement (Do not allow encouragement or incentives, because these can
affect the test results.)
As a general rule, testing should be conducted under neutral conditions. This
means a good surface and a moderate temperature with no other environmental
factors that could influence results, such as humidity, rain, and so on.
8.5 THE TERMS
“TO BE” AND “AS IS”
These two terms are used in sporting circles to determine the demands of the sport
and measure the current status. In other words, “to be” is an analysis of the sport
and the physical abilities required, while “as is” represents the current state of the
player for each of these abilities. For example, “to be” could be that a winger has
to run 1,000m at high intensity during a match. The “as is” is then determined by
looking at how many meters the player actually ran. For instance, if the player only
ran an average of 800m during matches, the difference between “to be” and “as is”
is then 200m. This implies that the player has to work on his fitness to make up the
difference between the two values.
[email protected] 06 Aug 2018
FITNESS IN SOCCER
Fitness testing
127
8.6 TESTS
Different tests that can be used to determine the team’s current status (“as is”) are
described below. We now describe examples of muscular endurance, power, sprint,
repeated sprint, agility and endurance tests that can provide useful information on
the fitness status of soccer players.
8.6.1 Muscular endurance tests
Introduction
Augustsson et al. (2009) demonstrated that males performed significantly more
push-ups than females and had 44% greater upper-body strength endurance. They
also stated that females who trained upper-body strength were more likely to avoid
injury. Kennedy et al. (2012) confirmed this when they suggested that athletes with
limited upper-extremity endurance, as demonstrated by low push-up performance,
were more likely to be injured.
Warm up
The standardized warm up for muscular endurance tests should be:
- Five minutes jogging followed by a dynamic activation of the deep musculature.
Push-up or press-up test
- Aim: The push-up test is used to evaluate upper-body endurance, specifically
the pectoralis major, anterior deltoids, and triceps (Hoffman, 2006).
- Protocol: Many variations on push-up tests exist, such as the duration of the
test, the placement of the hands, how far to go down, and so on. The push-up
test is conducted with a normal hand and foot support position, and the body
and legs are in a straight line with the feet slightly apart. The player lowers the
body until there is a 90-degree angle at the elbows and then returns to the star-
ting position. The back must be straight at all times, and the player has to conti-
nue the upward movement until his arms are fully extended.
- Result: The number of repetitions are counted until exhaustion or until the
player is unable to maintain the proper technique over two consecutive repeti-
tions. No pause is allowed at elbow extension, and a self-selected tempo should
be maintained throughout the test.
Some other tests exist, such as timed tests like the two-minute army push-up test
and the one-minute navy push-up test, as well as tempo tests where the push-ups
are performed to the rhythm of a beep or metronome. The push-ups are performed
at a rate of one push up every 3s in the cadence push-up test as part of the Fitness-
Gram and the President’s Challenge Fitness Award.
Push-up test
Min.
Max.
Stdev.
Avg
Elite U16
19.00 ABS
46.00 ABS
7.71
28.40 ABS
Elite U17
21.00 ABS
50.00 ABS
7.35
31.14 ABS
Elite U19
21.00 ABS
75.00 ABS
9.81
37.82 ABS
Elite U21
20.00 ABS
61.00 ABS
11.70
39.04 ABS
Elite First team
22.00 ABS
76.00 ABS
13.45
48.17 ABS
Table 8.1: Reference data based on tests at different top clubs (TopSportsLab).
[email protected] 06 Aug 2018
FITNESS IN SOCCER
Fitness testing
128
Partial abdominal muscle
- Aim: To measure the muscular endurance of the abdominal muscles and hip
flexors. This provides a foundation for trunk and spine stability (Axler and
McGill, 1997).
- Protocol: The player lies on his or her back with knees flexed at 90°. (This relie-
ves the strain on the lower back and the hip flexors are extensively immobili-
zed.) The feet may not be anchored to the ground, and the arms should lay by
the player’s side with the fingers touching a line. A second line is positioned at
10 cm. The player then tries to do as many curl-ups as possible in one minute.
Many methods of conducting crunches or curl-up tests have been published
(e.g., feet anchored, hands crossed over the chest, legs on the ground, etc.). Some
tests use a certain period (e.g., two minutes in the US Army) and some use a set
tempo until exhaustion (e.g., the NHL curl-up beep).
Fig. 8.1: Abdominal muscle exercise
If the abdominal muscle exercises are performed with extended legs, the muscles flexing the hip
will assist in the exercise. When the knees are bent at 90°, the strength of the hip flexors is limited,
enabling the abdominal muscles to work in isolation. Parfrey et al. (2008) did not find any significant
effects of knee position in muscle activation, but they did find a trend towards greater activation of
the abdominal musculature and lower Rectus Femoris activation when the knees were bent.
- Result: The number of repetitions are counted.
- Science: Parfrey et al. (2008) examined the effects of different sit- and curl-up
positions on activation of abdominal and hip flexor musculature. In this study,
the highest level of activation came from the 10 cm sit-up test with non-fixed
feet and bent knees as described in this book. This test provides high activation
of the abdominal musculature with minimal activation of the hip flexors.
[email protected] 06 Aug 2018
FITNESS IN SOCCER
Fitness testing
129
8.6.2 Power tests
Introduction
The jumping ability of a soccer player is considered highly important for per-
formance. Jumping is a complex movement that greatly depends on inter-limb
coordination, muscle-fiber type and stiffness, and maximum strength. Literature
has shown that jump height can be improved through various types of training
methods (Kotzamanidis et al., 2005).
In the literature, a range of different terms are used. In this book, we use the follo-
wing terms:
• Squat jump (SJ): The player starts from a semi-squat position (90°) with no
arm swing and no counter movement
• Vertical jump (VTJ): The player starts from a stationary, semi-squat position
(90°) with arm swing and no counter movement.
• Counter movement jump (CMJ): The player starts from an upright standing
position and performs a downward movement (counter movement) with no
arm swing allowed.
• Counter movement jump with arm swing (CMJwa): The player starts from
an upright standing position and performs a fast downward movement (coun-
ter movement) with arm swing.
In the literature, the VTJ is often confused with the CMJ. In a CMJ, the player can
bend his legs and make a counter movement, which will enhance the test results
(jump higher) compared to a VTJ. In addition, the VTJ is not an easy test to carry
out. The player should not conduct any pre-stretching. Even minor pre-stretching
may make a big difference to the height jumped.
Warm up
The standardized warm up for power tests is as follows:
• Five minutes jogging followed by a dynamic activation of the deep musculature
• Two submaximal jumps, a one-minute recovery, and one maximal jump follo-
wed by two minutes of recovery.
Counter movement jump (CMJ)
- Aim: To measure the explosive, concentric strength of the legs and re-use of
elastic energy during the eccentric to concentric movement.
- Protocol: The CMJ is performed from a standing start. The test is best carried
out on a contact mat. If a contact mat is not available, the CMJwa test can be
conducted by measuring the reach height and then maximum height by using
a Vertec or a wall.
Three maximal jumps are done with 30s of rest between them.
- Instructions for the athlete: The player starts from an upright standing position
and performs a fast downward movement (counter movement) with or without
an arm swing.
- Result: The highest score
[email protected] 06 Aug 2018
FITNESS IN SOCCER
Fitness testing
130
Counter Movement Jump (with Arm Swing)
Min.
Max.
Stdev.
Avg
Elite U16
28.80 cm
59.00 cm
5.63
40.55 cm
Elite U17
22.50 cm
59.10 cm
6.54
40.24 cm
Elite U19
28.70 cm
65.20 cm
7.06
44.63 cm
Elite U21
30.00 cm
65.70 cm
6.37
44.98 cm
Elite First team
32.20 cm
63.90 cm
5.77
47.82 cm
Elite Women first team
27.20 cm
42.50 cm
3.93
32.95 cm
Counter Movement Jump
Min.
Max.
Stdev.
Avg
Elite U16
21.40
53.50
4.96
34.98
Elite U17
23.80
47.10
5.09
34.26
Elite U19
24.80
60.80
6.34
38.53
Elite U21
28.30
49.90
5.24
38.91
Elite First team
28.70
59.40
4.65
42.12
Elite Women first team
25.30
34.20
2.39
28.78
Squat jump
Min.
Max.
Stdev.
Avg
Elite U16
20.30 cm
53.90 cm
4.77
32.16 cm
Elite U17
18.64 cm
49.40 cm
6.26
33.71 cm
Elite U19
20.70 cm
53.60 cm
5.83
36.20 cm
Elite U21
23.30 cm
55.70 cm
5.64
36.51 cm
Elite First team
28.30 cm
53.70 cm
4.53
39.90 cm
Elite Women first team
21.00 cm
35.20 cm
3.37
27.49 cm
Table 8.2: Reference data based on tests at different top clubs (TopSportsLab).
One-legged CMJ Left
Min.
Max.
Stdev.
Avg
Elite U16
14.50
37.36
4.32
23.59
Elite U17
11.40
38.60
5.21
22.65
Elite U19
12.60
41.50
6.10
23.16
Elite U21
17.10
43.00
4.97
27.42
Elite First team
15.80
41.30
4.89
27.68
Elite Women first team
16.20
25.20
2.85
20.06
One-legged CMJ Right
Min.
Max.
Stdev.
Avg
Elite U16
14.70
37.10
4.09
23.46
Elite U17
12.20
39.80
5.03
22.49
Elite U19
11.90
40.40
6.10
23.75
Elite U21
18.40
41.80
4.63
27.06
Elite First team
18.00
39.60
4.60
27.48
Elite Women first team
14.30
25.40
2.92
20.03
Table 8.3: Reference data based on tests at different top clubs (TopSportsLab).
[email protected] 06 Aug 2018
FITNESS IN SOCCER
Fitness testing
131
VERTICAL JUMP (VTJ) AND SQUAT JUMP (SJ)
- Aim: To measure the explosive, concentric strength of the legs.
- Protocol: The SJ is performed from a semi-squat position. A total of three maxi-
mal jumps are performed with a 30s pause after each jump. In the event of dif-
ferent jump tests, a five-minute rest period is taken between the different tests.
The squat jump is done without arm swing (see figure 13.5).
The VTJ is performed from a semi-squat position with arm swing. The test is best
carried out on a contact mat. If this is not available, the test can also be conducted
by measuring the reach height and then maximum height by using a Vertec or a
wall. Three maximum jumps are performed with a 30s rest between each attempt.
- Instructions for the athlete:
• Knees kept at an angle of 90° before jumping
• No pre-stretching permitted
- Result: The highest score.
- Elasticity index: The percentage difference between SJ and CMJ height is
defined as the elasticity index (EI) or elasticity rate (Walshe et al., 1996). The
EI provides information regarding viscoelastic and neuromuscular capacities
(Pacheco et al., 2011)
STANDING BROAD JUMP, HORIZONTAL JUMP OR STANDING LONG JUMP TEST
The standing broad jump (SBJ) is an athletic event. It was even an Olympic event
until 1912. A horizontal jump may be of more value to the sports practitioner,
because horizontal movements occur in many sports actions such as sprinting and
other agility movements. Horizontal jump tests have good reliability, and they cor-
relate well with sprinting both kinematically and kinetically (Ball and Zanetti, 2012).
- Aim: To measure the explosive, concentric strength of the leg muscles.
- Protocol: The SBJ is a long jump from a standing position. The player jumps as
far as possible, landing on both feet without falling backwards. Three jumps are
carried out with a break of 30s between attempts. The player may use a counter
movement.
- Instructions for the athlete:
• Feet slightly apart behind the line
• Jump as far as possible, landing on both feet
It is advisable to use a mat to absorb the shock on landing.
- Result: The best score is measured accurately to the nearest cm with the best
results being recorded.
Standing Broad Jump
Min.
Max.
Stdev.
Avg
Elite U16
155.00 cm
274.00 cm
21.73
206.71 cm
Elite U17
161.00 cm
246.00 cm
21.34
196.78 cm
Elite U19
185.00 cm
254.00 cm
14.53
215.00 cm
Elite U21
185.00 cm
265.00 cm
16.30
226.08 cm
Elite First team
160.00 cm
283.00 cm
23.74
232.77 cm
Elite Women first team
/
/
/
/
Table 8.4: Reference data based on tests at different top clubs (TopSportsLab).
[email protected] 06 Aug 2018
FITNESS IN SOCCER
Fitness testing
132
SINGLE-LEG, TRIPLE-HOP TEST LEFT AND RIGHT (SLTHT L & R)
Functional tests for an individual lower extremity—such as the Single-Leg Vertical
Jump (SLVJ), Single-Leg Hop for Time (SLHT), and Single-Leg Hop for Distance
(SLHD)—are used by medical staff to gain information to help decide whether a
player is ready to return to full play or not. The popularity of single-limb hop tests
is clearly evident in ACL outcome studies. This is not surprising given there is incre-
ased functionality over two-legged tests. The use of the healthy limb as a biological
control eliminates the need to rely on population-specific normative data (Hopper
et al., 2002). Furthermore, pre-injury data is often unavailable (van der Harst, Goke-
ler and Hof, 2007). Additionally, functional tests can be used to measure percentage
deficit after an injury and monitor the effectiveness of rehabilitation (Clark, 2001).
A functional deficit of 10% between limbs is accepted as a return-to-play criteria.
Triple-Hop Distance Test L
Min.
Max.
Stdev.
Avg
Elite U16
410.00 cm
760.00 cm
60.67
606.05 cm
Elite U17
430.00 cm
761.00 cm
62.64
586.67 cm
Elite U19
470.00 cm
766.00 cm
64.98
634.38 cm
Elite U21
548.00 cm
819.00 cm
53.93
678.28 cm
Elite First team
531.00 cm
820.00 cm
49.58
694.52 cm
Elite Women first team
466.00 cm
604.00 cm
36.41
537.00 cm
Triple-Hop Distance Test R
Min.
Max.
Stdev.
Avg
Elite U16
438.00 cm
734.00 cm
56.40
599.07 cm
Elite U17
398.00 cm
720.00 cm
67.13
577.38 cm
Elite U19
470.00 cm
762.00 cm
67.86
637.42 cm
Elite U21
388.00 cm
784.00 cm
61.20
677.48 cm
Elite First team
435.00 cm
788.00 cm
48.66
688.40 cm
Elite Women first team
496.00 cm
581.00 cm
24.62
534.75 cm
Table 8.5: Reference data based on tests at different top clubs (TopSportsLab).
- Aim: To measure the explosive, concentric strength of the leg muscles and the
difference between the left and right leg.
- Protocol: The SLTHT is a long jump on one leg from a standing position. The
player stands on one leg behind the line and hops on that leg three consecutive
times, travelling as far as possible. The player lands on one leg.
- Instructions for the athlete:
• Stand on one leg behind the line.
• Hop as far as possible three times, landing on the same foot.
• Use your hands and arms to the maximum.
- Result: The distance is recorded accurately to the nearest centimeter. The score
is measured from the line to where the heel touched the ground on the last
jump. The best score, as well as the average score, is recorded.
[email protected] 06 Aug 2018
FITNESS IN SOCCER
Fitness testing
133
- Science: This test can be used as a return-to-play criteria by measuring the func-
tional deficit between limbs. This is done using the Limb Symmetry Index (LSI)
(i.e., LSI = injured leg/non-injured leg x 100). Noyes et al. (1991) described a
limb symmetry score of below 85% as being abnormal.
SEATED CHEST PASS 3 KG
- Aim: To measure the explosive, concentric strength of the arm muscles. Upper-
body power has been quantified using various medicine ball throw tests, inclu-
ding the seated chest pass (Vossen et al., 2000; Cronin and Owen, 2004).
- Protocol: The seated chest pass is a maximal throw with both hands from a sit-
ting position. The player sits against a wall with a straight back and extended
legs while holding a 3 kg medicine ball in front of his or her chest. The player
throws the ball as far as possible using both hands. The player performs three
throws, and the best score is recorded.
- Instructions for the athlete:
• Sit with your back against the wall.
• Keep your legs straight and close together.
• Hold the ball in front of your chest with both hands.
• Throw the ball as far as possible.
- Result: The distance is recorded accurately to the nearest cm. The score is
measured from the line to where the ball made contact with the floor.
8.6.3 Sprinting speed
Introduction
According to Little and Williams (2005), high-speed actions during soccer competi-
tion can be categorized into actions requiring acceleration and deceleration, maxi-
mal speed, and agility. Acceleration is the rate of change in velocity that allows a
player to reach maximum velocity in the minimum amount of time. On the other
hand, deceleration is the rate at which a player can slow down. Maximum speed
is the maximal velocity at which a player can sprint. The range of sprint distances
documented during games (from 1.5m up to 105m) indicates the need for both
acceleration and maximum speed abilities. The literature states that acceleration,
maximum speed, and agility are specific qualities that are relatively unrelated to
one another (Bangsbo, 1994; Little and Williams, 2003). Importantly, the results of
sprint tests have been shown to differ between different positional roles within the
team (Kollath and Quade, 1993).
Warm up
Standardized warm up for sprint tests:
Five minutes jogging
Five minutes of dynamic stretching
Two submaximal sprints of 20m, a one-minute recovery, and one nearly maximal
sprint of 40m followed by two minutes of recovery.
10, 20, 40m sprint test
- Aim: To measure acceleration (10m) and maximum running speed (40m).
- Protocol: Draw a starting line and set up the photoelectric timing gates at 10,
20 and 40m.
[email protected] 06 Aug 2018
FITNESS IN SOCCER
Fitness testing
134
The player runs the set distance as quickly as possible. The test is conducted
three times, with a rest period of two minutes between each sprint. The player
stands with one foot 50cm behind the first electronic gate and decides when to
set off (to eliminate reaction time). It is important for the player to run at full
pace through the final 40m electronic timing gate.
Electronic measuring equipment is essential for all tests, because the distances
for soccer-specific sprint tests are too short to be measured manually. Double
beam timing gates should be used if possible. The timing gates should be set
at waist height, because this prevents an extended arm or leg from causing an
incorrect time to be recorded.
- Result: The time is recorded to the nearest 1/100th of a second, with the best
time being noted.
Acceleration index = 20 m - 10 m sprint time
Maximum speed index = 40 m – 20 m sprint time
Sprint test 10m
Min.
Max.
Stdev.
Avg
Elite U16
1.66 sec
2.22 sec
0.12
1.90 sec
Elite U17
1.57 sec
2.28 sec
0.11
1.90 sec
Elite U19
1.57 sec
2.24 sec
0.14
1.86 sec
Elite U21
1.51 sec
2.15 sec
0.14
1.81 sec
Elite First team
1.49 sec
2.05 sec
0.10
1.76 sec
Elite Women first team
1.99 sec
2.19 sec
0.06
2.08 sec
Sprint test 20m
Min.
Max.
Stdev.
Avg
Elite U16
2.83 sec
3.87 sec
0.20
3.27 sec
Elite U17
2.92 sec
3.93 sec
0.18
3.28 sec
Elite U19
2.69 sec
3.85 sec
0.25
3.16 sec
Elite U21
2.66 sec
3.67 sec
0.21
3.08 sec
Elite First team
2.72 sec
3.46 sec
0.13
3.02 sec
Elite Women first team
3.41 sec
3.89 sec
0.12
3.58 sec
Sprint test 40m
Min.
Max.
Stdev.
Avg
Elite U16
5.06 sec
6.87 sec
0.37
5.84 sec
Elite U17
5.20 sec
7.00 sec
0.36
5.86 sec
Elite U19
4.81 sec
6.82 sec
0.44
5.60 sec
Elite U21
3.94 sec
6.53 sec
0.47
5.38 sec
Elite First team
4.81 sec
5.96 sec
0.22
5.36 sec
Elite Women first team
6.06 sec
6.98 sec
0.22
6.43 sec
Table 8.6: Reference data based on tests at different top clubs (TopSportsLab).
[email protected] 06 Aug 2018
FITNESS IN SOCCER
Fitness testing
135
8.6.4 Repeated sprint ability
BANGSBO REPEATED SPRINT TEST
Fig. 8.2: Bangsbo repeated sprint test
- Aim: To measure soccer-specific repeated sprint ability (Bangsbo, 1994).
- Protocol: The protocol includes seven successive 34.2m maximal sprints, inclu-
ding a slalom. The players start with their leading foot 0.3m behind the starting
line. A period of active recovery (25 s to cover the 40m back to the starting line)
is given after each sprint.
- Guidelines:
• Make the player run the course twice as part of the warm up.
• Emphasize that:
- the distance between A and B has to be run at maximum speed
- the player has to return to the starting line on time
• Two observers are needed: one at the starting line and another at the finish
line. The first one calls out “2-1-go,” signaling these three stages by first
extending his arm, then bending his elbow to raise his forearm at an angle of
90°, and then lowering his forearm to a completely horizontal position. The
second observer then starts the stopwatch and records the time.
• The player performs seven sprints in total.
• Testing an entire team takes approximately an hour.
- Result: The time is measured accurately to the nearest 1/100th of a second,
with the best time being recorded. The mean time is the average of the seven
sprints. This time indicates the player’s ability to perform several sprints within
a short period. The fatigue index is calculated by deducting the fastest time
of the first two sprints from the slowest time of the last two sprints. A high
fatigue index suggests the player shows inconsistency in sprint performance,
and this represents the player’s inability to recover during repeated sprints. A
high fatigue index may reflect an inability to replenish phosphocreatine stores
[email protected] 06 Aug 2018
FITNESS IN SOCCER
Fitness testing
136
and adequately remove blood lactate between consecutive sprints (Tomlin and
Wenger, 2001).
Wragg et al. (2000) used a modified version of the Bangsbo sprint test. Their
modification involved adding a random right or left turn component to
improve the applicability to the vari-directional nature of team sports and to
place a demand upon both legs. The change of direction was shown using two
light-emitting diodes (LED).
8.6.5 Agility
Introduction
Mirkov et al. (2008) investigated the reliability of soccer-specific field tests and pos-
tulated that the most appropriate indicator of overall soccer performance may be
agility testing. A soccer player changes direction every 2–4s (Bangsbo, 1992). This
was confirmed by Verheijen et al. (2010) when they reported that players make
1,200–1,400 direction changes during a game.
Warm up
Standardized warm up for agility tests:
Five minutes jogging followed by a dynamic activation of the deep musculature
Two submaximal sprints of 4x5m shuttle, one minute of recovery, and two maximal
sprints of 3x10m shuttle followed by two minutes of recovery
THE 505 AGILITY TEST
Fig. 8.3: The 505 test
- Aim: Measuring agility (i.e., change of direction).
- Protocol: The player runs from point A to point C and back to A as fast as pos-
sible. The player must step past the turn line with both feet before returning to
the start. The time is recorded from when the player first runs through the 5m
marker (B) to when they return through this marker (i.e., the time taken to cover
the 5m there and back, 10m in total).
- Result: The score is determined by recording the time to the nearest 1/100th of
a second. Each player has three attempts, with only the best time being noted.
[email protected] 06 Aug 2018
FITNESS IN SOCCER
Fitness testing
137
MODIFIED ILLINOIS AGILITY TEST
Fig. 8.4: Modified Illinois agility test
Illinois agility test
Min.
Max.
Stdev.
Avg
Elite U16
14.22 sec
17.08 sec
0.59
15.27 sec
Elite U17
14.68 sec
16.99 sec
0.59
15.38 sec
Elite U19
14.00 sec
16.18 sec
0.57
14.85 sec
Elite U21
13.85 sec
15.84 sec
0.55
14.71 sec
Elite First team
14.63 sec
15.61 sec
0.37
15.19 sec
Table 8.7: Reference data based on tests at different top clubs (TopSportsLab).
- Aim: To test agility (Getchell, 1979).
- Protocol: The course is 10m long and 5m wide. The cones in the center are
placed 3.3m from each other. In the original protocol, players were asked to
begin in a prone position at the starting cone. Since this is an unnatural position
for a soccer player, we have instead chosen to start in a standing position 30 cm
behind the first timing gate.
- Result: The score is determined by recording the time to the nearest 1/100th
of a second. The player runs the course twice, both from the left side, with a
minimum of three minutes between the two attempts. The best time is recorded.
- Science: Caldwell and Peters (2009) examined seasonal variations in physiolo-
gical fitness. The authors found that both sprint and agility performance decre-
ased significantly during the off-season period. This is supported by Ross and
Leveritt (2001), who identified that detraining caused a decrease in speed per-
formance over 10–20m.
[email protected] 06 Aug 2018
FITNESS IN SOCCER
Fitness testing
138
MODIFIED T TEST LEFT AND RIGHT
Fig. 8.5: Modified T test left
- Aim: To measure speed and agility.
- Protocol: The player runs the course as quickly as possible, from point A in the
direction of B, C, D, and B before returning to the start. In contrast to the pro-
tocols outlined by Paulole et al. (2000) and Sassi et al. (2009), the course may
be covered in as natural a way as possible without shuffling or running bac-
kwards, since neither movements are used often in soccer and are not determi-
ning factors.
Sassi et al. (2009) proposed another modified agility T-test. The researchers indi-
cated that this new version of the T-Test (MAT), obtained by reducing the total
distance covered, presents a good relative and absolute reliability for both men
and women. The nature of displacements in sports like volleyball, basketball,
and tennis cannot be replicated by using the standard T-Test, because they are
based on very short repeated displacements. They concluded that the MAT
would provide a more specific measurement of agility for these sports. How-
ever, for activities practiced on large courts or fields, such as soccer and rugby,
the use of the T-test would be more adequate and is recommended.
- Result: The test is performed both from the right and the left. The score is deter-
mined by recording the time to the nearest 1/100th of a second. The best time
is noted.
- Science: Pauole et al. (2000) investigated the reliability of the T-Test, finding it
to be a highly reliable test that measures a combination of components, inclu-
ding leg speed, leg power, and agility. The T-Test may be used to differentiate
between those of low and high levels of sports participation.
Modified Agility T-Test Right
Min.
Max.
Stdev.
Avg
Elite U16
8.29 sec
10.56 sec
0.38
9.55 sec
Elite U17
8.77 sec
11.37 sec
0.47
9.68 sec
Elite U19
8.52 sec
10.71 sec
0.49
9.44 sec
Elite U21
8.03 sec
10.63 sec
0.47
9.44 sec
Elite First team
8.53 sec
10.95 sec
0.40
9.27 sec
Elite Women first team
9.58 sec
10.74 sec
0.28
10.02 sec
[email protected] 06 Aug 2018
FITNESS IN SOCCER
Fitness testing
139
Modified Agility T-test Left
Min.
Max.
Stdev.
Avg
Elite U16
8.56 sec
10.86 sec
0.37
9.51 sec
Elite U17
8.75 sec
11.00 sec
0.45
9.59 sec
Elite U19
8.38 sec
10.59 sec
0.48
9.38 sec
Elite U21
8.41 sec
10.27 sec
0.38
9.32 sec
Elite First team
8.48 sec
10.85 sec
0.43
9.22 sec
Elite Women first team
9.80 sec
11.05 sec
0.32
10.23 sec
Table 8.8: Reference data based on tests at different top clubs (TopSportsLab).
HEXAGON AGILITY TEST
Beekhuizen et al. (2009) investigated
the test-retest reliability of the Hexagon
Agility test. The researchers concluded
that the hexagon test shows excellent
reliability for measuring agility, sup-
porting its use as a tool to measure ath-
letic performance and lower-extremity
agility. This high level of reliability, in
addition to its ease of administration,
makes the hexagon test a practical and
effective method to measure quickness.
Additionally, the researchers suggested that while using this test, a change of grea-
ter than 1.015s is necessary to be 95% certain that this change in time reflects impro-
vement and exceeds measurement error. A practice trial is recommended prior to
recording scores to reduce the possibility of a learning effect.
- Aim: This test measures lower extremity agility and quickness.
- Protocol: Draw a regular hexagon (internal angles of 120°), with the sides being
60.5cm (2 feet) long. The test begins with the player standing on a line placed
in the middle of the hexagon. The test starts when the tester gives the com-
mand “Ready, go!” and starts the chronometer. The player tries to complete
three rounds as quickly as possible by jumping two-footed over each side. The
player keeps his head and body facing in the same direction all the time. The
test is carried out in both a clockwise and anti-clockwise direction and perfor-
med three times in each direction with 10s of recovery in between. There is also
a minimum of five minutes rest between the clockwise and anti-clockwise tests.
If the player touches the line, the trial is stopped and restarted (Baechle and
Earle, 2000).
- Result: The score is determined by recording the time to the nearest 1/100th of
a second.
The best time is recorded. A comparison between the clockwise and anti-
clockwise tests may reveal an imbalance between left and right movement skills.
Fig. 8.6: Hexagon agility test
[email protected] 06 Aug 2018
FITNESS IN SOCCER
Fitness testing
140
8.6.6 Anaerobic Capacity tests
Warm up
Standardized warm up for measuring anaerobic capacity:
• Five minutes jogging followed by a dynamic activation of the deep musculature
• Four submaximal sprints of 50m followed by two minutes of recovery
MODIFIED 300m SHUTTLE TEMPO RUN
Maximally accumulated oxygen deficit (MAOD) has been argued to be the best
noninvasive method for estimating anaerobic capacity (Scott et al., 1991; Rams-
bottom et al., 1997). An easy-to-administer field test that could accurately predict
MAOD would be of great use to many field-sport athletes and coaches. Moore and
Murphy (2003) concluded that the 300m Shuttle Run Test is a useful estimate of
anaerobic capacity in soccer players.
Fig. 8.7: Modified 300m shuttle tempo test
- Aim: To measure acyclic anaerobic endurance capacity (shuttle tempo test).
- Place: Artificial field.
- Warm-up: cardiovascular stimulus (five minutes running), followed by dyna-
mic stretching exercises, and finally, a few submaximal sprints.
- Protocol: The player runs to the 10m line and back, then to the 20m, 30m, 40m
and 50m lines. The player has to cross each line with at least one foot. Two
observers are needed, with one standing by the starting line and recording the
time. The other observer moves constantly from the 10m line to the 20m line
(and so on), checking that the player passes the line and ensuring there is no
confusion about the distance to be covered. Different protocols are used in the
literature, such as a 300m shuttle tempo test and a shuttle test of 300m over a
20m distance (Moore and Murphy, 2003). During the 300m shuttle run test, the
players must run to the 25m mark, touch it with a foot, turn, and run back to the
start. This is repeated six times without stopping (Sporis et al., 2008).
- Result: The score is determined by the time recorded to the nearest 1/100th of
a second.
[email protected] 06 Aug 2018
FITNESS IN SOCCER
Fitness testing
141
Modified 300m Shuttle Tempo Test
Min.
Max.
Stdev.
Avg
Elite U16
57.03 sec
73.23 sec
3.21
62.24 sec
Elite U17
56.30 sec
66.03 sec
2.19
60.46 sec
Elite U19
55.44 sec
65.38 sec
2.19
59.45 sec
Elite U21
52.90 sec
80.10 sec
4.75
58.71 sec
Elite First team
53.06 sec
63.53 sec
2.21
57.17 sec
Elite Women first team
65.50 sec
75.69 sec
3.18
70.26 sec
Table 8.9: Reference data based on tests at different top clubs (TopSportsLab).
8.6.7 Endurance tests
20m SHUTTLE RUN TEST
The 20m shuttle run test was developed by Léger and Lambert in 1982.
- Aim: The 20m shuttle run test is used to analyze acyclic endurance capacity. The
test measures cardiorespiratory endurance by means of a progressive maximum
test.
- Protocol: Set out two lines 20m apart, with a reference line 3m in front of each
line. A CD player and a compact disc of the Léger protocol are used.
Instructions for the tester: The starting speed is 8 km/h, with 0.5 km/h added
every minute. The intervals are indicated by audible signals. The aim is to start
at one of the two lines 20m apart each time the signal is given.
- Instructions for the athlete:
• Each player runs at the same pace (i.e., not faster or slower than the audible
signal).
• One foot needs to touch the line.
• If a player touches the line before the signal is given, he has to wait to set off
again.
• A player must stop if:
- he or she gives up
- he or she does not touch the finish line three times
- he or she is not at the 3m line at the moment the audible signal sounds.
• Keep at least 1m distance between the players.
- Result: The time is recorded when the player stops.
[email protected] 06 Aug 2018
FITNESS IN SOCCER
Fitness testing
142
YO-YO INTERMITTENT RECOVERY TEST
The Yo-Yo intermittent recovery (Yo-Yo IR) test was first described in Fitness Trai-
ning in Soccer, a scientific approach by Jens Bangsbo (1994). There are two versions
of the Yo-Yo Intermittent Recovery Test: a Level 1 for beginners and an advanced
level 2. Both tests evaluate players’ abilities to repeatedly perform intense exercise.
The Yo-Yo IR level 1 (Yo-Yo IR1) test focuses on the capacity to perform intermit-
tent exercise, leading to a maximal activation of the aerobic system, whereas the
Yo-Yo IR level 2 (Yo-Yo IR2) test determines an individual’s ability to recover from
repeated exercise with a high contribution from the anaerobic system. Evaluations
of elite athletes in various sports involving intermittent exercise showed that the
higher the level of competition, the better an athlete performs in the Yo-Yo IR tests
(Bradley et al., 2010; Krustrup et al., 2006). The Yo-Yo IR tests have been shown
to be a more sensitive measure of changes in performance than VO
2max, providing
a simple and valid way to obtain important information about an individual’s
capacity to perform repeated bouts of high-intensity exercise. Furthermore, high
correlations were found between Yo-Yo IR test performance and the distance of
high-intensity running during a soccer match, which was not the case for other
tests, such as repeated sprint tests, the VO
2max test, and the 20m shuttle run test
(Krustrup, et al., 2003; Bangsbo J. et al., 2008). Thomas et al. (2006) investigated the
correlation between the Yo-Yo IR test and the 20m shuttle run test and VO
2max. The
investigators concluded that the level 1 (recreational) and level 2 (elite) test scores
both strongly correlated with the 20m shuttle run (Léger and Lambert, 1982 ) scores
and VO
2max (level 1 recreational subjects only).
Estimates of VO
2max: Yo-Yo IR1 test: VO2max (mL/min/kg)
= IR1 distance (m) × 0.0084 + 36.4
Estimates of VO
2max: Yo-Yo IR2 test: VO2max (mL/min/kg)
= IR2 distance (m) × 0.0136 + 45.3
Fig. 8.8: Yo-Yo intermittent test recovery test
[email protected] 06 Aug 2018
FITNESS IN SOCCER
Fitness testing
143
- Aim: For a trained player, the Yo-Yo IR1 test lasts 10–20 minutes and is mainly
focused on an individual’s endurance capacity. In contrast, the Yo-Yo IR2 test
lasts 5–15 minutes and tries to evaluate a trained player’s ability to perform a
repeated intense bout with a high anaerobic energy contribution. The Yo-Yo IR1
test achieves these criteria for a lesser trained player (Bangsbo et al., 2008).
- Protocol: The Yo-Yo IR tests consist of two 20m shuttle runs at increasing speed
with a ten-second (2 x 5m) period of active recovery between that is control-
led by audio signals. A player should run until they are unable to maintain the
speed, and the total distance covered at this point is the test result. A warning is
given whenever the player does not complete a shuttle in time, and the player
must stop if they do not complete a full shuttle the next time. There are two
levels to the test. Level 1 (Yo-Yo IR1) starts at a lower speed, and the increases in
speed are more moderate than in the level 2 (Yo-Yo IR2) test.
- Instructions:
• Each player runs at the same pace (i.e., not faster or slower than the audible
signal).
• Walk slowly around the cone and set off again when the signal is given.
• The test must be stopped after a second warning has been given by the tester.
• Allow at least 1m of space per player.
- Result: The level and total distance are noted.
Mohr and Krustrup (2013) investigated Yo-Yo intermittent recovery test perfor-
mances within an entire soccer league (of semi-professional players) during a full
season. YYIR2 performance was 847 ± 227m at preseason. It rose by 128 ± 113m to
975 ± 205m at the start of the season, rising further by 59 ± 102m to 1034 ± 211m
at mid-season. Submaximal YYIR1 HR was 90.9 ± 4.2% HR
max at preseason, higher
than at the start, middle and end of the season (87.0 ± 3.9, 85.9 ± 4.1, and 87.0 ± 3.7%
HR
max respectively). Peak YYIR2 performance and minimum YYIR1 HR were 1068
± 193 m and 85.1 ± 3.8% HR
max respectively, with around 50% of the players peaking
at mid-season.
[email protected] 06 Aug 2018
FITNESS IN SOCCER
Fitness testing
144
30-15 INTERMITTENT FITNESS TEST (30-15 IFT)
The 30-15 Intermittent Fitness Test (30-15 IFT) was designed by Buchheit (2008)
to replicate the intermittent demands of soccer. This test differs from the Yo-Yo IR
tests, however, in that it involves 30s of running followed by 15s of walking.
Fig. 8.9: 30-15 Intermittent Fitness Test
- Aim: To measure the ability to recover and repeat intermittent activity
- Procedure: Mark a 40m area with cones at each end and also at the midpoint
(20m). Place cones 3m before each end line and either side of the mid-line (tole-
rance zones). The test consists of 30s shuttle runs interspersed with 15s passive
recovery periods (i.e., walking) on a 40m straight runway. The running velo-
city starts at 8 km/h, increasing by 0.5 km/h at every 45s stage thereafter. As
a result, depending on the speed, the participants have to cover an increasing
distance for a given time.
[email protected] 06 Aug 2018
FITNESS IN SOCCER
Fitness testing
145
Players line up behind one of the end lines (line A). They begin to run on the first
“beep,” pacing their efforts so they will be within the 3m mark of line B at the
second “beep.” They then arrive at the next 3m mark (line C) at the third “beep.”
This continues until there is a different, double beep that indicates the end of
the 30s exercise period. Active recovery is then commenced for the next 15s by
walking forwards to the next line and waiting for the next 30s running period
to begin. The test is terminated when participants reach volitional exhaustion or
when an athlete does not make it into the tolerance zone three times.
- Score: The running velocity during the last completed stage is recorded as the
maximum running speed (vIFT). The vIFT is also useful for the prescription of
generic running drills to improve RSA.
The following formula estimates VO
2max based on the final running speed. G
stands for gender (female = 2; male = 1), A for age, and W for weight (Buchheit,
2008).
VO
2max (ml/kg/min) =
28.3 – (2.15 x G) – (0.741 x A) – (0.0357 x W) + (0.0586 x A x vIFT) + (1.03 x vIFT)
FOUR-MINUTE SUB-MAXIMAL TEST
In this test, the players run on a motorized treadmill (or use a bike if a treadmill is
unavailable) at 12 km/h for four minutes. At the end of the four minutes, both the
HR and heart rate recovery (HRR) after 30, 60 and 120s are recorded. This makes
it possible to see if a player has recovered well (the HR is lower) and whether his
fitness has improved (the HR is lower and HRR is quicker). This test is ideal for
monitoring the fitness and recovery of players. It can be performed daily and is
easy to administer and carry out.
8.7 ANALYZING TESTING RESULTS
It is clear that regular testing of soccer players is advantageous to coaching staff. It
allows coaches to assess the fitness levels of players and plan appropriate training
throughout the season. However, once a battery of tests has been performed, it is
the job of sports scientists in the support staff to analyze changes in physical per-
formance longitudinally across training periods and seasons.
It has been suggested that analyzing the percentage difference between repeated
tests is a more appropriate method of assessing athletic performance (Hopkins et
al., 2009). This method of analysis also allows for clear comparisons to be made
between changes in different physical abilities, something that is difficult with raw
data.
For example, consider a 5% increase in CMJ and a 7% decrease in 40m sprint time
rather than a 3cm increase in CMJ and 0.5s decrease in 40m sprint time. Using per-
centage differences allows for more meaningful and clear conclusions to be made
about physical abilities.
[email protected] 06 Aug 2018
FITNESS IN SOCCER
Fitness testing
146
Additionally, a method for assessing the true change in athletic performance using
the smallest worthwhile change (SWC) statistic has been suggested (Batterham
and Hopkins, 2006). This is calculated by multiplying the between-player standard
deviation by 0.2. This creates a raw data unit that a player must meet in order for
an improvement in performance to be substantial. Again, this can then be made
into a percentage SWC.
Test 1
Re-Test
% Change
Player 1
1800
1900
5.6%
Substantial improvement
Player 2
1850
1830
-1.1%
Trivial decrease
Player 3
1900
2200
10.5%
Substantial improvement
Player 4
2000
2300
1%
Trivial improvement
Player 5
2100
2000
-7.1%
Substantial decrease
Player 6
1750
2000
0%
No Improvement
Player 7
1800
1950
8.3%
Substantial improvement
Average
1885.7
1928.6
2.3%
Substantial improvement in
team performance
Standard Deviation
124.9
116.3
SWC
25
% SWC
1.3%
Table 8.10: Example of an intermittent performance test using the SWC. The SWC statistic allows
sport science and support staff to categorize changes in performance and make meaningful
conclusions about individual and team performance over time.
[email protected] 06 Aug 2018
FITNESS IN SOCCER
Fitness testing
147
SUMMARY
By monitoring the physical abilities of soccer players on a consistent basis,
sports physiologists and soccer coaches can gain valuable information that can
be then used effectively to optimize training and recovery. The tests chosen must
be specific, valid, and reliable. Soccer-specific endurance, strength, power, speed
and agility tests provide a good framework when assessing the physical abilities
of soccer players. When carried out in the correct manner, and with appropriate
feedback given to the players, testing can become an integral part of the soccer
training program. Strategically timed testing throughout the calendar year can
help motivate players to improve their individual physical characteristics, ulti-
mately helping team performance.
REFERENCES
•
Augustsson, S.R., Bersas, E., Thomas, E.M., Sahlberg, M., Augustsson, J. and Svantesson, U., 2009. Gender differences and reliability of
selected physical performance tests in young women and men. Advances in Physiotherapy, 11, pp.64-70.
•
Axler, C.T. and McGill, S.M., 1997. Low back loads over a variety of abdominal exercises: searching for the safest abdominal challenge.
Med Sci Sports Exerc, 29(6), pp. 804-811.
•
Baechle, T.R. and Earle, R.W., 2000. Essentials of strength training and conditioning. Champaign, IL: Human Kinetics.
•
Ball, N.B. and Zanetti, S., 2012. Relationship between Reactive Strength Variables in Horizontal and Vertical Drop Jumps. Journal of
Strength and Conditioning Research, 26(5), pp.1407–1412.
•
Bangsbo, J., 1992. Time and motion characteristics of competition soccer. In: T. Reilly and F. Korkusuz, eds. 1992. Science Football (vol
6). London, UK: Routledge. pp.34–40.
•
Bangsbo, J., 1994. The physiology of soccer: With special reference to intense physical exercise. Acta. Physiol. Scand., 150, pp.1–156.
•
Bangsbo, J., Mohr, M. and Poulsen, A., 2006. Training and testing the elite athlete. J Exerc Sci Fitness, 4(1), pp.1-14.
•
Batterham, A.M. and Hopkins, W.G., 2006. Making meaningful inferences about magnitudes. Int J Sports Perf Physiol Perf, 1, pp.50-57.
•
Beekhuizen, K., Davis, M., Kolber, M. and Cheng, M.S., 2009. Test-Retest Reliability and Minimal Detectable Change of the Hexagon
Agility Test. Journal of Strength and Conditioning Research, 23(7), pp.2167-2171.
•
Bradley, P., Di Mascio, M., Peart, D., Olsen, P. and Sheldon. B., 2010. High-intensity activity profiles of elite soccer players at different
performance levels. Journal of strength and condition research, 24(9), pp.2343-2351.
•
Buchheit, M., 2008. The 30-15 Intermittent Fitness Test: Accuracy for Individualizing Interval Training of Young Intermittent Sport Play-
ers. Journal of Strength and Conditioning Research, 22(2), pp.365-374.
•
Caldwell, B.P. and Peters, D.M., 2009. Seasonal variation in physiological fitness of a semiprofessional soccer team. J Strength Cond Res,
23(5), pp.1370-1377.
•
Clark, N., 2001. Functional performance testing following knee ligament injury. Physical therapy in Sport, 2, pp.91-105.
•
Cronin, J.B. and Owen, G.J., 2004. Upper-body strength and power assessment in women using a chest pass. Journal of Strength and
Conditioning Research, 18(3), pp.401-404.
•
Draper, J.A. and Lancaster, M.G., 1985. The 505 test: a test for agility in the horizontal plane. Aust J Sci Med Sport, 17(1), pp.8-15.
•
Getchell, B., 1979. Physical Fitness: A Way of Life (2nd ed). New York: John Wiley
•
Harman, E.,. Principles of test selection and administration. In: T.R. Baechle and R.W. Earle eds. 2008. Essentials of Strength Training and
Conditioning (3rd ed). Champaign, IL: Human Kinetics. pp.238–246.
•
Hoffmann, J., 2006. Norms for Fitness, Performance, and Health. Champaign, IL: Human Kinetics.
•
Hopper, D.M., Goh, S.C. and Wentworth, L.A., 2002. Test-retest reliability of knee rating scales and functional hop tests one year follo-
wing anterior cruciate ligament reconstruction. Phys Ther Sport, 3, pp.10–18.
•
Kennedy, M.D., Fischer, R., Fairbanks, K., Lefaivre, L., Vickery, L., Molzan, J. and Parent, E., 2012. Can pre-season fitness measures
predict time to injury in varsity athletes?: a retrospective case control study. Sports Medicine, Arthroscopy, Rehabilitation, Therapy &
Technology, 4(26), pp.1758-2555-4-26.
•
Kollath, F. and Quade, K., 1993. Measurement of sprinting speed of professional and amateur soccer players. In: T. Reilly, T. Clarys and
A. Stibbe, eds. 1993. Science and soccer II. London: E&FN Spon. p.31.
•
Kotzamanidis, C., Chatzopoulos, D., Michailidis, C., Papaiakovou, G. and Patikas, D., 2005. The Effect of a Combined High-Intensity
Strength and Speed Training Program on the Running and Jumping Ability of Soccer Players. Journal of Strength and Conditioning
Research, 19(2), pp.369–375.
•
Krustrup, P., Mohr, M., and Amstrup, T., 2003. The Yo-Yo intermittent recovery test: physiological response, reliability and validity. Med
Sci Sports Exerc, 35(4), pp.697-705.
•
Krustrup, P., Mohr, M., Nybo, L., Jensen, J.M., Nielsen, J.J. and Bangsbo, J., 2006. The Yo-Yo IR2 test: physiological response, reliability,
and application to elite soccer. Medicine & Science in Sports & Exercise, 38(9), pp.1666-73.
•
Landis, J.R. and Koch, G.G., 1977. The measurement of observer agreement for categorical data. Biometrics, 33, pp.159-174.
•
Leger, L. and Lambert, J., 1982. A maximal 20-m shuttle run test to predict V02max. European Journal of Applied Physiology, 49, pp.1-12.
•
Little, T. and Williams, A.G., 2003. Specificity of acceleration, maximum speed and agility in professional soccer players. In: Fifth World
Congress of Science and Football, Madrid: Gymnos, pp.144–145.
•
Little, T. and Williams, A.G., 2005. Specificity of acceleration, maximum speed, and agility in professional soccer players. J. Strength
Cond. Res., 19(1), pp.76–78.
•
Mirkov, D., Nedeljkovic, A., Kukolj, M., Ugarkovic, D. and Jaric, S., 2008. Evaluation of the reliability of soccer-specific field tests. Journal
of Strength and Conditioning, 22(4), pp.1046-1050.
•
Mohr, M. and Krustrup P., 2013. Yo-Yo intermittent recovery test performances within an entire football league during a full season. J
Sports Sci., [Epub ahead of print].
•
Moore, A. and Murphy, A., 2003. Development of an anaerobic capacity test for field sport athletes. Journal of Science and Medicine in
Sport, 6(3), pp.275–284.
•
Noyes, F.R., Barber, S.D. and Mangine, R.E., 1991. Abnormal lower limb symmetry determined by function hop tests after anterior cruci-
ate ligament rupture. Am J Sports Med, 19, pp.513–518.
[email protected] 06 Aug 2018
FITNESS IN SOCCER
148
Fitness testing
•
Pacheco, L., Balius, R., Aliste, L., Pujol, M. and Pedret, C., 2011. The Acute Effects of Different Stretching Exercises on Jump Performance.
Journal of Strength and Conditioning Research, 25(11), pp.2991-2998.
•
Parfrey, K.C., Docherty, D., Workman, C. and Behm, D.G., 2008. The effects of different sit and curl-up positions on activation of abdomi-
nal and hip flexor musculature. Appl Physiol Nutr Metab, 33, pp.888-895.
•
Pauole, K., Madole, K., Garhammer, J., Lacourse, M. and Rozenek, R., 2000. Reliability and Validity of the T-Test as a Measure of Agility,
Leg Power, and Leg Speed in College-Aged Men and Women. Journal of Strength & Conditioning Research, 14(4), pp.443-450.
•
Rampinini, E., Coutts A.J. and Castagna, C., 2007. Variation in top-level soccer match performance. Int J Sports Med, 28, pp.1018–24.
•
Ramsbottom, R., Nevill, M.E., Nevill, A.M. and Hazeldine, R., 1997. Accumulated oxygen deficit and shuttle run performance in physi-
cally active men and women. Journal of Sports Sciences, 15(2), pp.207-214.
•
Reilly, T., 2003. Environmental stress. In: T. Reilly and A.M. Williams eds. 2003. Science and Soccer (2nd ed.). London: E. & F.N. Spon.
pp. 165-184.
•
Reilly, T. and Doran, D., 2003. Fitness Assessment. In: T. Reilly and M.A. Williams, eds. 2003. Science and Soccer. Routeledge: New
York. pp.21-47.
•
Ross, A. and Leveritt, M., 2001. Long-term metabolic and skeletal muscle adaptations to short-sprint training: implications for sprint
training and tapering. Sports Med., 31(15), pp.1063-82.
•
Sassi, R.H., Dardouri, W., Yahmed, M.H., Gmada, N., Mahfoudhi, M.E. and Gharbi Z., 2009. Relative and absolute reliability of a modi-
fied agility T-test and its relationship with vertical jump and straight sprint. J Strength Cond Res, 23(6), pp.1644-51.
•
Scott, C.B., Roby, F.R., Lohman, T.G. and Bunt, J.C., 1991. The maximally accumulated oxygen deficit as an indicator of anaerobic perfor-
mance. Medicine and Science in Sports and Exercise, 23, pp.618-624.
•
Sporis, G., Ruzic, L.E. and Leko, G., 2008. The anaerobic endurance of elite soccer players improved after a high-intensity training inter-
vention in the 8-week conditioning program. Journal of Strength and Conditioning Research, 2(2), pp.559-66.
•
Thomas, A., Dawson, B. and Goodman, C., 2006. The yo-yo test: reliability and association with a 20-m shuttle run and VO2max. Inter-
national Journal of Sports Physiology and Performance, 2, pp.137-149.
•
Tomlin, D.L. and Wenger, H.A., 2001. The relationship between aerobic fitness and recovery from high intensity intermittent exercise.
Sports Medicine, 31(1), pp.1-11.
•
van der Harst, J.J., Gokeler, A. and Hof, A.L., 2007. Leg kinematics and kinetics in landing from a single-leg hop for distance. A compari-
son between dominant and non-dominant leg. Clin. Biomech, 22, pp.674-680.
•
Verheijen, R., 2010. Handbuch fur Fussballkondition. In: G. Sporis, I. Jukic, L. Milanovic and V. Vucetic, eds. 2010. Reliability and factorial
validity of agility tests for soccer players. J Strength Cond Res, 24(3), pp.679–686.
•
Viru, A. and Viru, M., 2001. Biochemical Monitoring of Sports Training. Champaign, IL: Human Kinetics.
•
Vossen, J.F., Kramer, J.F., Burke, D.G. and Vossen, D.P., 2000. Comparison of dynamic push-up training and plyometric push-up training
on upper-body power and strength. Journal of Strength and Conditioning Research, 14, pp.248-253.
•
Walshe, A.D., Wilson, G.J. and Murphy, A.J., 1996. The validity and reliability of a test of lower body musculotendinous stiffness. Eur J
Appl Physiol, 73, pp.332–339.
•
Wragg, C.B., Maxwell, N.S. and Doust, J.H., 2000. Evaluation of the reliability and validity of a soccer-specific field test of repeated sprint
ability. Eur J Appl Physiol, 83, pp.77-83.
[email protected] 06 Aug 2018
FITNESS IN SOCCER
Heart rate and GPS monitoring in soccer
149
9
HEART RATE AND
GPS MONITORING IN SOCCER
Werner Helsen, Jan Van Winckel, Kenny McMillan, Jean-Pierre Meert,
Andre Aubert, Pim Koolwijk, Peter Catteeuw, Arne Jaspers, David Tenney
9.1 INTRODUCTION
Heart rate (HR) refers to the number of heartbeats in a set unit of time and is usu-
ally expressed as beats per minute (bpm). HR increases or decreases in response to
the demands of the body in order to balance the requirement and delivery of oxy-
gen. HR is modulated through the autonomic nervous system and the interaction
of sympathetic and parasympathetic outflow. Sympathetic stimulation increases
HR, while parasympathetic stimulation decreases it. Over the last two decades, HR
monitors have been widely used in soccer. Using HR measurement as an indirect
marker of O
2 consumption has become a valuable, easy-to-use and relatively inex-
pensive tool for measuring the internal training load imposed on soccer players.
Validity and reliability have been shown to be good for HR monitors when com-
pared to ECG measurements for measurement of both HR and heart rate variabi-
lity (HRV) (Achten and Jeukendrup, 2003; Kingsley et al., 2005). Recently, technical
development has focused on real-time monitoring instead of the post-exercise eva-
luation of recorded data (Schönfelder et al., 2011).
9.2 USE OF HEART RATE AS AN INDIRECT MEASURE FOR OXYGEN
CONSUMPTION
Physical activity may be best assessed by measuring the oxygen uptake (VO
2)
during exercise. However, this is not very practical to achieve on a soccer field.
Research has shown a linear correlation to exist between oxygen uptake and HR.
The load resulting from physical activity can therefore be measured by using the
HR as an indirect measure of oxygen consumption This comparison is represented
in the Swain formula (Swain et al., 1994):
%HR
max = 0.64 x %VO2max + 37
Example: A player has a maximal oxygen uptake (VO
2max) of 55 ml/min/kg.
The coach wants to train at 60% of VO
2max, so the calculation is
0.64 x (0.6 x 55) + 37 = 58% of HR
max.
For example, if the HR
max is 200 bpm, the player needs to train at 116 bpm.
[email protected] 06 Aug 2018
FITNESS IN SOCCER
Heart rate and GPS monitoring in soccer
150
max
b
b
9.3 RESTING HEART RATE (HRr)
Resting heart rate (HRr) in adults is 60–80 bpm on average, but in elite soccer
players, it can vary between 40 and 70 bpm. According to the French newspaper
l’equipe, professional cyclist Miguel Indurain had a HRr of 28 bpm. HRr is modu-
lated by the autonomic nervous system, by the parasympathetic branch in parti-
cular. The nervous system ensures a controlled, consistently low HR. One of the
most pronounced cardiovascular adaptations to endurance training is a lower HRr.
This occurs through an increase in parasympathetic or vagal tone (Smith, 1987). A
decrease in HR is not only the result of increased sensitivity of the parasympathe-
tic nervous system but also a consequence of greater plasma volume and higher
stroke volume. An increase in HRr has been suggested as a way of detecting fati-
gue and monitoring overtraining (Budgett, 1998). Bosquet et al. (2008) suggested
in their review that an increase in HRr may be used as a valid sign of short-term,
but not long-term, fatigue. Although nocturnal HRV, rather than HRr, values could
be better indicators of cumulated physical fatigue (Pichot et al., 2000), this requires
monitoring HR during sleep, which may prove uncomfortable and impractical for
athletes in the long term (Robson-Ansley et al., 2009).
9.4 MAXIMUM HEART RATE (HR )
HR
max is determined by genetic factors, and it decreases gradually from the age
of 20 in untrained people, with it decreasing slower in well-trained individu-
als. HR
max can be measured by a maximal incremental exercise test. It can be also
estimated using various methods (Tanaka, 1991; Bruce, 1974; Londeree, 1982).
A brief review of various HR
max prediction formulas revealed that the majority of
age-based prediction equations have large prediction errors (>10 bpm) (Robergs
and Landwehr, 2002). HR
max can also be estimated on the basis of a simple test,
albeit for well-trained soccer players only. Warm up for 10–15 minutes followed
by 3–4 minutes running at a tempo of 75–80% HR
max and finally 30–45 seconds of
maximum physical load (maximal sprint). HR
max is then measured immediately
after this sprint.
9.5 LACTATE THRESHOLD
9.5.1 Lactate
Blood lactate concentration ([La−] ) is the result of the production and removal of
lactate. Lactate is formed continuously, under both aerobic and anaerobic conditi-
ons, as a result of substrate supply and equilibrium dynamics (Brooks, 1998). When
the rate of ATP production by oxidative pathways is insufficient to respond to the
demands of physical activity, high rates of glycolytic (from blood glucose) or glyco-
genolytic (from muscle glycogen) ATP production are essential to prolong physical
activity. The end product of glycolysis is pyruvate, which can be reduced to lactate
or oxidized to H
2O or CO2. During increasing exercise intensities, the muscles pro-
duce more lactate, which is subsequently released into the blood plasma. [La−]
is the result of the production of lactate from working muscles and tissues, and
the removal of lactate in the muscles, liver, renal cortex and heart (Brooks, 2007).
During steady-state physical activity, lactate production (influx) equals lactate
[email protected] 06 Aug 2018
FITNESS IN SOCCER
Heart rate and GPS monitoring in soccer
151
b
b
removal (outflux), resulting in a constant lactate concentration (Moxnes and Haus-
ken, 2009). At exercise intensities above a steady state, a rise in the concentration
can be attributed to either an increase in the rate of lactate production or a decrease
in the rate of lactate removal (Moxnes et al., 2012). The lactate concentration in the
blood [La−] is measured in millimoles per liter of blood, which is abbreviated to
mmol/L.
9.5.2 Aerobic threshold
The aerobic threshold is sometimes defined as the exercise intensity at which
[La−] reaches an arbitrary concentration of 2 mmol/L. This occurs approxima-
tely at a HR of 20-40 bpm less than the anaerobic threshold and around 60–70%
of HR
max. During this phase, the requirement and supply of oxygen is balanced.
Steady-state physical activity is approximately between 2 and 4 mmol/L.
Fig. 9.1: Blood lactate accumulation for different intensities
During low-intensity exercise, lactate is processed or re-used in the form of pyru-
vate in the less active muscles. As the intensity of the exercise increases, lactate
production exceeds lactate removal. Consequently, lactate starts to accumulate in
the muscles.
9.5.3 Lactate threshold
The lactate threshold (LT), the onset of blood lactate accumulation (OBLA), anaero-
bic threshold (AT) or lactate inflection point (LIP) is the exercise intensity at which
lactate starts to exponentially accumulate in the blood. You will also sometimes
encounter the term maximal lactate steady state (MLSS), which is defined as the
highest exercise intensity where there is a balance between the rate of lactate appea-
rance in the blood and its rate of removal (Jones and Doust, 1998; Denadai, 2005).
Some studies postulated that the MLSS corresponds to a mean concentration of
4 mmol/L (Heck et al., 1985, Poole et al., 1988). However, individual variability
in this concentration has been observed (Steggman et al., 1981). Different indices
[email protected] 06 Aug 2018
FITNESS IN SOCCER
Heart rate and GPS monitoring in soccer
152
related to blood lactate response to exercise are some of the most widely used para-
meters for exercise prescription in soccer. Helgerud et al. (2007) demonstrated that
high-intensity aerobic training increased LT in soccer players. In addition, Coyle
(1995) suggested that the prescription of appropriate exercise intensity is more
accurate when the blood lactate response to exercise is used.
Fig. 9.2: Theoretical presentation of lactate accumulation in the muscle
Above the LT, lactate accumulation increases exponentially and can increase to
10-15 mmol/L in soccer players (Reilly and Korkusuz, 2008). Regular high-inten-
sity physical activity results in a certain degree of mental toughness, enabling the
athlete to tolerate higher lactate values for longer.
Fig. 9.3: Shift in the lactate curve. Training causes the lactate curve to shift for the same intensity.
[email protected] 06 Aug 2018
FITNESS IN SOCCER
Heart rate and GPS monitoring in soccer
153
b
b
b
b
9.6 RELATING THE LACTATE CURVE TO THE HEART RATE
Training zones are designed in modern TRIMP calculations based on [La−] , oxygen
uptake, and HR data. We can demonstrate this using the case discussed below
(Fig. 9.4).
In this graph, the initial [La−] level is 2 mmol/L. The lactate level decreases in this
first phase due to the muscles working and lactate being actively processed. When
intensity starts to increase, lactate starts to accumulate.
✓ Aerobic threshold:
– [La−] : 2.5 mmol/L
– HR: 125 bpm
– load: 12.1 km/h
✓ Lactate threshold:
– [La−] : 4.3 mmol/L
– HR: 154 bpm
– load: 14.2 km/h
Fig. 9.4: Determining HR zones
This graph shows the results of an incremental exercise test (on a treadmill). The
player starts the test at 8 km/h and ends the test at a speed of 18 km/h. The graph
represents the lactate values, intensity (in km/h) and HR. The aerobic and lactate
threshold can be estimated using this graph. In this example, the aerobic threshold
could be set at 4.3 mmol/L (154 bpm) and the intensity is 14.2 km/h.
[email protected] 06 Aug 2018
FITNESS IN SOCCER
Heart rate and GPS monitoring in soccer
154
9.7 INTERPRETING HR MEASUREMENT
There are also other factors that influence HR. Although this complicates the inter-
pretation, knowledge of the factors set out below should enable coaches to correctly
analyze training. The following factors can cause a small degree of variability in HR:
- Altitude: Because the barometric pressure of air is lower at altitude than at sea
level, the heart has to work harder to transport the same amount of oxygen to
the muscles.
- Quantity of active muscle tissue: The more muscles that are used during physi-
cal activity, the higher the HR. Running therefore induces a higher HR than
cycling (Millet et al., 2009).
- Upper body/lower body: Physical activity using the arms results in a higher HR
compared to isolated physical activity of the legs.
- Ambient temperature and humidity: Temperature and humidity will affect
HR. As the ambient temperature rises or the air gets more humid, HR will gra-
dually increase throughout physical activity, even when maintaining the same
pace. Humidity reduces the effectiveness of sweating, resulting in increased
body temperature and a consequent increase in HR.
- Psychological stress: Stress affects the cardiovascular system. Psychological
stress increases HR.
- Medication or illness: HR is usually higher in cases of illness, and medication
can also influence HR.
- Eating: After a meal, HR increases to aid with digestion. More blood is directed
toward the gastrointestinal tract to process the food.
- Cardiac drift: HR will gradually increase during physical exercise carried out at
a constant speed. This phenomenon is referred to as cardiac drift.
- Age: HR
max decreases as people get older due to the physiological effects of
aging.
- Dehydration and nutrition: Dehydration causes HR to rise as the blood volume
decreases and the body runs low on the fluids needed to maintain body tem-
perature. Dehydration can occur in cold as well as hot environments. A lack of
glycogen also results in the same effect.
- Gender: Women typically have a higher HR than men.
- Caffeine—found in coffee, teas and some sodas—mimics the effect of adrena-
line, a natural hormone in the body that is responsible for elevating HR. Other
stimulants, such as cocaine and ephedrine, work in a similar manner.
Fig. 9.5: Cardiac drift. Although the
soccer player runs constantly at the
same speed, HR slowly increases
over time and fluctuations are
irregular. This phenomenon is known
as cardiac drift.
[email protected] 06 Aug 2018
FITNESS IN SOCCER
Heart rate and GPS monitoring in soccer
155
250
200
150
100
50
0
Test 1
Test 2
b
9.8 EFFECT OF TRAINING ON HEART RATE AND LACTATE ACCUMULATION
Take the example of the soccer player we tested in preseason. We saw that his speed
at LT was 14.2 km/h. We tested the same player again after two months of training
(three weeks in-season). Fig. 9.6 and 9.7 show the values obtained.
Fig. 9.6: Effect of training on lactate accumulation
8
10
12
14
16
18
75
98
127
156
178
197
70
84
118
146
165
197
Fig. 9.7: Effect of training on HR
These two graphs show the progression after two months of training.
The effects of training, compared with the first test, were:
• The player runs at the same speed (intensity) with a lower HRex.
• [La−] accumulation is lower for the same velocity.
• Aerobic and lactate threshold have risen.
H
e
art
r
a
te
(b
p
m
)
[email protected] 06 Aug 2018
FITNESS IN SOCCER
Heart rate and GPS monitoring in soccer
156
9.9 AUTONOMIC NERVOUS SYSTEM
The autonomic nervous system (ANS), also referred to as the vegetative nervous
system, regulates a number of bodily functions, such as respiration, digestion and
cardiac function. The ANS works autonomously and is therefore not consciously
controlled. The ANS actually consists of two systems, the sympathetic system (the
“fight or flight” system) and the parasympathetic system (the “rest and digest”
system). The two systems complement each other, functioning alternately and in
opposite directions and working closely together with the hormonal system. The
sympathetic system is the body’s gas pedal, as it were, enabling us to perform.
Adrenaline levels, HR, blood pressure, and respiratory rate increase, and then the
body consumes more energy. The parasympathetic system can, in turn, be regar-
ded as the brake. It is responsible for recovery, rest and energy replenishment. In
healthy athletes, the two systems are in balance, with moments of exercise (sympa-
thetic system) alternating with recovery moments (parasympathetic system).
Devices like iThlete, BioForce and OmegaWave are designed to measure the res-
ponse of the ANS. The functioning of this system is measured by way of ECG
readings of varying duration via appropriate software. HR readings also give an
idea of the sympathetic/parasympathetic balance.
9.9.1 Heart rate variability (HRV)
The development of technology in soccer has progressed very quickly over the last
decade. These technological aids enable the coach to better evaluate the players’
response to a given training load, as well as their fitness and freshness. Heart rate
variability (HRV) is one of these means. HRV entails the non-invasive measuring of
the R-R intervals between two QRS intervals (heartbeats). These intervals can give
the coach an insight into the status of the ANS.
9.9.2 Regulation of the heart
HR is regulated by the sinus node, which is also referred to as the heart’s “pace-
maker.” This is a group of specialized cells located in the right atrium of the heart.
The sinus node creates its own stimuli and is under the direct influence of the ANS.
In the body, the regulation of the heart is extensively determined by the balance
between the parasympathetic (enhanced vagal tone) and the sympathetic nervous
system.
At rest, the sinus node produces around 100–120 impulses. However, these impul-
ses are influenced by parasympathetic function, resulting in HR falling to around
55–70 bpm when resting. At rest, the body is almost entirely under the influence of
the parasympathetic nervous system, with the sympathetic nervous system taking
over when physical activity increases. What is remarkable in this regard is that the
time interval between two heartbeats is very irregular (HRV) when resting, while
the time interval during physical activity is more regular.
9.9.3 The autonomic nervous system as a regulator for exertion and
recovery
HRV, a marker of parasympathetic activity, is an accepted term to describe variati-
ons in both instantaneous HR and RR-interval (Task Force of the European Society
of Cardiology and the North American Society of Pacing and Electrophysiology).
[email protected] 06 Aug 2018
FITNESS IN SOCCER
Heart rate and GPS monitoring in soccer
157
Measuring HRV provides an insight into the relationship between the sympathe-
tic and the parasympathetic systems, which is important for, among other things,
development, diagnosis, and the prevention of overtraining, as well as for general
health. In common practice, HRr is monitored in order to detect overtraining. An
increase of a few beats is, however, difficult to interpret because of the influence of
numerous factors, such as circadian rhythms and mental stress.
Anticipation of physical activity inhibits the activity of the vagus nerve and incre-
ases sympathetic activity. The increase in sympathetic activity and the lowering of
parasympathetic activity cause the HR to rise. During physical activity, the vagal
activity (and associated parasympathetic activity) diminishes and sympathetic acti-
vity increases. As players increase their physical fitness, a number of changes occur
in the balance between the sympathetic and the parasympathetic nervous systems.
First of all, the parasympathetic system continues working for longer, meaning
the HR will be lower for a corresponding intensity. However, the influence of the
parasympathetic system also affects recovery. Finally, the parasympathetic system
ensures that HRV remains high, even at higher intensity. A High HRV is, for this
reason, a good value indicator of the preparedness of an athlete.
The effects of the parasympathetic system in well-trained athletes are:
• The parasympathetic system continues working for longer in well-trained ath-
letes, resulting in an athlete’s HR being lower for a similar intensity.
• HR will recover more quickly after physical activity because of increased func-
tioning of the parasympathetic system.
• HRV remains high during physical activity.
An imbalance in the equilibrium between load and load tolerance will shift the
ANS towards sympathetic dominance. This dominance can lead to exhaustion of
the endocrine system. This depletion will then later lead to an excessive parasym-
pathetic dominance, especially when athletes are given insufficient opportunity for
recovery.
9.9.4 Use of heart rate to measure the functioning of the autonomic
nervous system
To make progress in soccer, periods of appropriate training have to be alternated
with periods of recovery. If there is no balance between the two, players quickly
become either overtrained or detrained. Both of these scenarios have a negative
effect on performance. The functioning of the ANS can be measured indirectly via
the heart rate during exercise (HRex), heart rate recovery (HRR) and HRV. In gene-
ral, a decrease in submaximal HRex, an increase in HRR and increased vagal-re-
lated HRV indices are all well-accepted markers of improved aerobic fitness
(Lamberts et al., 2009; Buchheit et al. 2012). On the other hand, opposite changes in
these HR measures have been demonstrated to be indicators of impaired physical
performance (Achten and Jeukendrup, 2003; Mujika, 2001; Bosquet et al., 2008). As
previously mentioned, a lower HRex, faster HRR and greater HRV are all linked
to improvements in fitness. To measure a player’s fitness during the season, it is
important that measurements can be carried out easily and inexpensively and do
not require too much effort from the players.
[email protected] 06 Aug 2018
FITNESS IN SOCCER
Heart rate and GPS monitoring in soccer
158
9.9.4.1
HRex
A low submaximal HR for the same exercise intensity is one of the most com-
monly observed adaptations to endurance training (Andrew et al., 1966). In a study
on highly trained young handball players, a two-month high-intensity training
intervention induced a 5% decrease in HRex and 10–20% increases in HRR and
post-exercise HRV (Buchheit et al., 2008).
9.9.4.2
HRV as an indicator of fatigue and recovery
Overtraining and extraneous stressors can induce changes in the functioning of
the ANS (Lehman, 1993). HRV can be used to measure the balance between sym-
pathetic and parasympathetic activity. Marsland et al. (2007) were some of the first
to demonstrate the relationship between parasympathetic dominance and lower
cytokine levels and reduced inflammation. A larger stroke volume and an incre-
ased parasympathetic response have been suggested to induce changes in the HRV
observed within 24–48 hours after exercise (Buchheit et al., 2009).
A relationship clearly exists between recovery after exercise and the endocrine and
immune responses of the body. Research has shown, for example, that excessively
long sympathetic dominance goes hand in hand with muscle injuries, while redu-
ced vagal activity (parasympathetic activity) of the heart is associated with illness
and risk of sudden death. A state of detraining, as well as fatigue, is associated with
a lowering of HRV. This often manifests itself in illness or symptoms of overload.
Low HRV can therefore predict possible illnesses or diseases. HRV can be low prior
to an illness, which means it could be a good indicator for detecting high levels of
fatigue or exhaustion. What is also striking is that top athletes have fewer fluctua-
tions in their HRV than less-gifted athletes, probably because they are accustomed
to dealing with higher training loads.
Another interesting finding in a study by Buchheit (2009) was that following CWI
(cold-water immersion), the parasympathetic system was reactivated after supra-
maximal intensity. The researchers suggested that CWI was effective in resetting
the ANS. Massage may have a similar effect, and research has indeed shown that
HRV and the parasympathetic system improved after massage (Tritton, 1993).
9.9.4.3
Heart rate recovery (HRR)
Although both HRV and HRR provide useful information concerning the balance
in the ANS, the two have different origins. An increase in the vagal tone, because
of the reduction in sympathetic activity, is shown during the first few minutes after
physical activity. Because HRV recovery (recovery from high HRV) is caused by
the functioning of the vagus nerve and HRR is caused by the discontinuation of
sympathetic activity, results can differ between HRR and HRV recovery. Recent
research has shown that VO
2max is correlated to HRR but not to HRV. Although
both indicate a good fitness level, they have different origins and can differ for this
reason.
In an interesting study, Buchheit et al. (2012) monitored changes in physical per-
formance with HR measures in young soccer players. They found that substantial
improvements in submaximal HRex (but not HRR) are highly predictive of impro-
vements in maximal aerobic speed. Conversely, changes in HRR were moderately
associated with changes in repeated sprint performance. The researchers postu-
lated that the magnitude of the associations observed were too low to accurately
[email protected] 06 Aug 2018
FITNESS IN SOCCER
Heart rate and GPS monitoring in soccer
159
predict a player’s trainability. Additionally, baseline values of submaximal exercise
HR, HRR and post-exercise HRV measures obtained before the start of preseason
moderately correlated with changes in most of the performance variables over the
entire season (i.e., cardiorespiratory but also neuromuscular-related performan-
ces), which suggests these measures could be of interest for player screening.
9.10 EXAMPLES OF HEART RATE INTERPRETATION
Fig. 9.8: The graph above represents four players performing an aerobic fitness test.
The graph above represents four players performing an aerobic fitness test. The
black and white lines represent two fast wingers with low aerobic fitness and
VO
2max of less than 60 ml/kg/min. The light gray line represents a midfield player
with a VO
2max of 67 ml/kg/min and excellent aerobic fitness.
The dark gray line is an experienced midfield player who has already played at
the top level for several years. He has a VO
2max of 63 ml/kg/min. In the first round
(warm up), all players run together at the same speed. The “black” and “white”
players have higher relative heart rates (as a percentage of HR
max) than the “dark
gray” and “light gray” players. This could possibly be due to a higher HR at lactate
threshold. The fact that the HR of both the black and white players increase while
the heart rates of the light gray and dark gray players stay relatively stable could
indicate that those players have a weaker fitness. This is confirmed by their HRR,
which is slower than those of the light gray and dark gray players. The aerobic fit-
ness test starts after five minutes of recovery. The aim of the test is to finish the lap
as fast as possible (maximal test). The light gray player is the first to finish the test,
while the black and white players finish together and the dark gray player comes
in last. Without HR figures, it could be concluded that the dark gray player is not as
fit. However, it is clear that this player did not perform a maximal test. His HR
max
does not rise above 90%. The light gray player has also run a submaximal test. His
aerobic endurance is, however, better than that of the dark gray player, which is
why he covers the distance faster. The black and white players both performed a
[email protected] 06 Aug 2018
FITNESS IN SOCCER
Heart rate and GPS monitoring in soccer
160
maximal test. Their time, however, is less than that of the light gray player because
of their lower levels of fitness. It is noticeable that increasing fatigue also causes the
HR to rise as the distance covered increases. The interpretation of the recovery is
also interesting. The light gray player, with a high VO
2max and a high level of aerobic
endurance, recovers substantially quicker than the other players. The recovery of
the two fast wingers (white and black lines) is slower, and after 7–8 minutes, their
HRs have still not fallen below 60% of their maximum HRs.
Fig. 9.9: Example of a submaximal Yo-Yo ISRT test for a Dutch international player.
The player was tested at the beginning of the season and again after a few weeks
in preseason (Figure 9.9). The player’s HR is distinctly lower for the same intensity
(HRex). This demonstrates an increased physical fitness and increased parasym-
pathetic dominance. This results in a reduced TRIMPavg as an indicator of lower
mean HRex. Recovery after completion of the submaximal test is also quicker after
a few weeks of training. This confirms the improvement in fitness.
[email protected] 06 Aug 2018
FITNESS IN SOCCER
Heart rate and GPS monitoring in soccer
161
Fig. 9.10: Training session with a 15-minute warm up, ending with a sprint exercise. A passing
exercise is then done for 15’. Finally six games of 4v4 + K are played for 5’ with 2’ rest.
The white player is a central defender with considerable experience (31 years old)
and average fitness. The gray player (24 years of age) is a (fast) striker with a VO
2max
of 56 ml/kg/min and low aerobic fitness. The black player is a relatively young (23
years of age) midfielder with a lot of potential. He trains hard and has a high VO
2max
of 65ml/kg/min.
What is immediately striking in the graphs is the high HR of the gray player. He
reaches a higher HR
max than in the laboratory tests conducted before the start of
preseason. This is not uncommon. Also striking are the lower HR values of the
white player. His internal training load is lower compared to the other two players.
This could mean that his (tactical) position in the SSGs was not demanding enough,
or he was possibly playing the SSGs submaximally. This is seen more often in older
professional players, who avoid exerting themselves maximally in the week so as
to be fresh at the start of the next match. The black line represents a player who
commits himself fully and recovers very well during the breaks. However, the SSGs
are less demanding (a lower internal training load) for him than for the gray player.
When calculating the training load of this session for the three players, the white
player will have the lowest load, the gray player will have the highest training load,
while the black player will have a lower training load than the gray player because
of his high aerobic fitness. It is therefore possible to give the white player an additi-
onal load (exercise) after the session because of the submaximal training. The black
player can also be prescribed an additional exercise because the external load was
too low for his fitness level.
9.11 GPS MONITORING
Global Positioning Systems (GPS) are now more widely utilized by coaches as a
means of quantifying the physical workload of players, so they can optimize the
measurement of training sessions within the athlete monitoring system. GPS can
now be used to “individualize” training loads within the same team. With the addi-
tion of RPE and/or HR readings (Impellizzeri, 2005), this GPS data can be used to
better quantify the individual load (mechanical load), but it can also be compared
to the individual response to that load (internal load). Such information derived
[email protected] 06 Aug 2018
FITNESS IN SOCCER
Heart rate and GPS monitoring in soccer
162
from GPS also allows coaches to view the breakdown of different exercises in order
to optimize a periodized plan and prevent overtraining (and undertraining).
GPS technology and its associated software are now able to provide a coach or
sports scientist with a myriad of metrics and variables. Currently, companies like
Catapult and GPSports have also integrated accelerometers into their GPS units,
with the aim of increasing the validity and reliability of the data acquired from
their technologies. The last ten years have seen major advancements from the less
accurate 1 Hz and 5 Hz units to the increased sampling rates now provided by the
newer 10 Hz and 15 Hz systems.
9.11.1 Reliability and Validity
In the past few years, research has focused on assessing the reliability and vali-
dity of GPS monitoring (Buchheit, 2013). Most research has found that the newer
10 Hz units with upgraded firmware and increased sampling rates have further
improved accuracy and inter-unit reliability (Johnson et al., 2013). While it could be
argued that older 1 Hz and 5 Hz GPS models were valid for longer distances, total
distance, and slower speeds (although not changes of directions) (Jennings et al.,
2010), the latest GPS hardware (10 Hz) has been shown to be six times more accu-
rate at measuring instantaneous velocity than the previous 5 Hz models (Varley et
al., 2011).
9.11.2 Traditional GPS Metrics
As the current GPS technology advances, sports scientists also advance the types of
metrics that are used to quantify performance. Currently, when looking at the cur-
rent research (Johnston, 2013), the performance metrics examined are:
• Total distance covered
• Meters/min
• High-speed distance covered
• Player Load (accelerometry-based)
• Very-high-speed running
• RHIE (repeat high-intensity efforts)
• RSE (repeat sprint efforts)
• Time or distance spent within different velocity bands
Aughey et al. (2013) have also used GPS monitoring during friendly matches and
compared the physical data from these matches against other football codes, such
as rugby and Australian Rules Football, to create a unique perspective into the exact
physiological workload required of a soccer player relative to other sports. This
research seems to support the increased importance of RHIE (repeated high-inten-
sity effort) rather than RSE (repeated speed effort) by including accelerations, dece-
lerations and collisions into the equation as high-intensity activities.
[email protected] 06 Aug 2018
FITNESS IN SOCCER
Heart rate and GPS monitoring in soccer
163
Fig. 9.11: Player Load gives an indication of an
athlete’s total workload. It includes distances and
accelerations/decelerations, as well as changes of direction. There is a clear difference between the
total load in training weeks with one game (W17, W19 (for A-team players) and W22), two games
(W18 and W20) or no game at all due to the international calendar (W21).
Fig. 9.12: In weeks with a midweek game, recovery has priority, and little or no HI-running is
included in training sessions. W21 was a non-game week due to the international calendar, giving
the opportunity for a high HI-running training load.
[email protected] 06 Aug 2018
FITNESS IN SOCCER
Heart rate and GPS monitoring in soccer
164
.
[email protected] 06 Aug 2018
FITNESS IN SOCCER
Heart rate and GPS monitoring in soccer
165
9.11.3 Metabolic Power
A recent development in the area of training load quantification with GPS techno-
logy has been the work into metabolic power carried out by Osgnach (2010) and
di Prampero (2008). The metabolic power approach to training load quantification
begins to view the physiological demand of training sessions from a perspective
of power output and energetic cost. It is measured in W/kg rather than the tradi-
tional work performed at different velocities. When comparing different exercises
measured with “total power” metrics and “total speed” metrics, Gaudino et al.
(2013) found that coaches and sports scientists underestimated training load when
assessing the load just from a velocity perspective. As a result, many GPS compa-
nies are now trying to implement this “metabolic power” metric into their software
for future clients. Some researchers seem to believe that, in the future, metabolic
power metrics may provide a more valid measurement of the true loads required
in drills such as small-sided game play, such as 3v3 and 5v5. The other advantage
of the metabolic power metric is that it seems to be more sensitive to positional dif-
ferences within such games. According to Gaudino and colleagues, the workloads
of central defenders in particular tend to be underestimated with the use of tradi-
tional GPS and velocity-based metrics.
SUMMARY
It is of great importance to measure the training load of soccer training. Internal
load can be measured through the use of HR monitors. Resting HR, the HRex,
HRR, and HRV are tools that can be used to help track the fitness status of the
players. GPS technology can be used to measure the external, mechanical load
of training sessions. Information gleaned from GPS devices also allows coaches
to measure metrics, such as number of accelerations and high-intensity distance
covered, in order to optimize a periodized plan to prevent over- and undertrai-
ning. Training load monitoring is discussed in more detail in the following
chapter.
[email protected] 06 Aug 2018
FITNESS IN SOCCER
166
Heart rate and GPS monitoring in soccer
REFERENCES
•
Achten, J. and Jeukendrup, A.E., 2003. Heart rate monitoring: applications and limitations. Sports Medicine, 33(7), pp.517–538.
•
Andrew, G.M., Guzman, C.A. and Becklake, M.R., 1966. Effect of athletic training on exercise cardiac output. J ApplPhysiol, 21,
pp.603–608.
•
Bosquet, L., Merkari, S., Arvisais, D. and Aubert, A.E., 2008. Is heart rate a convenient tool to monitor over-reaching? A systematic review
of the literature. Br J Sports Med, 42, pp.709–714.
•
Brooks, G.A., 1998. Mammalian fuel utilization during sustained exercise. Comp Biochem Physiol, 120, pp.89–107.
•
Brooks, G.A., 2007. Link between glycolytic and oxidative metabolism. Sports Med, 37, pp.341-343.
•
Bruce, R.A., Fisher, L.D., Cooper, M.N. and Grey, G.O., 1974. Separation of effects of cardiovascular disease and age on ventricular func-
tion with maximal exercise. Am. J. Cardiol., 34(7), pp.757-763.
•
Buchheit, M., Al Haddad, H., Simpson, B.M., Palazzi, D., Bourdon, P.C., Di Salvo, V. and Mendez-Villanueva A., 2013. Monitoring Acce-
lerations With GPS in Football: Time to Slow Down? International Journal of Sports Physiology and Performance, 30.
•
Buchheit M., Millet G.P., Parisy A., Pourchez S., Laursen P.B. and Ahmaidi S., 2008. Supramaximal training and post-exercise parasym-
pathetic reactivation in adolescents. Med. Sci. Sports Exerc., 40, pp.362–371.
•
Buchheit, M., Laursen, P.B., Al Haddad, H. and Ahmaidi, S., 2009. Exercise-induced plasma volume expansion and post-exercise
parasympathetic reactivation. Eur. J. Appl. Physiol., 105, pp.471–481.
•
Buchheit, M., Simpson, M.B., Al Haddad, H., Bourdon, P.C. and Mendez-Villanueva, A., 2012. Monitoring changes in physical perfor-
mance with heart rate measures in young soccer players. European Journal Of Applied Physiology, 112(2), pp.711-723.
•
Buchheit, M., Peiffer, J.J., Abbiss, C.R. and Laursen, P.B., 2009. Effect of cold water immersion on postexercise parasympathetic reactiva-
tion. Am. J. Physiol. Heart Circ. Physiol., 296(2), pp.421-7.
•
Budgett, R., 1998. Fatigue and underperformance in athletes: the overtraining syndrome. Br J Sports Med, 32, pp.107–110.
•
Convertino, V.A., 1991. Blood volume: its adaptation to endurance training. Med Sci Sports Exerc, 23, pp.1338–1348.
•
Coyle, E.F., 1995. Integration of the physiological factors determining endurance performance ability. Exerc. Sport Sci. Rev., 23, pp.25–63.
•
Denadai, B.S., Gomide, E.B.G. and Greco, C.C., 2005. The relationship between onset of blood lactate accumulation, critical velocity, and
maximal lactate steady state in soccer players. J. Strength Cond. Res., 19(2), pp.364–368.
•
di Prampero, P.E., Fusi, S., Sepulcri, L., Morin, J.B., Belli, A. and Antonutto, G., 2005. Sprint running: a new energetic approach. J Exp
Biol, 208, pp.2809–2816.
•
Gaudino, P., Iaia, F.M., Alberti, G., Hawkins, R.D., Strudwick, A.J. and Gregson, W., 2013. Systematic Bias between Running Speed and
Metabolic Power Data in Elite Soccer Players: Influence of Drill Type. Int J Sports Med: DOI 10.1055/s-0033-1355418.
•
Heck, H., Mader, A., Hess, G., Mucke, S., Muller, R., and Hollmann, W., 1985. Justification of the 4 mmol/L lactate threshold. Int .J. Sports
Med., 6, pp.117–130.
•
Helgerud, J., Høydal, K., Wang, E., Karlsen, T., Berg, P., Bjerkaas, M., Simonsen, T., Helgesen, C., Hjorth, N., Bach, R. and Hoff, J., 2007.
Aerobic high-intensity intervals improve VO2max more than moderate training. Medicine and Science in Sports and Exercise, 39 (4),
665-71.
•
Impellizzeri, F.M., Rampinini, E. and Marcora S.M., 2005. Physiological assessment of aerobic training in soccer. Journal of Sports Sci-
ences, 23(6), pp.583–592.
•
Jennings, D., Cormack, S., Coutts, A.J., Boyd, L. and Aughey, R.J., 2010. The Validity and Reliability of GPS Units for Measuring Distance
in Team Sport Specific Running Patterns. International Journal of Sports Physiology and Performance, 5, pp.328–341.
•
Johnston, R.J, Watsford, M.L, Pine, M.J, Spurrs, R.W and Sporri, D., 2013. Assessment of 5 Hz and 10 Hz GPS units for measuring athlete
movement demands. International Journal of Performance Analysis in Sport, 13, pp.262–274.
•
Jones, A.M. and Doust, J.H., 1998. The validity of the lactate minimum test for determination of the maximal of the maximal lactate
steady state. Med. Sci. Sports Exerc, 30, pp.1304–1313.
•
Kingsley, M., Lewis, M.J. and Marson, R.E., 2005. Comparison of Polar 810s and an ambulatory ECG system for RR interval measurement
during progressive exercise. International Journal of Sports Medicine, 26(1), pp.39–44.
•
Lamberts, R.P. and Lambert, M.I., 2009. Day-to-day variation in heart rate at different levels of submaximal exertion: implications for
monitoring training. J Strength Cond Res, 23, pp.1005–1010.
•
Lehmann, M., Foster, C. and Keul, J., 1993. Overtraining and endurance athletes: a brief review. Med Sci Sports Exerc, 25(7), pp.854–62.
•
Londeree, B.R. and Moeschberger, M.L., 1982. Effect of age and other factors on maximal heart rate. Res Quarter Exerc Sport, 53(4),
pp.297-304.
•
Marsland, A.L., Gianaros, P.J., Prather, A.A., Jennings, J.R., Neumann, S.A. and Manuck, S.B., 2007. Stimulated production of pro-inflam-
matory cytokines covaries inversely with heart rate variability. Psychosom Med., 69, pp.709–716.
•
Millet, G.P., Vleck, V.E. and Bentley, D.J., 2009. Physiological differences between cycling and running: lessons from triathletes. Sports
Med., 39(3), pp.179-206.
•
Moxnes, J.F. and Hausken, K., 2009. A mathematical model for the training impulse and lactate influx and outflux during exercise. Int J
Mod Phys C, 20(1), pp.147-177.
•
Moxnes, J.F., Hausken, K. and Sandbakk, Ø., 2012. On the kinetics of anaerobic power. Theoretical Biology and Medical Modelling, 9(29).
•
Mujika, I. and Padilla, S., 2001. Cardiorespiratory and metabolic characteristics of detraining in humans. Med Sci Sports Exerc, 33,
pp.413–421.
•
Osgnach, C., Poser, S., Bernardini, R., Rinaldo, R. and di Prampero, P.E., 2010. Energy cost and metabolic power in elite soccer: a new
match analysis approach. Med Sci Sports Exerc, 42, pp.170–178.
•
Pichot, V., Roche, F. and Gaspoz, J.M., 2000. Relation between heart rate variability and training load in middle-distance runners. Med
Sci Sports Exerc, 32(10), pp.01729–36.
•
Poole, D.C., Ward, S.A., Gardner, G.W. and Whipp, B.J., 1988. A metabolic and respiratory profile of the upper limit for prolonged exercise
in man. Ergonomics, 31, pp.1265–1279.
•
Reilly, T. and Korkusuz, F., 2008. Science and Football: The Proceedings of the Sixth World Congress on Science and Football: v.6. Lon-
don: Taylor Francis.
•
Robergs, R.A. and Landwehr, R., 2002. The Surprising History of the “Hrmax=220-Age” Equation. Journal of Exercise Physiology, 5(2),
pp.1–10.
•
Robson-Ansley, P.J., Gleeson, M. and Ansley, L., 2009. Fatigue management in the preparation of Olympic athletes. Journal of Sports
Sciences, 27(13), pp.1409-1420.
•
Schönfelder, M., Hinterseher, G., Peter, P. and Spitzenpfeil, P., 2011. Scientific Comparison of Different Online Heart Rate Monitoring
Systems, Int J Telemed Appl., vol. 2011, Article ID 631848, 6 pages. doi:10.1155/2011/631848.
•
Stegmann, H., Kindermann, W. and Schnabel, A., 1981. Lactate kinetics and individual anaerobic threshold. Int. J. Sports Med., 2,
pp.160–165.
•
Swain et al., 1994. Target HR for the development of CV fitness. Medicine & Science in Sports & Exercise, 26(1), pp.112-116.
•
Tanaka, H., Monahan, K.G. and Seals, D.S., 2001. Age–predicted maximal heart rate revisited. J Am Coll Cardiol, 37, pp.153-166.
•
Task Force of the European Society of Cardiology and the North American Society of Pacing and Electrophysiology, 1996. Heart rate
variability: standards of measurement, physiological interpretation and clinical use, 93(5), pp.1043–65.
•
Tritton, B., 1993. Massage and Myotherapy. Abbotsford, Vic.: TAFE Publications.
[email protected] 06 Aug 2018
FITNESS IN SOCCER
Training load monitoring in soccer
167
10
TRAINING LOAD
MONITORING IN SOCCER
Ibrahim Akubat, Jan Van Winckel
10.1 INTRODUCTION
Examining the training process is essential to understanding why we measure
training load. By measuring the training load, we are looking for a dose-response
relationship with the outcome parameter. The dose, or the training load, is the pre-
scribed exercise, and the response of interest in soccer is the associated fitness gain,
fatigue accrued or injury risk. Examining the dose-response relationship in this
manner allows us to improve our knowledge of how a player might respond to a
particular training dose. We can also become more proactive in future when mani-
pulating the dose, rather than merely reacting to the response. This may help us
to produce desirable responses, such as fitness gain, or prevent undesirable res-
ponses, such as injury. The dose-response relationship is deemed by the American
College of Sports Medicine to be a fundamental principle of training. It has also
been suggested (Banister, 1991; Manzi et al., 2009) that a valid measure of training
load should show a dose-response relationship with the training outcome. The trai-
ning outcome is usually measured periodically using an assortment of fitness tests,
performance parameters and injury records. So, why is the dose-response relati-
onship so important to soccer coaches? We generally react to a response, whether
it be an injury or a fitness test score. Given that we want to avoid both injuries and
frequent fitness testing, which may be impractical due to time constraints, under-
standing the response to a given dose enables us to be proactive in achieving our
aims as coaches. Understanding the training process is essential to understanding
which measurements of training load will show good dose-response relationships.
[email protected] 06 Aug 2018
FITNESS IN SOCCER
Training load monitoring in soccer
168
10.2 THE TRAINING PROCESS
The training process has been conceptualized quite nicely by Impellizerri and col-
leagues (Impellizzeri, Rampinini and Marcora, 2005). Figure 10.1 below shows how
both the prescribed training and the characteristics of the individual (e.g., genetics,
training status, etc.) combine to form the internal training load.
Fig. 10.1: The Training Process (Impellizerri et al., 2005)
This is best explained with the example of two men of differing fitness levels run-
ning a 10 km race at the same pace and both finishing at the same time. The fit-
ter man would find this less demanding internally, and an analysis of his heart
rate (HR) data would show it to be lower than the other man’s. In a soccer-related
setting, this would also mean that players running the same distance would only
show the same response if their personal characteristics were exactly the same, but
this scenario is highly unlikely. Therefore, as the model shows, it is ultimately the
internal training load that acts as the stimulus for training adaptation. Measuring
training load is particularly difficult in sports such as soccer, because different exer-
cise designs lead to different physiological and mechanical demands, and there are
inter-individual responses to the prescribed exercise (Bangsbo, Mohr and Krus-
trup, 2006).
The measurement of training load is often described as either internal or external.
Internal training load monitoring is usually based on HR or the rating of perceived
exertion (RPE), and is often calculated with the integration of time, intensity and
a weighting factor. Intensity has been measured objectively using HR due to its
linear relationship with oxygen consumption (Bot and Hollander, 2000), which is
widely regarded as the gold standard for measuring exercise intensity (Thompson,
2010). Consequently, it seems appropriate to use HR as a measure of intensity and
internal load. In recent years, the development of automated camera tracking sys-
tems, GPS and accelerometers has also brought forward the measurement of exter-
nal training loads. These measurements of external load provide us with another
tool for measuring the training load of soccer players.
[email protected] 06 Aug 2018
FITNESS IN SOCCER
Training load monitoring in soccer
169
In this chapter, the methods used to examine both internal and external loads will
be explored and their validity assessed. Furthermore, in a practical or applied
environment, certain factors may influence which methods you can and cannot
apply, perhaps because of cost, time or practicality. This will also be summarized
for each method. The decision of whether a method is worth the associated cost
and time is one for individuals to make based on their available resources, but the
decision should also be governed by the validity of each method. This chapter aims
to help coaches and practitioners decipher all these details and help them in a soc-
cer-related setting.
10.3 INTERNAL LOAD
10.3.1
Banister’s TRIMP
Banister et al. (1975) were among the first to pursue a single value to represent the
training load or training impulse (TRIMP). Banister originally proposed a three-
zone model where exercise was categorized as being of a low, moderate or high
intensity, and each of these zones was weighted by 1, 2 or 3 respectively. However,
the TRIMP method developed later by Banister (1991) is widely used today, and
this is based on HR and a modelled blood lactate response to increasing exercise
intensity. Banisters TRIMP takes into consideration the intensity of exercise, which
is calculated from the heart rate reserve method and the duration of exercise. The
mean HR for the training session is weighted according to the relationship between
HR and blood lactate observed during incremental exercise, which is then multi-
plied by the session duration.
TRIMP is calculated using the following formula:
t x ∆HR x y
Where:
t = duration (minutes)
∆HR = fractional elevation in HR or HR reserve
y = weighting factor
The ∆HR is weighted in such a manner that it reflects the intensity of effort and
guards against placing disproportionate importance on longer durations of low-in-
tensity exercise when compared with high-intensity exercise. The multiplying fac-
tor (y) weights the ∆HR according to the classically described increase in blood
lactate in trained male and female subjects.
Banister used the TRIMP to model endurance performance when he used it to
measure training load, and from this he modelled the dose-response relationships
with fitness and fatigue. Banister theorized that each training bout produced both
a fatigue and a fitness impulse, with fatigue decaying three times faster than fit-
ness, providing training adaptation and enhancing performance. Performance at
any given point is a result of the fitness level minus the accrued fatigue. Morton
et al. (1990) modelled the endurance performance of two athletes using Banister’s
TRIMP, and the results gave credence to Banister’s TRIMP for endurance events.
[email protected] 06 Aug 2018
FITNESS IN SOCCER
Training load monitoring in soccer
170
The modelling conducted to date has focused on endurance athletes with long trai-
ning schedules. These athletes may need to optimize performance for competition
periods ranging from a single day (e.g., a marathon) to a few weeks (e.g., a cycling
tour). The modelling of performance in endurance sports (Morton, 1990) somewhat
validated Banister’s TRIMP, but the modelling process has been subject to modifi-
cations (Busso, 2003) to improve predictions.
There are two major limitations when using Banister’s TRIMP in intermittent team
sports like soccer. Firstly, the use of mean HR may not reflect the fluctuations in
HR that occur during intermittent exercise. The mean exercise intensity in soccer
matches has been widely reported to be around the anaerobic threshold at 85% of
HR
max (Stolen et al., 2005), but it has also been reported to peak at close to HRmax
(Ascensao et al., 2008). Secondly, the use of generic equations for males and fema-
les implies that gender is the only differing factor in athletes, and this doesn’t take
into consideration the individual differences that affect training load, such as those
implied by the model of Impellizzeri et al. (2005).
Associated Costs: HR monitors.
Practicalities: Easy to calculate once correct data has been identified and downloaded,
and the formula is the same for each player. Software can also perform this calcula-
tion. The availability of match data may be a problem at senior levels, because HR
monitors may not be worn. It is, however, useful at all other levels.
10.3.2
Edwards’ TRIMP
Edwards (1993) proposed a zone-based method for the calculation of training load.
The time spent in five predefined arbitrary zones is multiplied by arbitrary coeffi-
cients to quantify training load. The proposed zones are based on HR
max with 10%
zone ranges, and the corresponding coefficients can be seen in Table 10.1.
HR Zone (% HR )
max
Weighting Factor
50-60%
1
60-70%
2
70-80%
3
80-90%
4
90-100%
5
Table 10.1: HR weightings proposed by Edwards (1993).
This method gained popularity as the default setting on a popular HR system.
However, the coefficients lack any physiological underpinning, and the zone limits
remain predefined and lack metabolic or physiological performance thresholds.
These zones and weightings imply that the training adaptation in zone 5 is five
times greater than in zone 1, but no study to date has proven this to be the case. The
weightings used by Edwards (1993) are not validated through a relationship with a
known physiological response. Throughout this chapter, we will encounter a num-
[email protected] 06 Aug 2018
FITNESS IN SOCCER
Training load monitoring in soccer
171
ber of methods that have tried to validate themselves through their relationship to
this method. This has been done on the basis that HR is a valid measure of intensity
(Bot and Hollander, 2000), but where intensity is only one term in the equation for
training load (with the others being time and a weighting factor).
On the other hand, there is evidence to support the use of generic high-intensity
thresholds. Castagna et al. (2011) showed a dose-response relationship between
the time spent above 90% HR
max and changes in fitness. Although useful, using
such approaches exclusively risks ignoring the training load accrued from training
below the threshold and the remaining intensity continuum. This could mean that
vital load information is being missed, and this could make the difference between
fitness and injury.
Costs: HR monitors.
Practicalities: Usually weightings and zones can be set in the software provided with
the hardware, so calculation is relatively easy. Availability of match data is again a
problem at senior levels.
10.3.3
Lucia’s TRIMP
Lucia et al. (2003) based their measure of training load around the first and second
ventilatory thresholds (VT1 & VT2). The method provides three zones: low (below
VT1), moderate (between VT1 and VT2) and high (above VT2). Each zone is given
a coefficient of 1, 2 and 3, respectively. The time spent in each zone is multiplied
by the relevant coefficient and summated to provide a TRIMP score. However, like
with Edwards (1993), the weightings are not based on any scientific evidence and/
or physiological data. Earlier work by Banister et al. (1975) with swimmers used
the same weighting coefficients (1, 2 and 3) for low-, moderate- and high-intensity
work, but, as previously mentioned, he later changed his approach and based the
weighting on the blood lactate response instead. This sort of weighting implies that
high-intensity exercise is three times as demanding as low-intensity exercise.
Lucia et al. (2003) used this method to successfully compare the training load distri-
bution for two different cycling tours, and they reported no significant differences
in the calculated training load for the two tours (the Vuelta a España and the Tour
de France). Training using this three-zone model in endurance sports has received
some attention (Esteve-Lanao et al., 2007; Seiler and Tonnessen, 2009), giving the
method credibility because of its use in elite settings. Seiler described polarized
training methods, popular with endurance athletes, where around 80% of their trai-
ning time is spent in zone 1 (zones have shown to relate well to endurance performance (Amann et al., 2006),
but the weightings remain arbitrary. This system appears to be best used by moni-
toring the time in each zone and the distribution in competition and training. This
certainly does not mean that a universal score from the associated coefficients is
valid. Furthermore, the weighting of each zone implies that the training adaptation
would be the same regardless of where in the zone an athlete trained. For example,
say the threshold for VT2 is identified at 85% of HR
max. Now, a training session
with an intensity of 95% of HR
max would be given the same weighting as a training
session at 85% of HR
max, yet it would be weighted differently if the athlete trained
at 84%.
[email protected] 06 Aug 2018
FITNESS IN SOCCER
Training load monitoring in soccer
172
The study of Denadai et al. (2006) showed how a 5% difference in training intensity
(95% velocity at maximum aerobic power (vVO
2max) vs. 100%vVO2max) produced
different training adaptations. For this reason, the use of any zoning method is
questionable. Impellizerri et al. (2005) did demonstrate that training above and
below such thresholds may produce differing training responses in soccer play-
ers, although the threshold was based on an arbitrary lactate value. However,
monitoring just high-intensity activity in isolation means that the accrued training
load from lower intensity activity could end up being ignored. To date, no trai-
ning study on Lucia’s method has been conducted to validate that it demonstrates
dose-response relationships in soccer.
Costs: HR monitors, regular testing and analysis.
Practicalities: Weightings and zones can usually be set in the software provided
with the hardware, so calculation is relatively easy. The testing and interpretation of
data for a whole squad is time consuming and potentially costly. It would need the
purchase of gas analysis systems/lactate analyzers or the hiring of third parties to do
the testing. The availability of match data is a problem at senior levels.
10.3.4
Stagno’s modified TRIMP (TRIMPmod)
Stagno et al. (2007) developed a modified version of Banister’s TRIMP in an attempt
to quantify training load for field hockey. Rather than using a generic equation
to reflect a hypothetical blood lactate profile, these authors directly measured the
blood lactate profile of the hockey players. The weightings used therefore reflected
the profile of a typical blood lactate response curve to increasing exercise intensity
for the specific population, the hockey team in this case. Rather than being truly
individualized, their method used the mean blood lactate profile from all of the
players to generate the weightings, which provided at least some degree of indi-
vidualization. They then anchored five HR zones around the lactate threshold (LT,
1.5 mmol/L) and the onset of blood lactate accumulation (OBLA, 4 mmol/L), with
the resulting zone weightings being 1.25, 1.71, 2.54, 3.61 and 5.16. The accumula-
ted time in each HR zone was then multiplied by its respective zone weighting to
derive an overall TRIMPmod. The research quantified the training load in hockey
and established relationships between TRIMPmod and various fitness parameters
during the course of a season.
They found the mean weekly TRIMPmod shared significant relationships with
changes in running velocity at OBLA and VO
2max. They also reported significant
correlations between the time spent in high-intensity activity and the change in
VO
2max and the change in vOBLA. The dose-response relationships of this study
suggest that TRIMPmod is a valid method to measure training load. The original
TRIMP of Banister (1991) is calculated using the mean HR for a particular exercise
session or interval of training. Stagno instead used time accumulated in zones to
reflect the differing intensities at which team-sport players work. By comparison,
endurance athletes may work at a particular intensity for longer periods, and this
may make the use of a mean HR more suitable and less of an issue for them. Howe-
ver, the modern training regimens of endurance athletes also use high-intensity,
interval-type approaches. Stagno didn’t compare his method to Banister’s, and we
do not know if there is any significant difference when using the zone method
[email protected] 06 Aug 2018
FITNESS IN SOCCER
Training load monitoring in soccer
173
of Stagno rather than the mean HR method used by Banister. The difference has,
however, been shown to be significant for a single exercise bout (Akubat, 2009).
The zones used by Stagno were based on the HR at LT (defined as 1.5 mmol/L),
and OBLA (defined as 4 mmol/L). They used the blood lactate responses at four
different speeds from their player sample to create an equation for the weightings
(the y value defined by Banister). Zones 2 and 4 were created around the mean
HR at LT and OBLA. A zone width of 7% fractional elevation was formed at these
points. Zones 1, 3 and 5 were then created around zones 2 and 4. The prerequisite
for using this method was that the HR at LT and OBLA for all players fell within
the created zones. However, the use of zones also has the limitation of awarding
the same weighting to exercise spanning the whole zone. For example, if a zone
spanning 70–80% of HR
max had the same weighting, an athlete training at 71%
would get the same weighting as another athlete training at 79%. It is difficult to
ascertain if this difference would affect physiological adaptation, and there appears
to be a lack of studies examining this fundamental training question. However,
with Stagno’s method, the zones are created around the thresholds, so there may
well be situations where players exercising in the same zone, and thus gaining the
same weighting, are actually each working above and below a metabolic threshold.
Impellizerri et al. (2005) showed this could produce different results.
It must be highlighted that although the zones are based on metabolic criteria, they
are created with arbitrary values of lactate and are therefore not individualized as
with Lucia’s method. Another issue with using weighting that is individualized to
a team is that it still does not account for individual differences. Figure 10.2 below
shows data collected from a squad of professional players from the championship
division in England. Note how the regression line from which the weightings are
calculated is well below the data points for some players, especially at higher inten-
sities, possibly leading to an underestimation of training load.
Fig. 10.2: Blood lactate responses for a squad of championship soccer players.
[email protected] 06 Aug 2018
FITNESS IN SOCCER
Training load monitoring in soccer
174
In summary, the work of Stagno highlighted some of the complexities involved in
monitoring the training load in team sports. They highlighted the need for specific
weightings, although they did not fully individualize these, and their use of zones
was an attempt to move beyond the use of mean HR. The highlighted limitations
exist, but they still produced significant dose-response relationships, and at the
time, this study was a big step in the right direction. A number of teams have used
Stagno’s weightings, but a core point is often missed. These weightings were speci-
fic to that particular team, and to apply this approach successfully, you would need
to do the same testing to calculate specific weightings for your own team.
Banister used mean HR, citing that calculating the TRIMP for each reading would
be too problematic. However, modern computing can achieve this, so given the
highlighted limitations of zones, why not assign each HR reading a weighting and
avoid the need for zones? The next method described does exactly that.
Costs: HR monitors, regular testing and analysis.
Practicalities: Weightings and zones can usually be set in the software provided with
the hardware, so calculation is relatively easy. Testing and interpreting the data for
a whole squad is time consuming and potentially costly. It would need the purchase
of lactate analyzers or the hiring of a third party to do the testing. The availability of
match data is a problem at senior levels.
10.3.5 Individualized TRIMP (iTRIMP)
A group of Italian researchers, led mainly by Vincenzo Manzi, were the first and
most prominent researchers of this method. Using this method, the TRIMP weigh-
ting is based on an individual’s own heart rate and blood lactate response to incre-
mental exercise, as measured during a standard lactate threshold test. Furthermore,
as a development on previous methods, Manzi et al. (2009) did not use HR zones
or mean HR. The TRIMP scores were calculated for each HR reading and summa-
ted to give an overall iTRIMP score. In comparison to methods employing zones,
they had effectively created a zone for each HR reading from resting HR to HR
max.
These researchers had effectively individualized the weighting to the athlete,
going beyond the previous individualization by gender (Banister, 1991) and group
(Stagno et al., 2007). Moreover, the iTRIMP weighting is not arbitrary, as was the
case in the methods of Edwards (1993) and Lucia et al. (2003). Consequently, this
method overcomes many of the limitations of the previous methods.
Manzi et al. (2009) published results using the iTRIMP method. These showed that
after an eight-week period of training in recreational runners, the mean weekly
iTRIMP significantly correlated with changes in velocity at lactate threshold (vLT;
r=0.87 and vOBLA; r=0.72). The mean weekly iTRIMP also showed significant cor-
relations with changes in 5,000m (r=-0.77) and 10,000m (r=-0.82) running perfor-
mance. In contrast, Manzi reported that Banister’s TRIMP failed to show significant
relationships with any fitness parameters or performance measures. Since the HR–
VO
2 relationship appears to be valid even during intermittent exercise (Esposito et
al., 2004), the iTRIMP method has potential for use within a soccer environment.
Two studies were recently published that looked at the iTRIMP in senior and youth
soccer players (Akubat et al., 2012; Manzi, et al., 2012). During the preseason of
an Italian Serie A team, iTRIMP showed dose-response relationships with changes
[email protected] 06 Aug 2018
FITNESS IN SOCCER
Training load monitoring in soccer
175
in VO
2max (r=0.77), velocity at ventilatory threshold (r=0.78), vOBLA (r=0.64)
and Yo-Yo IR1 performance (r=0.69). The study conducted in the playing season of
a youth team from an English championship club showed a dose-response relati-
onship with changes in vLT(r=0.67) but not with vOBLA. Akubat et al. (2011) also
compared the weekly iTRIMP scores to session RPE and Banister’s TRIMP and a
modified version of Stagno’s TRIMP (group weightings but no zones). The results
were similar to previous studies that compared these methods to each other. Ses-
sion RPE related well to Banisters TRIMP, but iTRIMP showed poor relationships
with the other measures.
This is all great new information, but the versatility of this method is best shown in
another study by the same Italian group of researchers, this time headed by Iellamo
et al. (2012). They employed the iTRIMP method to measure training load with car-
diac patients. They compared the effects of continuous-aerobic training and inter-
val-aerobic training programs on numerous health and fitness measures. They
matched the dose of exercise for each group using the iTRIMP method. There was
no significant difference between the groups in all the measured variables. The
measurements did show changes over the training period (VO2peak improved by
22%), but there was no difference between the groups. This has major implications
for practices that could be employed in different sporting situations. In summary,
the iTRIMP research since 2009 has considerably furthered our knowledge of trai-
ning load monitoring.
Costs: HR monitors, regular testing and analysis.
Practicalities: Software is now available that allows quick and easy analysis of HR
and provides iTRIMP scores, but manual calculation is time consuming. Testing and
interpreting the data for a whole squad is time consuming. It requires the purchase of
lactate analyzers or the hire of third parties to perform the testing. The availability of
match data is a problem at senior levels.
10.3.6 Session RPE
Training load measured by the session RPE is a subjective way of quantifying the
load placed on an athlete. It is calculated by multiplying the session intensity by
the duration to provide a measure of load in arbitrary units. The intensity is des-
cribed as a number (0-10) on the CR-10 Rating of Perceived Exertion (RPE) scale
proposed by Borg et al. (1987). Significant relationships between RPE and other
measures of intensity like HR (r=0.89) and plasma lactate concentration (r=0.86)
have been demonstrated (Gabbett and Domrow, 2007). However, something being
a valid measure of “intensity” does not imply it will be a valid measure of “load.”
Foster et al. (1996) showed that increasing the training load (as measured by Ses-
sion RPE) tenfold over 12 weeks resulted in a 10% performance improvement in
runners and cyclists. However, the study also showed poor dose-response relati-
onships between session RPE and changes in performance (r=0.29). Gabbett and
Domrow (2007) also reported a poor association between session RPE and changes
in skinfold thickness, speed, and VO
2max during any of the training phases they
monitored. In many sports, the usefulness of session RPE stems from its ease of
use when compared to the technical nature of using HR monitors. Possible issues
include loss of data and player compliance.
[email protected] 06 Aug 2018
FITNESS IN SOCCER
Training load monitoring in soccer
176
The study of Impellizerri et al. (2004) compares session RPE to the methods of
Banister (1991), Edwards (1993) and Lucia et al. (2003), and the relationships imply
the validity of session RPE. Impellizerri et al. (2004) concluded that with only 50%
of the variation in session RPE being explained by HR, it cannot be deemed a valid
substitute. A similar study was conducted by Alexiou and Coutts (2008) where
session RPE was correlated in different types of training sessions for female soc-
cer players, with a significant relationship to HR-based methods reported. Such
approaches, where new methods are compared to older methods to validate their
use, are becoming quite common. However, these relationships presented in such
studies could just as easily imply that the new method is just as bad as the old one
rather than just as good.
More recently, Brink et al. (2010) assessed the dose-response relationship of session
RPE with performance and recovery. They used session RPE, total quality of reco-
very (TQR) and performance in young, elite soccer players over a whole season.
Daily logs were kept by players and coaches to report the training load after ses-
sions and the TQR before the following session. To assess performance, they used
an interval shuttle run test on a monthly basis. They applied multi-level modelling
techniques to examine whether session RPE could predict performance and reco-
very outcomes. They reported that the number of training days significantly pre-
dicted the performance outcome, as represented by a decrease in the HR during the
ISRT. However, the model did not significantly predict performance with session
RPE or TQR. Although the simplicity of session RPE cannot be denied, the useful-
ness of the information it provides is questionable. The studies of Brink et al. (2010),
Gabbett and Domrow (2007), and Foster et al. (1996) show that session RPE doesn’t
appear to fit dose-response models.
Although dose-response relationships with fitness or performance appear to be lac-
king, a recent study looking at the changes in session RPE within individuals has
shown it may be useful as a predictor of injury. Rogalski et al. (2013) found that
larger weekly or fortnightly session RPE scores and larger week-to-week increa-
ses in load were significantly related to injury risk. Session RPE may relate better
with injuries rather than performance or fitness responses because one of the main
precursors of injury is fatigue. Table 10.2 shows both internal and external training
load measures from two simulated soccer matches (Akubat et al., unpublished)
using the modified BEAST protocol (Akubat et al., 2013).
iTRIMP
Distance
HID
Player Load
sRPE
Match
1
2
1
2
1
2
1
2
1
2
Mean
409
304
10810 10604
3336
2868
1301
1257
639
728
SD
174
91
664
592
718
754
94
145
99
99
p value
0.015
0.171
0.046
0.426
0.010
Cohen’s d
0.48
0.21
0.43
0.27
0.60
Effect Size
Small
Small
Small
Small
Moderate
Table 10.2: Load measures from two consecutive matches 48 hours apart.
[email protected] 06 Aug 2018
FITNESS IN SOCCER
Training load monitoring in soccer
177
These matches were separated by 48 hours, and the data for the high-intensity dis-
tance covered shows that the external performance was negatively affected. Players
were instructed to run as much as they could, so it could be reasonably assumed
that fatigue or a lack of recovery is the reason for their reduced performance.
However, the interesting change is in the iTRIMP and session RPE scores. iTRIMP
would suggest a reduced internal load for the second match, whereas session RPE
would suggest an increased perception of internal training load. In this situation,
we are dealing with objective data versus subjective data. A higher session RPE
score may be a reflection of the perception of load in an unrecovered state or when
fatigued. Therefore, in situations where there is inadequate recovery, an identical or
reduced external load will be perceived as a greater internal load with session RPE.
Costs: minimal.
Practicalities: Easy to administer and simple to calculate. Can be difficult to avoid
one player influencing the scores of another player in a team environment, and this
can add to the poor reliability and variability that has been reported. Software and
smartphone apps are now available to make this easier. Match data available.
10.4 EXTERNAL LOAD
The measurement of external load in soccer dates back as far as 1952 (Winterbottom,
1952), when hand notation methods were used to estimate the external demands
of a game through the use of distance. In more recent history, the use of automated
camera systems has brought to the fore the use of distances and breakdowns of
the velocities at which these distances are covered. This method has enabled the
determination of positional differences (Di Salvo et al., 2007), levels of play (Mohr,
Krustrup, and Bangsbo, 2003), and match-to-match variation (Gregson et al., 2010).
More recently, much of this research has been reexamined using a newer method.
The invention and subsequent use of GPS technology has revolutionized the way
we track, monitor, and examine both the loads on players and their performances.
Whereas semi-automated camera systems were mostly limited to stadiums, GPS
technology has the advantages of being usable almost anywhere and providing
real-time data. Ironically, the surrounding structures of some stadiums may hinder
GPS units from connecting to the satellites they use to calculate their location. The
use of these devices has also bought many challenges, because they are also now
equipped with accelerometers, gyroscopes, and magnetometers, meaning we can
accumulate a wealth of data.
The invention of these technologies has also led to the emergence of data mining,
where everything possible is collected and then examined. On the other hand, some
practitioners prefer to use only data that gives them useful information. Again the
approach you choose will depend on the resources at your disposal and the effecti-
veness with which you can use the data. Does this impact on fitness, performance,
wellbeing, and/or injury risk? In this section, we will examine what external load
can tell us about the dose-response relationship and assess the validity of external
methods for measuring training load.
[email protected] 06 Aug 2018
FITNESS IN SOCCER
Training load monitoring in soccer
178
10.4.1 Distance
As an external measure of training load, any dose-response relationship will be
mediated by the individual’s characteristics in accordance with figure 10.1 (pre-
sented earlier in this chapter). A theoretical comparison of an elite runner and a
recreational runner who run 5000m at the same pace exemplifies this. The stress on
each runner is determined by their individual fitness states, and even if the distance
and pace is identical, the dose and therefore response will be different in each indi-
vidual. As fitness can also change within individuals, the same 5000m at the same
pace will not always produce the same level of stress.
Typically in soccer, we have seen the use of total distance (TD) and high-intensity
distance (HID) as measures of external load or performance. HID has gained some
credibility as a measure of exertion and performance through construct validity
when comparing moderate-to-elite-level players (Mohr et al., 2003). It has also been
shown to vary greatly from game to game (Gregson et al., 2010). It has been sugge-
sted that TD and HID may be valid indicators of load, because soccer players will
run as much as possible during matches. Others argue it is stimulus-driven expen-
diture determined by factors such as state of play, position and tactics, to name but
a few (Impellizzeri et al., 2005; Rampinini et al., 2007; Rampinini et al., 2007). When
assessing load using distance data, speed thresholds have also been individualized.
10.4.2 Individualization of Speed Thresholds
As individuals may possess different levels of fitness and physical capabilities,
comparing variations in the distance data between players may yield comparable
statistics on performance. However, the area of interest in this chapter is exercise
dose, and generic thresholds for speed will not give comparable exercise dose data.
The methods described below have been popular recently in training regimens for
soccer.
Abt and Lovell (2009) proposed that high-intensity speed thresholds should be
individualized based on ventilatory thresholds (VT) in a similar manner to the
methods proposed by Lucia et al. (2003), which we discussed earlier. This would
require a laboratory treadmill test with gas analysis. They found that the median
high-intensity threshold, as determined by the velocity at the second VT, (VT2),
was 15 km/h (with a range of 14–16 km/h), considerably lower than the defaults
of many GPS and camera tracking systems. They found the mean distance run
at high intensity, based on the default of 19.8 km/h and the VT2 speed, was 845m
and 2258m respectively. This represents an almost three-fold increase in the high
intensity exercise dose. A follow-up study (Lovell and Abt, 2013) found that total
distance covered in the three different zones proposed by Lucia was 26%, 57% and
17% for low-, moderate- and high-intensity zones respectively. They also identi-
fied a 41% difference in the high-intensity distance covered between two players of
the same positional role when zones were individualized, compared to only 5–7%
when zones were not individualized.
Speeds above a high-intensity threshold of 15 km/h represent a large zone because
peak speeds have been reported to be well above 25 km/h (Gregson et al., 2005).
Therefore, other researchers have proposed the use of maximal aerobic speed
(MAS) and maximum sprinting speed (MSS) to generate training zones. Using this
method, supramaximal running speeds (speeds > MAS) can be identified (Buchheit
[email protected] 06 Aug 2018
FITNESS IN SOCCER
Training load monitoring in soccer
179
et al., 2013). These can then be used for programming, breaking down the high-in-
tensity running zone above VT2 into smaller blocks. When MAS has been used for
individualized training regimens, exercise intensities have been prescribed as per-
centages of MAS (Baker, 2011).
Using the approach where zones are individualized based on physiological thres-
holds, the intensity becomes relative to individuals’ fitness levels. Given the frame-
work proposed by Impellizerri et al. (2005), this approach could be considered as
an internalized measure of training load with the measurement of external perfor-
mance. It would appear that when you are using external measurements for moni-
toring load, these individualizations are essential.
Numerous studies have shown the benefit of high-intensity training programs in
soccer (Hoff et al., 2002). Castagna et al. (2011) showed how the internal training
load at high intensities shows dose-response relationships, but such relationships
with external performance have yet to be shown. There is, however, likely to be a
similar relationship, given that training above VT2 or MAS produces a high HR. It
is also worth considering the study of Denedai et al. (2006), which showed marked
contrasts in adaptation between groups that trained at 95% and 100% of vVO
2max.
So, the debate about zones and differences remains, because in a zone with a 10%
width (e.g., 90–100%), a player exercising at 91% would receive the same credit as
one exercising at 99%. The approaches somewhat internalize the external measures
of load, but it still remains difficult to equate the distances covered in all zones,
regardless of how they are reduced to a single number for exercise dose or training
load.
There are two major criticisms of the velocity-based measures of load used by GPS
companies and researchers to promote other measures.
• Movements that don’t create
vertical displacement are not
accounted for.
• Activity isn’t considered to be
high intensity unless speed
thresholds are breached, whe-
reas accelerations that do not
result in top speed are just as, if
not more, energetically deman-
ding (Gaudino et al., 2013a;
Gaudino et al., 2013b; Osgnach
et al., 2010).
This has led to the development of
both accelerometry-derived load
and metabolic-power calculations,
both of which are now available from
some GPS technology suppliers.
[email protected] 06 Aug 2018
FITNESS IN SOCCER
Training load monitoring in soccer
180
10.4.3 Accelerometry
Accelerometry in soccer has come together with GPS technology, because these
units are now available with accelerometers built into them. The accelerometry-de-
rived load has been described as external load, mechanical load, and center of mass
acceleration in all three planes of movement. The algorithms used differ between
GPS companies. Research studies have sought to validate accelerometry-derived
load by correlating it to some of the internal-load measures mentioned earlier. The
Player Load (Catapult) and Body Load (GPSports) are two of the accelerometry-de-
rived load measures. Player Load appears to relate to session RPE and Edwards’
TRIMP (Casamichana et al., 2013), and Body Load doesn’t appear to show any rela-
tionship with session RPE (Gomez Piri et al., 2012). Unpublished data (Akubat et
al., unpublished) suggests that Player Load shows very large correlations with ses-
sion RPE but only trivial relationships with iTRIMP. You could speculate that given
iTRIMP has shown dose-response relationships (Akubat et al., 2012; Manzi et al.,
2012; Manzi et al., 2009), the lack of any relationship with iTRIMP would bring into
question the ability of Player Load to show a dose-response relationship. Howe-
ver, this is merely speculation, and to truly assess the validity of any accelerome-
try-derived load measure, training studies such as those done previously for other
methods are required (Akubat et al., 2012; Manzi et al., 2012; Wallace et al., 2013).
10.4.4 Metabolic Power
Accelerations and decelerations are high-intensity and energy-demanding activi-
ties, even at low absolute velocities. However, the way high-intensity activity is
determined when using velocity thresholds does not always account for this (Gau-
dino et al., 2013a; Gaudino et al., 2013b).
Di Prampero et al. (2005) developed a mathematical approach to quantify the esti-
mated energy cost associated with any instantaneous change in velocity. It was
proposed that accelerated running on a flat terrain is considered energetically equi-
valent to uphill running at constant speed (Minetti et al., 2002). Metabolic power
is calculated as the instant energy cost multiplied by the instant velocity. The abi-
lity to calculate instant “energy cost” based on known and measured data and the
measurement of “instant velocity” using GPS allows this estimate of metabolic
power to be calculated. As both velocity and acceleration are used, it is argued this
provides a better estimation of high-intensity activity (Gaudino et al., 2013).
Gaudinho et al. (2013) showed that when the equivalent high-intensity metabo-
lic-power threshold (a metabolic power of 20W.kg is considered the equivalent of
running at a constant speed of 14.4 km/h) is used in the analysis of soccer training,
the actual high-intensity activity could be underestimated by as much as 84%. The-
refore, the availability of metabolic-power calculations in GPS software has been
an interesting addition to the monitoring of load. However, there are also some
theoretical limitations that must be considered. Acceleration measurement with
GPS units at higher velocities has been shown to display increased error (Aken-
head et al., 2013), and there has also been substantial inter-unit variability repor-
ted (Buchheit et al., 2013). There are also inter-individual variations in energy cost,
because the same acceleration velocities may not result in the same energy cost
when the data is examined closely (Gaudino et al., 2013).
Over the next few years, research in this area will hopefully clarify this method’s
usefulness in the training process, but the underestimation of high-intensity acti-
[email protected] 06 Aug 2018
FITNESS IN SOCCER
Training load monitoring in soccer
181
vity in the proportions demonstrated has serious implications for training, adapta-
tion periodization, fatigue and ultimately injury prevention.
10.4.5 Match Load as a Measure of Training Load
The use of GPS and its associated technologies has allowed the measurement of
match-play activities at previously unknown depths. One of the approaches often
used in practice, but not really in research, is that of using percentages of match-ba-
sed metrics to periodize and optimize training. For example, a player may aim
to do two games worth of work (in terms of distance, accelerometry-derived
load or metabolic power) in a given week. This approach has fundamental flaws.
Firstly, to conclude this method works, we must first have evidence that a certain
amount of match-like activity produces a certain response. Secondly, the variation
in match loads between games and positions (Gregson et al., 2010) means it is dif-
ficult to make assumptions about a typical match. The question that arises with
such an approach is this: Are we trying to make the technology useful using match
demands just because it is something we can measure now? Or does this method
provide an effective measure of training load? Such a method determines the load
without considering initial and subsequent fitness levels.
Costs: GPS units are very expensive for an entire squad.
Practicalities: Player compliance issues for wearing units in some cases. Lots of data,
but is it actually useful? Once data is collected, analysis by analysts is required. The
availability of match data is a problem at senior levels.
10.4.6 Maximizing Performance using Training Load Monitoring
The purpose of any player monitoring is to gain information to help understand
the response and produce this response when required. Soccer players may face
different challenges to those in other sports where competition is infrequent and
allows training and taper periods. In soccer, the ideal scenario for a coach is to have
a player able to participate at his maximal capability on a number of occasions (this
is discussed in a later chapter). In many European leagues, successful teams regu-
larly play two or three times each week. To help maximize or understand a player’s
performance capability, we can use some of Banister’s (1991) theoretical work. He
theorized that performance at any given point is determined by the fitness level of
the individual less fatigue. Therefore, by monitoring both fitness and fatigue, we
can assess when maximal performance is possible and when maximal performance
will be hindered. The measurement of fatigue could be subjective (through ques-
tionnaires and scales) or objective (through physiological assessment). Frequent
fitness measurement is also difficult in soccer given the high volume of training
and matches. Could training load measures be used to help assess fitness? A recent
study by Akubat et al. (2013) showed how integrating the internal and external load
could produce ratios that relate to fitness measures, or in other words, assess the
internal cost of the externally prescribed exercise. This provides a pseudo-measure-
ment of exercise economy/efficiency. Regular assessment of internal:external ratios
could give you information on fitness. However, unpublished data also shows
acute changes in such ratios with fatigue during competition (Weaving et al., unpu-
blished) and between exercise bouts (Akubat et al., unpublished).
[email protected] 06 Aug 2018
FITNESS IN SOCCER
182
Training load monitoring in soccer
To maximize performance, we must understand the internal load for each exter-
nal load prescribed for each individual, so comparing players with each other in
this respect may not prove fruitful. A player history, or within player comparison,
would help in assessing this and help us to move from being reactive to proactive.
Although the dose-response relationships we have found have been linear, more
may not always be better. Manzi et al. (2009) showed an inverted-U relationship
for iTRIMP and heart rate variability (HRV) changes in runners. They found higher
training loads beyond a certain point incurred negative changes in HRV, probably
because of overtraining. By building a player history, we can therefore assess what
the optimum “load” is by comparing periods of different training loads with the
performance response. This is an iterative process that would continue to change.
The frequency at which this iteration needs to take place depends on the sensi-
tivity of the load measures to physiological change. Maybe the process becomes
less iterative when the load measure is more sensitive to changes in the athlete’s
physiology, such as in the case of HR, where the load adjusts to changes in physio-
logy. An increase in fitness would result in a decreased HR for the same external
load, meaning a higher external load (intensity or volume) is required to match the
internal load.
SUMMARY
Most methods of measuring training load have limitations, so it is important that
soccer coaches select the method with the least limitations that fits their club’s
budget. It is also important to consider the limitations when interpreting trai-
ning load data, but the right information, gathered and used in the right way,
could help improve a coaches decision making when periodizing individual and
squad training programs. A good knowledge of training load methods, limita-
tions and monitoring methods can make a positive impact on soccer players in
terms of their performance and health.
REFERENCES
•
Abt, G. and Lovell, R., 2009. The use of individualized speed and intensity thresholds for determining the distance run at high-intensity
in professional soccer. Journal of Sports Sciences, 27(9), pp.893-898.
•
Akubat, I., 2009. A Comparison Of Methods For Calculation Of The Training Impulse. Paper presented at the International sports science
and sports medicine conference, Newcastle-upon-tyne.
•
Akubat, I., Patel, E., Barrett, S., and Abt, G., 2012. Methods of monitoring the training and match load and their relationship to changes
in fitness in professional youth soccer players. J Sports Sci.
•
Alexiou, H., and Coutts, A., 2008. A comparison of methods used for quantifying internal training load in women soccer players. Inter-
national Journal of Sports Physiology and Performance, 3(3), pp.320-330.
•
Baker, D., 2011. Recent trends in high-intensity aerobic training for field sports. UKSCA(22), pp.3-11.
•
Bangsbo, J., Mohr, M. and Krustrup, P., 2006. Physical and metabolic demands of training and match-play in the elite football player.
Journal of Sports Sciences, 24(7), pp.665-674.
•
Banister, E.W., 1991. Modeling Elite Athletic Performance. In J. D. MacDougall, H. A. Wenger & H. J. Green (Eds.), Physiological Testing
of Elite Athletes (pp.403-424). Champaign, Illinois: Human Kinetics.
•
Banister, E.W., Calvert, T.W., Savage, M.V. and Bach, A., 1975. A system model of training for athletic performance. Australian Journal
of Sports Medicine, 7, pp.170-176.
•
Banister, E.W., Carter, J.B. and Zarkadas, P., 1999. Training theory and taper: validation in triathlon athletes. European Journal of Applied
Physiology, 79(2), pp.182-191.
•
Borg, G., Hassmen, P. and Lagerstrom, M., 1987. Perceived exertion related to heart rate and blood lactate during arm and leg exercise.
European Journal of Applied Physiology and Occupational Physiology, 56(6), pp.679-685.
•
Bot, S.D. and Hollander, A.P., 2000. The relationship between heart rate and oxygen uptake during non-steady state exercise. Ergonomics,
43(10), pp.1578-1592.
•
Brink, M.S., Nederhof, E., Visscher, C., Schmikli, S.L. and Lemmink, K.A., 2010. Monitoring load, recovery, and performance in young
elite soccer players. Journal of Strength and Conditioning Research, 24(3), pp.597-603.
•
Buchheit, M., Al Haddad, H., Simpson, B. M., Palazzi, D., Bourdon, P. C., Di Salvo, V. and Mendez-Villanueva, A., 2013. Monitoring
Accelerations With GPS in Football: Time to Slow Down? Int J Sports Physiol Perform.
[email protected] 06 Aug 2018
FITNESS IN SOCCER
Training load monitoring in soccer
183
•
Buchheit, M., Simpson, B.M. and Mendez-Villanueva, A., 2013. Repeated high-speed activities during youth soccer games in relation to
changes in maximal sprinting and aerobic speeds. Int J Sports Med, 34(1), pp.40-48.
•
Busso, T., 2003. Variable dose-response relationship between exercise training and performance. Medicine and Science in Sports and
Exercise, 35(7), pp.1188-1195.
•
Busso, T., Carasso, C. and Lacour, J.R., 1991. Adequacy of a systems structure in the modeling of training effects on performance. J Appl
Physiol, 71(5), pp.2044-2049.
•
Busso, T. and Thomas, L., 2006. Using mathematical modeling in training planning. Int J Sports Physiol Perform, 1(4), pp.400-405.
•
Castagna, C., Impellizzeri, F.M., Chaouachi, A., Bordon, C. and Manzi, V., 2011. Effect of training intensity distribution on aerobic fitness
variables in elite soccer players: a case study. J Strength Cond Res, 25(1), pp.66-71.
•
Denadai, B.S., Ortiz, M.J., Greco, C.C. and de Mello, M.T., 2006. Interval training at 95% and 100% of the velocity at VO2 max: effects on
aerobic physiological indexes and running performance. Applied Physiology Nutrition and Metabolism, 31(6), pp.737-743.
•
di Prampero, P.E., Fusi, S., Sepulcri, L., Morin, J.B., Belli, A. and Antonutto, G., 2005. Sprint running: a new energetic approach. J Exp
Biol, 208(Pt 14), pp.2809-2816.
•
Di Salvo, V., Baron, R., Tschan, H., Montero, F.J., Bachl, N. and Pigozzi, F., 2007. Performance characteristics according to playing position
in elite soccer. International Journal of Sports Medicine, 28(3), pp.222-227.
•
Edwards, S. (1993). The heart rate monitor book. New York: Polar Electro Oy.
•
Elloumi, M., Makni, E., Moalla, W., Bouaziz, T., Tabka, Z., Lac, G. and Chamari, K., 2012. Monitoring training load and fatigue in rugby
sevens players. Asian J Sports Med, 3(3), pp.175-184.
•
Esposito, F., Impellizzeri, F.M., Margonato, V., Vanni, R., Pizzini, G. and Veicsteinas, A., 2004. Validity of heart rate as an indicator of aero-
bic demand during soccer activities in amateur soccer players. European Journal of Applied Physiology, 93, pp.167-172.
•
Esteve-Lanao, J., Foster, C., Seiler, S. and Lucia, A., 2007. Impact of training intensity distribution on performance in endurance athletes.
Journal of Strength and Conditioning Research, 21(3), pp.943-949.
•
Foster, C., Daines, E., Hector, L., Snyder, A.C. and Welsh, R., 1996. Athletic performance in relation to training load. Wisconsin Medical
Journal, 95(6), pp.370-374.
•
Gabbett, T.J. and Domrow, N., 2007. Relationships between training load, injury, and fitness in sub-elite collision sport athletes. Journal
of Sports Sciences, 25, pp.1507-1519.
•
Gaudino, P., Iaia, F.M., Alberti, G., Hawkins, R.D., Strudwick, A.J. and Gregson, W., 2013. Systematic Bias between Running Speed and
Metabolic Power Data in Elite Soccer Players: Influence of Drill Type. Int J Sports Med.
•
Gaudino, P., Iaia, F.M., Alberti, G., Strudwick, A.J., Atkinson, G. and Gregson, W., 2013. Monitoring Training in Elite Soccer Players: Sys-
tematic Bias between Running Speed and Metabolic Power Data. Int J Sports Med, 34(11), pp.963-968.
•
Gregson, W., Drust, B., Atkinson, G. and Salvo, V., 2010. Match-to-match variability of high-speed activities in Premier League soccer.
Int J Sports Med, 31(4).
•
Hoff, J., Wisloff, U., Engen, L.C., Kemi, O.J. and Helgerud, J., 2002. Soccer specific aerobic endurance training. British Journal of Sports
Medicine, 36(3), pp.218-221.
•
Iellamo, F., Manzi, V., Caminiti, G., Vitale, C., Castagna, C., Massaro, M., Franchini, A., Rosano, G. and Volterrani, M., 2012. Matched
dose interval and continuous exercise training induce similar cardiorespiratory and metabolic adaptations in patients with heart failure.
Int J Cardiol.
•
Impellizzeri, F.M., Rampinini, E., Coutts, A.J., Sassi, A. and Marcora, S. M., 2004. Use of RPE-based training load in soccer. Medicine and
Science in Sports and Exercise, 36(6), pp.1042-1047.
•
Impellizzeri, F.M., Rampinini, E. and Marcora, S.M., 2005. Physiological assessment of aerobic training in soccer. Journal of Sports Sci-
ences, 23(6), pp.583-592.
•
Lovell, R. and Abt, G., 2013. Individualization of time-motion analysis: a case-cohort example. Int J Sports Physiol Perform, 8(4),
pp.456-458.
•
Lucia, A., Hoyos, J., Santalla, A., Earnest, C. and Chicharro, J.L., 2003. Tour de France versus Vuelta a Espana: Which is harder? Medicine
and Science in Sports and Exercise, 35(5), pp.872-878.
•
Manzi, V., Antonio, B., Maria, I.F., Ivan, C. and Carlo, C., 2012. Individual training-load and aerobic-fitness variables in premiership
soccer players during the pre-competitive season. J Strength Cond Res.
•
Manzi, V., Castagna, C., Padua, E., Lombardo, M., D’Ottavio, S., Massaro, M., Volterrani, M. and Iellamo, F., 2009. Dose-response rela-
tionship of autonomic nervous system responses to individualized training impulse in marathon runners. Am J Physiol Heart Circ
Physiol, 296(6), pp.H1733-1740.
•
Manzi, V., Iellamo, F., Impellizzeri, F.M., D’Ottavio, S. and Castagna, C., 2009. Relation between individualized training impulses and
performance in distance runners. Medicine and Science in Sports and Exercise, 41(11), pp.2090-2096.
•
Minetti, A.E., Moia, C., Roi, G.S., Susta, D. and Ferretti, G., 2002. Energy cost of walking and running at extreme uphill and downhill
slopes. J Appl Physiol (1985), 93(3), pp.1039-1046.
•
Mohr, M., Krustrup, P. and Bangsbo, J., 2003. Match performance of high-standard soccer players with special reference to development
of fatigue. J Sports Sci, 21(7), pp.519-528.
•
Morton, R.H., 1990. Modeling human power and endurance. Journal of Mathematical Biology, 28(1), pp.49-64.
•
Osgnach, C., Poser, S., Bernardini, R., Rinaldo, R. and di Prampero, P.E., 2010. Energy cost and metabolic power in elite soccer: a new
match analysis approach. Med Sci Sports Exerc, 42(1), pp.170-178.
•
Rampinini, E., Coutts, A., Castagna, C., Sassi, R. and Impellizzeri, F.M., 2007. Variation in top level soccer match performance. Internati-
onal Journal of Sports Medicine, 28(12), pp.1018-1024.
•
Rampinini, E., Impellizzeri, F.M., Castagna, C., Coutts, A.J. and Wisloff, U., 2007. Technical performance during soccer matches of the
Italian Serie A league: Effect of fatigue and competitive level. Journal of Science and Medicine in Sport.
•
Rogalski, B., Dawson, B., Heasman, J. and Gabbett, T. J., 2013. Training and game loads and injury risk in elite Australian footballers. J
Sci Med Sport, 16(6), pp.499-503.
•
Seiler, S. and Tonnessen, E., 2009. Intervals, thresholds and long slow distance: the role of intensity and duration in endurance training.
Sports Science, 13, pp.32-53.
•
Stagno, K. M., Thatcher, R. and Van Someren, K.A., 2007. A modified TRIMP to quantify the in-season training load of team sport players.
Journal of Sports Sciences, 25(6), pp.629-634.
•
Wallace, L.K., Slattery, K.M. and Coutts, A.J., 2013. A comparison of methods for quantifying training load: relationships between model-
led and actual training responses. Eur J Appl Physiol.
•
Winterbottom, W., 1952. Soccer Coaching. London: Naldrett Press.
[email protected] 06 Aug 2018
FITNESS IN SOCCER
Training load monitoring in soccer
[email protected] 06 Aug 2018
FITNESS IN SOCCER
Training continuum
185
11
TRAINING CONTINUUM
Jan Van Winckel, Werner Helsen, Jean-Pierre Meert,
Kenny McMillan, Paul Bradley
11.1 INTRODUCTION
In the preceding chapters, we described and defined various physical abilities, such
as speed and endurance, as well as physical parameters, such as volume and inten-
sity. We also outlined different methods that can be used to calculate training load.
In this chapter, we aim to provide an overview of the different effects of training.
There is a lack of clarity regarding the different terms in the existing literature, with
the concepts of overtraining, overreaching and overload being used interchange-
ably. For example, the term “overtraining syndrome” is used regularly in soccer
jargon, yet this state rarely occurs in soccer. Declines in performance can also be
due to other life stressors, so the term “underperformance syndrome” is sometimes
used (Budgett et al., 2000).
Successful training must involve overload, but it must also avoid the combination
of excessive overload and inadequate recovery. Athletes can experience short-term
performance decrements without severe psychological or other lasting negative
symptoms. This Acute Fatigue (AF) or Functional Overreaching (FOR) will eventu-
ally lead to an improvement in performance after adequate recovery. When athletes
do not sufficiently respect the balance between loading and unloading, Non-Func-
tional Overreaching (NFOR) can occur. The distinction between NFOR and the
Overtraining Syndrome (OTS) is very difficult and depends on the clinical outcome
and exclusion diagnosis (Meeusen et al., 2013).
[email protected] 06 Aug 2018
FITNESS IN SOCCER
Training continuum
186
Process
Training (overload)
Outcome
Acute fatigue
(AF)
Functional
overreaching
(short-term OR)
Non-Functional
overreaching
(extreme OR)
Overtraining
syndrome (OTS)
Recovery
Day(s)
Days - weeks
Weeks - months
Months -
…
Performance
Increase
Temporary
performance
decrement
Stagnation
decrease
Decrease
Example
Acute fatigue
Overreaching
Continued
Several months
after a day with
after a pre-
excessive
with stressful
two training
season training
training load
competition,
sessions
camp
after a training
camp with
stressful team
environment,
inadequate
excessive load
recovery
and inadequate
recovery
Table 11.1: The different stages that differentiate normal training from OR (functional and non-
functional OR) and the OTS. (Meeusen et al., 2013)
11.2 DIFFERENT STAGES OF THE TRAINING CONTINUUM
11.2.1 Detraining
Undertraining or detraining involves a load that is insufficient to maintain or stimu-
late positive adaptation. Many terms—such as tapering, active recovery and unloa-
ding—are also used interchangeably in relation to detraining or undertraining.
Set out below is an overview of the most widely used terms:
1. Active recovery or unloading allows both the training volume and intensity to
drop. Active recovery is used to recover from match load or successive heavy
training loads.
2. Taper: The highest level of performance follows on from a period of tapering.
Tapering is defined by Mujika et al. (2003) as a progressive, nonlinear reduction
of training load over a particular period in order to reduce psychological and
physiological stress and therefore optimize performance. Tapering differs from
unloading in the sense that although the volume and frequency decrease, the
intensity remains the same (80–100%). This process is very individual, but the
best results are typically seen after a recovery period of 7–14 days, which is not
possible in the calendar of professional soccer. In soccer, tapering strategies are
imposed in every microcycle for the days preceding a match and during the last
phase of preseason, just before the start of the season.
3. Detraining: The term “detraining” is used when a player’s performance level
drops. The detraining effect will appear, for example, a few weeks into the
off-season, when players’ fitness levels begin falling rapidly.
[email protected] 06 Aug 2018
FITNESS IN SOCCER
Training continuum
187
The reduction in aerobic endurance is significantly greater than for other motor
abilities, such as strength, power and flexibility. In a study conducted by Sal-
tin (1968), five people were kept in bed for 20 days. Their VO
2max fell by 25%.
This drop can be mainly attributed to a decline in the heart’s performance that
occurs, in particular, during the first 12 days of detraining.
The physiological effects of 2–4 weeks detraining:
• VO
2max: - 5–10%
• resting and submaximal exercise HR: + 5–10%
• blood volume: - 5–10%
• stroke volume: - 6–12%
• cardiac output: reduced
• flexibility (suppleness): reduced
• lactate threshold: reduced
• muscle glycogen stores: - 15–30%
• aerobic enzyme activity: reduced
Physiological adaptations lost over a particular period need more time to recover
than it takes to detrain them. Fourteen days of detraining is sufficient to induce a
significant decrease in VO
2max, but it takes considerably longer than two weeks to
return to the same baseline levels. The mechanisms of physical deconditioning are
many, but it seems that hypovolemia (a decrease in volume of blood plasma), decre-
ases in the activity of oxidative enzymes, and lower muscle glycogen stores are the
first factors responsible for a decrement in performance (Oliviera et al., 2008).
11.2.1.1 Effects of training parameters
As highlighted above, detraining is a consequence of reduced frequency, intensity
and/or volume. An overview of the effects of a reduction in these three factors is
set out below:
1. Reduction in frequency: If training is reduced from six sessions to three ses-
sions, while the volume and intensity are maintained, there is no substantial
detraining effect.
2. Reduction in intensity: If the training intensity is reduced by 50%, performance
will be diminished significantly.
3. Reduction in volume: Even if the total volume is reduced by 50%, the detrai-
ning effect can be limited.
This shows that a reduction in intensity, in particular, induces a detraining effect.
Reference
Days of inactivity
Percentage
Houston, Bentzen, & Larsen, (1979)
15
−4 % VO
2max
Martin et al. (1986)
40
−20 % VO
2max
Houmard, Hortobagyl, & Johns (1992)
14
−5 % VO
2max
Coyle et al. (1984)
21
−8 % Cardiac Output
Chi et al. (1983)
21
−64 % activity aerobic enzymes
Costill et al. (1985)
7
−20 % Glycogen store
Table 11.2: Overview of detraining effects
[email protected] 06 Aug 2018
FITNESS IN SOCCER
Training continuum
188
11.2.2 Retaining (maintenance)
A retaining or maintenance load is used when further positive adaptation and/
or overload are contraindicated, but maintenance of physical capacity is desired.
Soccer training for 60–70 minutes at 60–70% intensity is a good example of main-
tenance training for professional players. Although strategies to maintain stable
performance throughout the season are key to a successful season, retaining loads
are rarely investigated by scientific research.
11.2.3 Acute fatigue
Overload training disturbs players’ homeostasis and results in acute fatigue, follo-
wed by an improvement in performance. (Soccer example: two consecutive inten-
sive training sessions). Intensified training is commonly employed by coaches in
an attempt to enhance performance. Subsequently, the player may experience acute
feelings of fatigue and decreases in performance because of a single intense trai-
ning session or an intense training period. The resultant acute fatigue can be fol-
lowed, after an adequate rest period, by a positive adaptation or improvement in
performance, and this is the foundation of effective training programs (Meeusen et
al., 2013). The sequence of training and the interrelationship between training and
recovery are crucial factors in achieving the desired training response.
The term overtraining is often used in soccer. In this book, the term “overtraining”
is used as a “verb” to refer to a process of intensified training that possibly results
in short-term overreaching (functional OR), extreme overreaching (non-functional
OR), or OTS, depending on the appropriate balance between loading and unloa-
ding cycles (Halson and Jeukendrup, 2004).
11.2.4 Functional overreaching (FOR) or short-term OR
When training continues and fatigue accumulates, or when coaches purposely use
a short period (e.g., a training camp) to increase training load (fatigue accumula-
tion), players can experience short-term performance decrements without severe
psychological or long-term negative symptoms. This functional OR (or short-term
OR) will ultimately lead to an improvement in performance after adequate reco-
very (supercompensation effect). (Soccer example: A seven-day training camp fol-
lowed by 3–4 days of adequate recovery.)
Overreaching is an integral part of successful training regimes, and it can be ana-
lyzed using a multidisciplinary approach involving physiological and psychome-
tric data. Overreaching is often utilized by coaches during a typical training cycle
to enhance performance. Intensified training can result in decreased performance,
but when appropriate periods of recovery are provided, a “supercompensation”
effect may occur, with the player unveiling (because of reduced levels of fatigue)
an enhanced performance. This process is often used during “training camps,” and
it will lead to a temporary performance decrement that is followed by improved
performance. In this situation, the physiological responses will compensate for the
training-related stress (Steinacker et al., 2004). This form of short-term “Overrea-
ching” can also be called “Functional Overreaching.”
[email protected] 06 Aug 2018
FITNESS IN SOCCER
Training continuum
189
11.2.5 Dysfunctional or Non-Functional Overreaching (NFOR)
When coaches do not sufficiently respect the balance between training and reco-
very, NFOR (extreme OR) may occur. At this stage, the first signs and symptoms
of prolonged training distress are performance decrements, psychological distur-
bance, decreased vigor, increased fatigue, and hormonal disturbances. Players will
often require weeks or months to recover. An example in soccer would be when
a team plays competitive games twice a week for six consecutive weeks without
respecting adequate recovery between games. Dysfunctional overreaching is the
point along the training continuum when functional overreaching results in more
persistent decreases in performance (Moore and Fry, 2007).
11.2.6 Overtraining syndrome (OTS)
Although this term is frequently used, overtraining rarely occurs in soccer. OTS
occurs mainly in individual athletes (especially endurance athletes) and is the con-
sequence of an excessive training load over a prolonged period. In most cases, OTS
will occur in combination with other stressors, such as psychological, immunolo-
gical, social, and so on. The confusion surrounding OTS is complicated by the fact
that the clinical features are non-specific, anecdotal, and numerous (Meeusen et
al., 2013).
The distinction between NFOR and OTS is very difficult, because a player will
often display the same clinical, hormonal, and psychological signs and symptoms.
A key phrase in the recognition of OTS might be the “prolonged maladaptation” of
several biological, neurochemical, and hormonal regulation mechanisms (Meeusen
et al., 2013). Recovery from overtraining syndrome can take months (Kreider et al,
1998).
In a study by Morgan et al. (1988), 12 male swimmers were assessed prior to,
during, and after increasing their workloads from 4,000m to 9,000m at 94% VO
2max
over a ten-day period. Swimmers completed a POMS (profile of mood status), mus-
cle soreness scale, and 24-hour history each morning before starting the first of
two daily training sessions. Seven swimmers successfully completed the required
training regimen, but three others had difficultly completing the training require-
ments, and these athletes had significantly higher levels of POMS mood distur-
bance. Many of the physiological and psychological responses tended to stabilize
after the first five days of exposure to the training stress. Three other swimmers
were so severely affected by the training that they had to be dropped from the
study. In those swimmers, the psychological changes were very marked.
11.3 LOAD AND LOAD TOLERANCE
Overtraining, acute fatigue and overreaching are the result of an imbalance bet-
ween load (physiological, mechanical, and psychological) and the load tolerance
of the player. If the accumulated load exceeds the player’s load tolerance for too
long, functional or dysfunctional overreaching may occur, resulting in a decline
in performance and a substantial risk of injury. The training process should the-
refore always constitute a perfect balance between the accumulated load and the
load tolerance. Players’ load tolerances are determined individually. Within any
team, there will be players who will respond positively or only barely to a training
plan, depending on the nature of players and their ability to cope with the trai-
ning demands and non-training stress factors. In an appropriate training plan, the
[email protected] 06 Aug 2018
FITNESS IN SOCCER
Training continuum
190
player will receive an suitably individualized training stimulus (duration, intensity
and frequency) that will increase the load tolerance (functional adaptation). Trai-
ning is not a one-sided form of loading, and overload phenomena vary for different
physical abilities.
[email protected] 06 Aug 2018
FITNESS IN SOCCER
Training continuum
191
11.3.1 Conceptual framework describing the interplay between load and
load tolerance
Fig. 11.2: This figure shows the effects of training load (duration x intensity) for an individual player.
If this player trains just below the injury threshold (load tolerance), his or her fitness will improve,
subsequently increasing the threshold. If the player trains too far below this threshold, he or she will
either sustain the fitness level (retaining load) or even lose it (detraining load). Training above the
injury threshold will cause overreaching and may lead to injury.
We illustrate this based on a number of example training sessions for a player:
• T1: Session of ± 60 minutes at ± 30%: This load is insufficient for the player
to maintain fitness.
• T2: Session of ± 70 minutes at ± 60%: This load is sufficient for a player to
maintain fitness.
• T3: Session of ± 100 minutes at ± 55%: This load is sufficient for the player
to make progress. The load is just below the injury threshold, so training will
consequently improve the player’s fitness and therefore push the injury thres-
hold higher.
• T4: Session of ± 120 minutes at ± 45%: Although the training parameters for
this session differ from training session T3, the load is also sufficient for the
player to make progress.
• T5: Session of ± 70 minutes at 70%: This load is too high for this player, so the
likelihood of injury increases.
• T6: Session of ± 130 minutes at ± 70%: This load is much too high for the
player, so the risk of the player sustaining an injury because of accumulated
fatigue is high.
[email protected] 06 Aug 2018
FITNESS IN SOCCER
Training continuum
192
Fig. 11.3: T
his figure shows the shift in the player’s injury threshold due to increased fitness levels.
Fig. 11.4: This is a typical representation of a group of soccer players. Here we have illustrated the
overload zones for three players. Player 1 is a physically weaker player. Player 2 is a physically
moderate player, and player 3 is a physically strong player who is able to handle a high load. For
the sake of this example, we discuss three training loads, T1, T2 and T3.
[email protected] 06 Aug 2018
FITNESS IN SOCCER
Training continuum
193
T1 is a 95-minute session at 30%. This is a low-endurance training session that is
therefore ideal for player 1, but this training load is insufficient to elicit adaptation
in players 2 and 3.
T2 is an 80-minute session at 50%. This training load is ideal for player 2, because
it is a good stimulus to cause fatigue and consequently adaptation. The load is too
high for player 1 and too low for player 3.
Finally, T3 is a 75-minute training session at 70%. In this example, the load is ideal
for player 3, but too high for player 2 and much too high for player 1.
This graph perfectly illustrates the everyday situation in soccer where too much
training is carried out in a group setting. For example, Hoff et al. (2002) demonstra-
ted that players with the highest VO
2max had the lowest percentage of VO2max during
small-sided games. This indicates that soccer players with higher fitness levels may
not receive sufficient training stimulus to further increase their fitness when trai-
ning in a team environment (Hoff et al., 2002).
Finally, we should also highlight that this is a simplified model that does not take
account of the consequences arising from previous loads and recovery and the dif-
fering effects of intensity and volume training. It clearly depicts, however, the inter-
play between load and load tolerance.
11.4 OVERTRAINING DETECTION SCALE
The table below presents a scale that can be used for the early detection of overtrai-
ning. Overtraining phase 2 can be used as an indicator for detecting and avoiding
overreaching at an early stage. Training has to be adjusted from this threshold in
order to avoid injuries.
Overtraining detection scale
Overtraining phase 0
no pain/fatigue at all
Overtraining phase 1
player feels muscle pain/fatigue in the morning after
waking up
Overtraining phase 2
player feels muscle pain/fatigue in between exercises
Overtraining phase 3
player feels muscle pain/fatigue at the start of the warm up
but the pain/fatigue fades during warm up
Overtraining phase 4
player feels muscle pain/fatigue at the start of the training,
but the muscle pain/fatigues fades during training
Overtraining phase 5
Muscle pain/fatigue is constantly present during the
training session.
Overtraining phase 6
Training is no longer possible.
Table 11.3: Overtraining detection scale
This table can be used to question the players, such as by using questionnaires or
smartphone apps, when they arrive at the club each morning. This subjective infor-
mation can be used by the coaches to adjust training parameters.
[email protected] 06 Aug 2018
FITNESS IN SOCCER
Training continuum
194
11.5 TRAINING FLAWS
Several authors have discussed flaws in the training process (Harre, 1982; Fry et al.,
1992; Noakes, 1991; Dalton, 1992; Foster et al., 1999; Bompa, 1999; Dick, 2003; Smith,
2003). These training flaws are summarized below:
• Improper balance between intensity and recovery
• Inappropriate lifestyle
• Insufficient support of the social environment
• Neglecting adequate recovery in the microcycle, mesocycle, and macrocycle
sequences
• High volume of maximal and submaximal intensity training
• The overall volume of intense training is too high
• Excessive attention and time are spent in complex technical or mental aspects
without adequate physical and mental recovery
• Demands on an athlete are made too quickly relative to load tolerance, com-
promising the adaptive process
• Improper technique
• Muscle weaknesses and imbalances
• Early specialization
• Not enough or too many hard training sessions
• Starting intensive training sessions without a proper “aerobic” platform
• Excessive number of competitions with maximum physical and psychological
demands combined with frequent disturbances in the daily routine and insuf-
ficient training
• The player lacks trust in the coaching staff because of high expectations or goal
setting that has led to frequent performance decrements or failure in the past
• The training load is increased too rapidly after a break from training due to
illness, injury or the off-season
• Not alternating hard and easy training
Some authors (Pyne, 1996; Daniels, 1998; Harre, 1982) have published some recom-
mendations to avoid overtraining and elicit adaptation:
• Long-term performance goals for the season form the basis upon which the
training program is designed
• Progressive and cyclical increase in training load
• Incorporating a maximum of 2–3 hard sessions in a microcycle
• Logical sequence to the order of the training phases
• Hard and easy training sessions are alternated
• Training process is supported by continuous scientific monitoring
• Intensive use of recovery strategies throughout the training program
• Emphasis on skill development and refinement maintained throughout the
training program
• Underlying platform for the improvement and maintenance of general athletic
abilities
[email protected] 06 Aug 2018
FITNESS IN SOCCER
Training continuum
195
11.6 RELATION BETWEEN LOAD, INJURIES, FITNESS AND PERFORMANCE
In this section, we describe a theoretical concept to describe the relationship bet-
ween training load, injuries, fitness and performance in soccer. We start with the
scientific fundaments of our concept.
11.6.1 Relation between load and performance
High
Low
Rela4on between volume of training and team
success
Adapted from: Ekstrand et al. 1982
Low
Hours of training
High
Fig. 11.5: Relationship between volume of training and team success
Ekstrand et al. (1982) found a direct association between team success in soccer,
as expressed by league points during the year, and the volume of training. In this
study, the volume of training for each team was expressed as the number of prac-
tice hours in which the 15 players participated (i.e., attendance multiplied by num-
ber of practice sessions).
P
o
in
ts
in
t
h
e
lea
gu
e
[email protected] 06 Aug 2018
FITNESS IN SOCCER
Training continuum
196
11.6.2 Relation between training load and injuries
High
Rela5on between training load and
likelihood of injury
Adapted from: Gabbe> & Domrow 2007,
Gabbe> 2010
Low
Training load
High
Fig. 11.6: Relationship between training load and the likelihood of injury in collision sport athletes
(footnote: This figure is not entirely accurate in its modification. At very high loads, the risk of
injury plateaus, and further increases in load result in only minimal change in injury risk (Gabbett,
personal communication)
In a study of Gabbett (2010), athletes who surpassed a predefined training load
threshold were 70-fold more likely to test positive for non-contact muscle injury.
Previous research reported a relationship between training loads and injury rates,
suggesting that the harder athletes train, the more injuries they will sustain (Gab-
bett, 2004). Gabbett and Domrow (2005) demonstrated that team sport athletes who
perform less than 18 weeks of preseason training are at increased risk of sustaining
a reinjury, while players with a low off-season VO
2max are at an increased likelihood
of sustaining a contact injury (Gabbett and Domrow, 2005).
Enhancements in soccer require training loads that balance the minimum training
loads required to elicit a fitness enhancement with the maximum training load
bearable (load tolerance) before sustaining an injury. Gabbett and Domrow (2005)
found a relationship between the log of training load per week and the odds of
injury during the pre-, early-, and late-competition phases. These results confirm
earlier research that demonstrated that the likelihood of sustaining an injury is
higher in the preseason preparation period when training loads are greatest (Gab-
bett, 2004).
Low
Li
el
ih
o
o
d
of
in
ju
ry
[email protected] 06 Aug 2018
FITNESS IN SOCCER
Training continuum
197
Rela7on between training and number of injuries
Adapted from: Ekstrand et al. 1982
High
Low
Low
Hours of training
High
Fig. 11.7: Relationship between volume of training over a soccer season and the number of injuries
Ekstrand et al. found a curved relationship between injuries and training in soc-
cer. Teams with fewer than average training hours (<1400 hr/team) showed an
increasing number of injuries with increased training, while teams with greater
than average training hours showed a decrease in injuries with increased training
(p < 0.01). The researchers attributed the increasing number of injuries with in-
creased training to prolonged exposure. The fewer injuries in teams with higher trai-
ning volumes is explained in the study as a refl
of the well-known fact that
well-trained athletes sustain fewer injuries. The fact that players in this study did
not sustain more injuries with increased training could be due to the level of the play-
ers (Division 4 in Sweden). These players are probably not exposed to training loads
that are suffi to elicit overreaching levels and surpass injury threshold levels.
11.6.3 Relation between number of injury days and performance
High
Rela5on between number of injury days and the
final league standing
Adapted from: Arnason et al. 2004
Low
High posi5on
Final league standing
Low posi5on
Fig. 11.8: Relation between number of injury days and the final league standing
Nu
m
b
e
r
of
in
ju
ry
d
ay
s
N
u
mb
er
of
in
ju
ri
e
s
[email protected] 06 Aug 2018
FITNESS IN SOCCER
Training continuum
198
Arnason et al. (2004) investigated the relationship between the number of injury
days and the final league standing. Injuries to key players, as well as a reduced
number of available players, are expected to affect team performance. Although
injured players can be replaced by substitutes, the researchers observed a trend
toward a significant relationship between the total number of injury days per team
and team success. They explain this association by the fact that in Iceland, soccer
teams have limited resources to replace injured players. In the major European lea-
gues, however, teams are in a position to buy new quality players when needed,
so it is possible that injuries could be seen to be more of a financial issue and less
directly related to team performance on the pitch. The association between inju-
ries and final league standing was confirmed in a study by Eirale et al. (2013). The
researchers reported strong correlations between injury incidence and high league
rankings in the Qatari Stars League. They also found a significant relationship bet-
ween a low number of injuries and the number of games won, number of goals sco-
red, goal difference, and total number of points in a season. Hägglund et al. (2013)
investigated the influence of injuries on team performance in soccer and found that
a lower injury burden and higher match availability were related with higher final
league ranking. Similarly, lower injury incidence, lower injury burden, and higher
match availability were related with increased points per league match. The resear-
chers concluded that injuries had a significant influence on performance in league
play and in European cups in male professional soccer. They therefore stressed the
importance of injury prevention to increase a team’s chances of success.
11.6.4 Theoretical concept on the association between load, injuries, fitness
and performance
Fig. 11.9: Relationship between training load and fitness, performance and injuries (modified from
Orchard, 2012)
[email protected] 06 Aug 2018
FITNESS IN SOCCER
Training continuum
199
This is a hypothetical representation of the association between training load
(x-axis) and injuries, fitness and performance (y-axis).
Injury: Injuries are often associated with reductions in performance. It is not clear,
however, whether poor performance is the cause or the effect of high injury rates.
The likelihood of training injury increases with mounting training loads (Gabbett,
2004; Gabbett and Domrow, 2005; Gabbett and Ullah; Gabbett, 2010; Gabbett and
Ullah, 2012). In this graph, the rate of injury increases exponentially because it
is assumed that the higher the training load, the more players will surpass their
injury thresholds.
Fitness: The fitness of players increases with increasing training loads. At some
point (point 8 on the graph), however, the load will become too high for the load
tolerance of the players. Overtraining will occur, and additional training stimuli
will be detrimental to fitness.
Performance: Performance is influenced by two antagonistic factors. Injuries affect
performance in soccer negatively (Arnason et al., 2004; Hägglund et al., 2013;
Eirale, 2013), while fitness affects performance positively.
Point 6 on the graph indicates the optimal relationship between training injury
and fitness. Injury rates start to increase, but due to the raised levels of fitness,
performance reaches its peak level. Fitness levels increase further with increasing
training load (point 7), but the injury rates start to increase exponentially. These
injury rates influence performance negatively, so performance starts to decrease.
The prevention of injuries and the enhancement of fitness are often regarded as two
discrete pursuits at different ends of the training continuum. Medical and technical
staff often appear to have different goals. Medical staff see the value in monitoring
training loads to reduce injuries, while technical and sports science staff would like
athletes to complete high training loads to elicit positive physical adaptations. The
key performance indicator of a team doctor or physiotherapist should theoretically
relate to the “injury” curve on the graph, and they might even be more comfortable
with a low training load and a reduction in training (Orchard, 2012). Some soccer
managers often use injuries as an excuse for poor results because there is still a
common view that injuries are generally random and therefore out of a manager’s
control (Orchard, 2012).
SUMMARY
A successful periodized soccer training program must involve overload in order
to induce beneficial training adaptations, but it must also avoid the combination
of excessive overload and inadequate recovery. In order to optimize performance
enhancement and ensure that players reach the fitness level required, scienti-
fic monitoring of training loads is essential to help players avoid accumulating
excessive fatigue and surpassing their own individual load tolerance and injury
threshold.
[email protected] 06 Aug 2018
FITNESS IN SOCCER
200
Training continuum
REFERENCES
•
Arnason, A., Sigurdsson, S.B., Gudmundsson, A. and Holme, I., 2004. Physical fitness, injuries, and team performance in soccer. Medicine
and Science in Sports and Exercise, 36(2), pp.278-285.
•
Budgett, R., Newsholme, E., Lehmann, M., Sharp, C., Jones, D., Peto, T., Collins, D., Nerurkar, R. and White, P., 2000. Redefining the over-
training syndrome as the unexplained underperformance syndrome. British Journal of Sports Medicine, 34, pp.67–68.
•
Bompa, T.O., 1999. Periodization: theory and methodology of training. 4th ed. Champaign, IL: Human Kinetics.
•
Chi, M.Y., Hintz, C.S., Coyle, E.F., Martin, W.H., Ivry, J.L., Nemeth, P.M., Holloszy, J.O., Lowry, O.H., 1983. Effects of detraining on enzy-
mes of energy metabolism in individual human muscle fibers. Am J Physiol, 244, pp.276–287.
•
Costill, D.L., Fink, W.J., Hargreaves, M., King, D.S., Thomas, R. and Fielding, R., 1985. Metabolic characteristics of skeletal muscle during
detraining from competitive swimmers. Med Sci Sports Exerc, 17, pp.339–343.
•
Coyle, E.F., Martin, W.H., Sinacore, D.R., Joyner, M.J., Hagberg, J.M. and Hollosky J.O., 1984. Time course of loss of adaptations after
stopping prolonged intense endurance training. J Appl Physiol, 57, pp.1857–1864.
•
Dalton, S.E., 1992. Overuse injuries in adolescent athletes. Sports Med., 13(1), pp.58–70.
•
Daniels, J., 1998. Daniels’ running formula. Champaign, IL: Human Kinetics.
•
Dick, F.W., 2002. Sports training principles. 4th ed. London: A and C Black. p.214.
•
Eirale, C., Tol, J.L., Farooq, A., Smiley, F. and Chalabi, H., 2013. Low injury rate strongly correlates with team success in Qatari professi-
onal football. Br J Sports Med, 47, pp.807–8.
•
Ekstrand, J., Gillquist, J., Möller, M., Oberg, B. and Liljedahl, S.O., 1983. Incidence of soccer injuries and their relation to training and team
success. The American journal of sports medicine, 11(2), pp.63-7.
•
Foster, C., Daniels, J.T. and Seiler, S., 1999. Perspectives on correct approaches to training. In: J.M. Steinacker, ed. 1999. Overload, perfor-
mance, incompetence, and regeneration in sport. New York: Kluwer Academic/Plenum Publishers. pp.27–41.
•
Fry, A.C, Kraemer, W.J., Stone, M.H., Kearney, J.T., Fleck, S.J., Thrush, J., Gordon, S.E., and Triplett, N.T., 1992. Endocrine and per-
formance responses during one month of periodized weightlifting with amino acid supplementation. J. Appl. Sport Sci. Res., 6:(183).
•
Gabbett, T.J., 2004. Influence of training and match intensity on injuries in rugby league. Journal of Sports Sciences, 22, pp.409–417.
•
Gabbett T.J. and Domrow, N., 2005. Risk factors for injury in subelite rugby league players. Am J Sports Med, 33(3), pp.428—34.
•
Gabbett, T.J., 2010. The development and application of an injury prediction model for noncontact, soft-tissue injuries in elite collision
sport athletes. J Strength Cond Res, 24(10), pp.2593–2603.
•
Gabbett, T.J. and Jenkins, D.G., 2011. Relationship between training load and injury in professional rugby league players. J Sci Med
Sport, 14(3), pp.204-9.
•
Gabbett, T.J. and Ullah, S., 2012. Relationship between running loads and soft-tissue injury in elite team sport athletes. J Strength Cond
Res, 26(4), pp.953-60.
•
Halson, S.L., and Jeukendrup, A.E., 2004. Does over-training exist? An analysis of overreaching and overtraining research. Sports Medi-
cine, 34(14), pp.967-981.
•
Hägglund, M., Waldén, M., Magnusson, H., Kristenson, K., Bengtsson, H. and Ekstrand, J., 2013. Injuries affect team performance nega-
tively in professional football: an 11-year follow-up of the UEFA Champions League injury study. Br J Sports Med, 47, pp.738–742.
•
Harre, D., 1982. Principles of sports training: introduction to the theory and methods of training. 1st ed. Berlin: Sportverlag.
•
Houmard, J.A., Hortobagyl, T. and Johns, R.A., 1992. Effects of short-term training cessation on performance measures in distance run-
ners. Int J Sports Med, 13, pp.572–576.
•
Houston, M.E., Bentzen, H. and Larsen, H., 1979. Interrelationships between skeletal muscle adaptations and performance as studied by
detraining and retraining. Acta Physiol Scand, 105, pp.163–170.
•
Kreider, R., Fry, A.C. and O’Toole, M., 1998. Overtraining in sport: terms, definitions, and prevalence. In: R. Kreider, A.C. Fry and M.
O’Toole, eds. 1998. Overtraining in sport. Champaign, IL: Human Kinetics. pp.7-9.
•
Martin, W.H., Coyle, E.F., Bloomfield, A.S. and Ehsani, A.A., 1986. Effects of physical deconditioning after intense endurance training on
left ventricular dimensions and stroke volume. J Am Coll Cardiol, 7, pp.982–989.
•
Meeusen, R., Duclos, M., Foster, C., Fry, A., Gleeson, M., Nieman, D., Raglin, J., Rietjens, G., Steinacker, J., Urhausen, A., 2013. Prevention,
diagnosis and treatment of the overtraining syndrome: Joint consensus statement of the European College of Sport Science (ECSS) and
the American College of Sports Medicine (ACSM), European Journal of Sport Science, 13(1), pp.1-24.
•
Moore, C.A. and Fry, A.C., 2007. Nonfunctional overreaching during off-season training for skill position players in collegiate American
soccer. Journal of Strength and Conditioning research, 21(3), pp.793-800.
•
Morgan, W.P., Costill, D.C., Flynn, M.G., Raglin, J.S. and O’Connor, P.J., 1988. Mood disturbance following increased training in swim-
mers. Med Sci Sports Exerc, 20, pp.408-414.
•
Mujika I. and Padilla, S. 2003. Scientific bases for precompetition tapering strategies. Med Sci Sports Exerc, 35(7), pp.1182-7.
•
Noakes, T.D., 1991. Lore of running. 3rd ed. Champaign, IL: Human Kinetics.
•
Oliviera, N., Legrandb, R., Rogeza, J., Berthoinb, S. and Weisslandd T., 2008. Arrêt de l’entraînement et déconditionnement à l’effort
aérobie. Science & Sport, 23(3–4), pp.136–144.
•
Orchard, J., 2002. Understanding some of the risks for soft tissue injury–a Malcolm Blight legacy? J Sci Med Sport, 5(2), pp.5-7.
•
Orchard, J.W., 2009. On the value of team medical staff: can the “Moneyball” approach be applied to injuries in professional football? Br
J Sports Med, 43(13), pp.963-5.
•
Orchard, J.W., James, T., Portus, M., Kountouris, A. and Dennis, R., 2009. Fast bowlers in cricket demonstrate up to 3- to 4-week delay
between high workloads and increased risk of injury. Am J Sports Med, 37(6), pp.1186-92.
•
Orchard, 2012. Who is to blame for all the football injuries? [online] Available at: who-is-to-blame-for-all-the-football-injuries/>
•
Pyne, D., 1996. The periodization of swimming training at the Australian Institute of Sport. Sports Coach, 18, pp.34–8.
•
Smith, D.J., 2003. A framework for understanding the training process leading to elite performance. Sports Med., 33(15), pp.1103-26.
•
Steinacker, J., Lormes, W., Liu, Y., Reissnecker, S., Opitz-Gress, A., Baller, B., Günther, K., Petersen, K.G., Kallus, K.W., Lehmann, M. and
Altenburg, D., 2000. Training of Junior Rowers before World Championships. Effects on performance, mood state and selected hormonal
and metabolic responses. J Sports Med Phys Fitness, 40, pp.327–35..
[email protected] 06 Aug 2018
FITNESS IN SOCCER
Fatigue
201
12
FATIGUE
Jan Van Winckel, Kenny McMillan, Paul Bradley,
David Tenney, Werner Helsen
12.1 INTRODUCTION
Throughout this textbook, the management of fatigue is considered as a critical
component to successfully plan a soccer season. Before discussing in more detail
the methods of managing fatigue, let us first examine the term fatigue in this chap-
ter. There are many definitions of fatigue in the existing literature. Fatigue is mostly
defined as an acute impairment of performance that includes both an increase in
the perceived effort to exert a desired force or power and/or any reduction in the
ability to exert maximal muscle force or power (Gandevia, 2001). In soccer, fatigue
is generally referred to as an inability to maintain physical and technical perfor-
mance during a match. The exercise intensity of top-class soccer players declines in
periods during a game, most likely due to fatigue, particularly toward the end of
the match (Mohr et al., 2005).
Although extensive research has examined the causes of fatigue in soccer, a number
of questions remain. The molecular basis of the fatigue process, in particular, is still
not understood completely. There are different causes for different types of sport.
For example, the fatigue induced by an 800m run is completely different to that of
a marathon. The loss of muscle function is quite complex and varies from reduced
functioning of the motor cortex in the brain to the binding of actin and myosin.
There are various causes of fatigue, and scientists typically divide them into cen-
tral and peripheral factors. Fatigue can be classified as central when the origin is
proximal and/or peripheral when the origin is distal to the neuromuscular junction
(Gandevia, 2001). Central fatigue seems to be the main cause of the decline in maxi-
mal voluntary contraction and sprinting ability, whereas peripheral fatigue seems
to be more related to increased muscle soreness and therefore may be linked with
muscle damage and inflammation (Rampinini et al., 2011).
[email protected] 06 Aug 2018
FITNESS IN SOCCER
Fatigue
202
12.2 FATIGUE IN A SOCCER MATCH
One of the consequences of playing a match is a decrease in muscle power, which
is reflected by a drop in physical capacity toward the end of the match. Research
initially primarily focused on peripheral factors, such as diminished energy stores,
increase in body core temperature, fluid loss, muscle damage and various com-
binations of factors. Recently, more attention has been paid to the central factors,
mental fatigue and the role of the nervous system. Generally speaking, it can be
concluded that physical performance decreases toward the end of a match (Rampi-
nini et al., 2008), although one cannot discount the influence of tactics and context
(e.g., match importance, location, standard and score board) on the physical per-
formance of players. Therefore, it has been suggested that fatigue can be more effi-
ciently quantified using performance measurements (e.g., the distance run during a
match). Evidently, this is a difficult task because players do not always tax their full
capacity during a match and only usually tax themselves during intense periods of
match play when they carry out a flurry of high-intensity activities with minimal
recovery. Recent research pointed out that senior soccer players are able to cope
with the high demands of match play and demonstrated that no differences were
found in examples such as counter movement jumps executed both directly before
and after a match (Cortis et al., 2013). It might be that teams and players pace their
efforts in order to sustain the same work rate throughout the duration of the game,
suggesting that players may exert an effort below their physical capacity in the first
half as an energy conservation technique (Carling et al., 2008).
Research
Findings
Bangsbo et al.
(1991)
The distance covered in the first half was 5% greater than in the second
half.
Bradley and
Noakes (2013)
Players covering the most total distance in the first half illustrated the most
pronounced declines in the second half. This was not evident for players
covering moderate and low first half distances
Bradley et al.
(2009)
Players ran 21% less distance at high intensity in the last 15 minutes of the
match compared with the first 15 minutes.
Bradley et al.
(2010)
The distance covered at high speed was 18% lower in the last 15 minutes
of the match compared with the first 15 minutes.
Krustrup et al.
(2006)
Players’ performance over a 30m sprint dropped during the break and
immediately after the match.
Mohr et al. (2003)
The distance covered in the second half was 160m less than in the first
half.
Mohr et al. (2003)
A 5-minute period of increased intensity is followed by a period of
significantly less activity.
Rahnama et al.
(2002)
The risk of injury was greater in the first and last 15 minutes of the match.
Gaudino et al.
(2010)
They concluded that there are significant differences between the first and
second halves of the game. The distances covered in the second half,
when compared to the first half, are significantly lower for all categories of
run (p<0.05). In the second half, the distance covered at very high intensity
is significantly lower (p<0.01), while the number of recovery times greater
than 120s increases significantly compared to the first half (p<0.01).
[email protected] 06 Aug 2018
FITNESS IN SOCCER
Fatigue
203
Rahnama et al.
(2003)
This study compared the strength (measured with isokinetic equipment) of
the knee flexors (hamstrings) and the knee extensors (mainly quadriceps).
The strength of the two muscle groups had already decreased during
the break and diminished further toward the end of the match. The ratios
between both muscle groups fell, reducing the stability of the knee joint.
Rahnama et al.
(2006)
In this study, the fatigue of a number of muscles in a soccer match was
measured. This shows that fatigue during a match increased for various
muscles (rectus femoris, biceps femoris, tibialis anterior) toward the end of
the game.
Rampinini et al.
(2007)
A top Italian team covers a greater distance and works more at high
intensity in top games when compared with games at a lower level.
Reilly (2003)
Diminished performance is inversely proportional to VO .
2max
Reilly et al.
(2002)
Diminished sprinting performance was observed at the end of a match.
Strudwick and
Reilly (2001)
The distance covered during a match has increased significantly since the
introduction of the Premier League.
Van Gool et al.
(1988)
Van Gool et al. studied the distance run during matches in the Belgian
league. A distance of 444m was run in the first half.
Table 12.1: Overview of existing soccer literature.
12.3 UNDERLYING MECHANISMS OF FATIGUE
12.3.1 Metabolic effects
The decrease in muscle function is
referred to as peripheral fatigue.
During a soccer match, maximum
strength rarely decreases by more
than 30% because of new motor
units being recruited when needed.
In addition, synergistic muscles
can help compensate for any loss
of strength. Muscle strength falls
by around 10% after brief intense
exertions and can drop to 30% after
long physical exertions. This fati-
gue could be caused by metabo-
lic factors, such as a reduction of
adenosine triphosphate (ATP) and
creatine phosphate (CP) stores, a
depletion of muscle glycogen, or
drops in pH due to muscle acido-
sis, as well as biochemical factors
such as chlorine (Cl-), sodium (Na+), potassium (K+), calcium (Ca2+), lack of oxygen
(hypoxia), and structural damage (e.g., micro-traumas). Diminished functioning
of a muscle can also be of a neural origin through the reduced functioning of the
motor cortex in the brain. This process is referred to as central fatigue.
[email protected] 06 Aug 2018
FITNESS IN SOCCER
Fatigue
204
12.3.2 Glycogen stores
The depletion of glycogen stores in the muscles can be a contributing factor to fati-
gue in soccer. In a study by Krustrup et al. (2006), a high number of individual
muscle fibers were partly depleted of glycogen toward the end of a soccer match.
They concluded that low glycogen levels in individual muscle fibers explained
the impairment in sprinting at the end of the game. Furthermore, a decrease in
blood lactate toward the end of matches indicates a lower utilization of glycogen
(Bangsbo, 1994). Players also complete fewer sprints and work less “off-the-ball”
in the second half if they start a match with low glycogen stores (Saltin, 1973).
However, blood glucose concentration does not reach critical values during a
soccer match (Ekblom, 1986). Glycogen stores can be increased through training
adaptations.
Fig. 12.1: Relationship between muscle glycogen and perceived exertion over time.
Consuming an energy drink containing carbohydrates (CHO) during the half-
time interval, or using good nutrition strategies during the days leading up to the
match, can therefore delay fatigue (see Chapter 4).
12.3.3 Lactate and Acidosis
There is a discrepancy between blood lactate and muscle lactate. Muscle lactate
increases linearly with the intensity, while blood lactate increases exponentially.
The intracellular accumulation of lactate per se is not a major factor in muscle fati-
gue (Allen et al., 2009). The formation of lactate rather delays the fatigue process.
One of the consequences of anaerobic glycolysis is that hydrogen ions are produced
in addition to lactic acid. This causes acidosis in the cell. Acidity is expressed as a
pH value. The higher the pH value is, the more alkaline the sample is. The pH value
can vary between 0 and 14, with 7.0 being the neutral value. Everything greater
than 7.0 is alkaline, and everything less than 7.0 is regarded as acidic. The pH value
in a resting muscle is approximately 7.4. This value is important for most enzymes,
because they only function in an optimum way at values of around 7.4. This is why
there are a number of buffers built into the cell to absorb these hydrogen ions. Over
time, however, the buffer capacity of cells is exceeded, and the pH value in a cell
can fall to 6.9.
[email protected] 06 Aug 2018
FITNESS IN SOCCER
Fatigue
205
Although lactate and acidosis are often referred to as possible causes of fatigue in
soccer, it is unlikely that elevated muscle lactate and lowered muscle pH cause fati-
gue during a soccer game (Mohr et al., 2005).
Fig. 12.2: Relation between pH in blood and lactate. Acidosis is not caused by lactate but rather by
processes closely linked to the production of lactate.
12.3.4 Fatigue resulting from the rate of the energy supply
Muscles need oxygen in order to turn over energy via the oxidative system. Oxy-
gen is transported to the muscles by the blood. In the blood, hemoglobin binds with
oxygen. The quantity of hemoglobin in the blood determines the speed at which
fatigue occurs during periods of intensive physical exertion. A second factor is the
oxygen-binding capacity. At high altitudes, the O
2 pressure of inhaled air is lower
than at sea level, causing fatigue to occur more rapidly.
12.3.5 Exercise-induced muscle damage (EIMD) and delayed onset of
muscle soreness (DOMS)
A player may feel pain in his or her muscles after a match or strenuous training.
This is often attributed to a buildup of lactate in the muscles, but this is an incorrect
hypothesis. Muscles are put under strain during physical activity, and if a muscle
is overloaded (in particular eccentrically), microtraumas occur in the muscle tis-
sue, resulting in damage to muscle cells and capillaries. This mechanism develops
an inflammatory reaction, which can be established via a blood analysis. Reduced
muscle force, increased muscle soreness, increased concentrations of blood creatine
kinase (CK) and myoglobin (two indicators of muscle damage) are higher after
intensive physical activity, and these may be factors that contribute to performance
impairment after a match (Ascensão et al., 2008). Furthermore, overtraining causes
a buildup of residual substances, causing the capillaries to dilate so the residual
substances are easier to remove. This involves an accumulation of fluid in the mus-
cles, causing the blood vessels to contract and resulting in a lack of oxygen. The
pain a player feels one or two days after strenuous exertion is therefore the result
of pressure on the pain nerves in the muscles and the release of residual substances
that stimulate the nerves.
[email protected] 06 Aug 2018
FITNESS IN SOCCER
Fatigue
206
12.3.6 Muscle cramps
A cramp is a painful involuntary contraction of a group of muscles. Cramps mostly
occur at the end of a soccer match. It is often claimed that cramps are a result of
lactate or lack of fitness. Both claims are most probable not true, because muscle
cramps mostly occur in soccer players who have reached a certain level of fitness.
Muscle cramps can most likely be attributed to loss of fluid during the match and
muscle fatigue. Minerals such as calcium, iron, magnesium, potassium and sodium
are lost in sweat. Sweat contains approximately between 300 and 1500 mg of sodium
per liter. Since soccer players may lose more than three liters of water during mat-
ches (Mustafa and Mahmoud, 1979), they can also lose 3,000mg of sodium during
a match. Sodium losses in three liters of sweat can equal or exceed daily intake
(3,000–4,000mg) and lead to deficiencies. To prevent cramps, it is advisable to drink
at regular intervals and eat a balanced diet during the week. With some players
who have high sodium concentrations in their sweat, it is often noticeable that their
shirts display areas of sweat with white fragments after physical exertion. These
white fragments are the lost sodium. Stofan et al. (2003) reported that American
Football players with high sodium concentrations in their sweat may be particu-
larly susceptible to muscle cramps (Stofan et al., 2003). Bergeron (2003) suggested
that failure to adequately replace sweat salt losses predisposes players to muscle
cramps in tennis and proposes that these can be prevented by ensuring an adequate
salt intake. The most common form of sodium is sodium chloride, or table salt.
Milk and celery also naturally contain sodium, as does drinking water, although
the amount varies depending on the brand of mineral water. Water is commercially
available that contains larger quantities of electrolytes. In hot or humid conditions,
it is reasonable to plan an intake of up to 1,000mg (one-half teaspoon of salt) of
sodium per liter of fluid loss.
12.3.7 Temperature and fluid loss
An increase in body core temperature is beneficial for performance. Warming up
the muscles prior to the game and after the half-time break raises the performance
level. However, an excessively high body temperature (hyperthermia) reduces a
player’s performance. Factors such as dehydration and hyperthermia have been
suggested as mediators responsible for the development of fatigue in the later sta-
ges of a soccer game (Reilly, 1997). This is most likely a central form of fatigue, whe-
reby a critical core temperature of 40°C cannot be exceeded (Morrison et al., 2004).
However, there may not be an exact critical threshold for thermoregulation, but
rather one that varies with training, acclimation and time of day (Noakes, 2006).
Various publications have demonstrated that training and competing in hot and/
or humid conditions may result in reduced performances (Edwards and Clark,
2006; Duffield et al., 2009). A study of Mohr et al. (2010) provides direct evidence of
decreased repeated sprint and jump performances induced by soccer match play
and pronounced reduction in high-intensity running toward the end of an elite
game played in a hot environment. They conclude that this fatigue could be associ-
ated with training status and hyperthermia/dehydration.
[email protected] 06 Aug 2018
FITNESS IN SOCCER
Fatigue
207
12.3.8 Early dismissal
Carling and Bloomfield (2010) examined the effects of an early dismissal (after five
minutes of play) on work rate in a professional soccer match. The researchers pro-
pose that in 11 vs. 11, players may not always utilize their full physical potentials,
as this match illustrated an increase in overall work rate when reduced to 10 play-
ers. They conclude that a team with 10 players is likely to incur higher levels of fati-
gue, and tactical alterations may be necessary and/or players may adopt a pacing
strategy to endure the remainder of the match.
12.3.9 Travel
Elite soccer players are frequent travelers and sometimes have to cross multiple
time zones. These journeys are undertaken to participate in club or international
competition in single engagements or for more prolonged tournaments, such as the
World and European cups. On other occasions, soccer players take advantage of
altitude or seasonal differences in weather conditions to attend training camps in
other parts of the world where the climate is more favorable to strenuous exercise
(Reilly et al., 2007). Traveling is associated with negative effects such as stiffness
because of being in a cramped posture for too long, anxiety about the journey, the
change to an individual’s daily routine, and dehydration due to time spent in the
dry air of the aircraft cabin. Travel fatigue lasts for only a day or so, but for those
who fly across several time zones, there are also the longer-lasting difficulties asso-
ciated with “jet lag.” The problem of jet lag can last for over a week if a flight cros-
ses 10 time zones or more and reduce performance (Waterhouse et al., 2004). The
body clock gradually adapts to the local time of the new environment, and when
this process is complete, the symptoms of jet lag disappear (Lemmer et al., 2002).
It appears also ineffective to train hard at home prior to embarkation, because arri-
ving tired at the airport of departure may slow the adjustment later (Waterhouse
et al., 2003). The same negative effects can be experienced while attempting to shift
the phase of the body clock in the required direction for some days prior to depar-
ture, and this is counterproductive because the quality of training and subsequent
performance can be compromised by this strategy (Reilly and Maskell, 1989). Some
data have shown that eastward travel is more detrimental to performance. This is
because the body clock’s rhythm is naturally longer than the 24-hour light–dark
cycle (approximately 25–26h long), so it is easier for the body to adapt to changes
that lengthen the day rather than shorten it (Leatherwood and Dragoo, 2013).
[email protected] 06 Aug 2018
FITNESS IN SOCCER
Fatigue
208
12.3.9.1 Recommendations to decrease the effect of air travel on performance
(Leatherwood and Dragoo, 2013):
• In advance of travel, shift the body clock to the new time zone using gradual,
one-hour-a-day shifts in sleep scheduling. This recommendation contradicts
the advice of Reilly and Maskell (1989).
• Circadian phase shifting can be facilitated by proper timing of light exposure
and the use of supplemental melatonin, taken orally in doses ranging from 2
to 5mg.
• Exposure to natural daylight is preferred over exposure to artificial light.
• Expose travelers to social contact at times appropriate for the local time at the
destination.
• Avoid caffeine during travel, as this stimulant can interfere with appropriately
timed restorative sleep and alter the ability to effectively adapt to a new time
zone.
• Short (20–30 min) naps can be helpful in recovering from sleep deprivation
and restoring a normal state of arousal.
• Consume extra fluids for the duration of air travel to combat dehydration.
Avoid alcohol and caffeine, as these act as diuretics and can increase fluid
losses.
• If possible, make arrangements for dietary selections that are optimal for indi-
vidual performance. While travelling, eat smaller meals before and during
flight. Then, upon arrival, time meals to match habits appropriate to the
destination.
• If travelling outside of the country, avoid non-bottled water and raw or mini-
mally cooked foods, as well as peel fruits and vegetables that have been
washed.
[email protected] 06 Aug 2018
FITNESS IN SOCCER
Fatigue
209
12.4 EFFECTS OF FATIGUE
Performance-related symptoms
General performance
Decline
Recovery periods
Increase
Technical execution
Decline
Kicking speed
Decline
Kicking precision
Decline
Number of bad passes
Increase
Concentration
Decline
Fatigue
Increase
Test-related symptom
Muscle strength
Decline
Muscle speed strength
Decline
Coordination
Decline
Time (endurance, speed, agility, repeated sprinting capacity)
Increase
Technical execution
Decline
Technical precision
Decline
Subjective fatigue
Increase
Subjective muscle pain
Increase
Decision making
Increase or remains the same
Table 12.2: Overview of the effects of fatigue in soccer.
12.4.1 Overview of the effects on physical performance
In the preceding paragraphs, we gave an overview of the effects of fatigue during
soccer matches:
• Decreased distance in the second half
• After intense periods in the first half, players’ sprint performances were signi-
ficantly reduced (Krustrup et al., 2003)
• Peak sprinting speed was higher during the first five minutes of the first half
when compared with the second half (Bangsbo et al., 2010)
• Less high-intensity activities (Andersson et al., 2008)
• Fewer sprints
• Impaired sprint performances in the initial phase of the second half when
compared with the first half (Mohr et al., 2004)
• Longer recovery times between actions (Bangsbo et al., 2010; Bangsbo and
Mohr, 2005)
• Decreased activity after the most active periods
• Decreased passing precision (Rampinini et al., 2008)
• Mean sprint length decreased toward the end of the game (Mohr et al., 2010)
• Less distance at high intensity
• Increased risk of injuries
• Diminished maximum speed (Anderson et al., 2008)
[email protected] 06 Aug 2018
FITNESS IN SOCCER
Fatigue
210
12.4.2 Technical skills
If fatigue increases, this will not be at the expense of technique in the first instance.
This has been evidenced by Davids et al. (2003) in their “dynamic systems theory,”
meaning that a reorganization of movements will produce a technical variation in
the first phase, but the output or result will remain the same. When a ball is kicked,
for example, the movement is carried out through different joints (i.e., hip, knee,
and ankle) and muscles. A reorganization of the motion will cause the movement
to be executed differently, but the output will remain the same on account of the
body deploying other motor units. In the second phase, both the technique and the
result are diminished (i.e., “technique deterioration”). In a soccer match for exam-
ple, kicking speed and accuracy will decrease as fatigue increases (McMorris and
Rayment, 2007; Appiantono et al., 2006). This was confirmed by Russell et al. (2013)
when they demonstrated that soccer-specific exercise influenced the quality of per-
formance in gross motor skills, such as passing and shooting. Jordeta et al. (2007)
investigated the role of fatigue in taking penalty kicks and found a trend that was
in the direction of more goals with shorter playing times.
12.4.3 Biomechanical factors
In sports where speed has to be used for a relatively long period, such as sprinting,
speed diminishes (e.g., by around 7% in the 100m and almost 20% in the 400m)
(Sprague and Mann, 1983). This is caused, in particular, by decreased stride fre-
quency and increased contact time with the ground. Maximum speed also diminis-
hes quickly in swimming. For example, the length of a breaststroke decreases by
more than 15% as fatigue increases (Thompson et al., 2000).
12.4.4 Decision making
Although only a limited number of studies have looked at the relationship between
fatigue and decision making (McMorris et al., 1999; Royal et al., 2006), there is a ten-
dency for decisions to be taken more quickly when athletes are fatigued. This may
be explained by greater exercise-induced arousal (Presland et al., 2005).
12.4.5 Subjective fatigue
A great deal of research has been conducted in relation to the perception of fatigue
(Baker et al., 2007; St Clair Gibson et al., 2003; Baldwin et al., 2003; Burgess et al.,
1991). This subjective fatigue is measured based on the Borg scale or rate of per-
ceived exertion (RPE). This perceived fatigue is driven by central factors, but it is
mostly determined by peripheral fatigue, such as dehydration, lack of oxygen, rai-
sed body temperature, low glycogen reserves, and low blood sugar levels.
12.4.6 Psychological factors
Research has shown that verbal encouragement can improve performance (Gan-
devia, 2001). Athletes are able to delay their fatigue when they receive encourage-
ment. A “hostile audience” can also reduce motivation and intensity, although this
was mainly demonstrated among non-athletes (Fisher, 1976). Players will also get
more yellow cards at away games than in home matches, especially when the team
is losing. The number of yellow cards given to a team is higher toward the end of a
match. This does, of course, also have something to do with the greater risk taken
by teams toward the end of a game. The presence of competitors likewise influen-
[email protected] 06 Aug 2018
FITNESS IN SOCCER
Fatigue
211
ces the delaying of fatigue and leads to better results (Wilmore, 1968). Finally, it has
also been shown that the stress hormone, adrenaline, was higher before and after
official matches as opposed to friendly matches in tennis (Ferrauti, 2001).
Belgium first division (5 seasons)
Home
Away
Quarter
Win
Draw
Lost
Win
Draw
Lost
0-15
16-30
31-45
46-60
61-75
76-90
Over
time
513
312
321
407
429
825
191
412
593
408
516
608
79
Netherlands first division (5 seasons)
Home
Away
Quarter
Win
Draw
Lost
Win
Draw
Lost
0-15
16-30
31-45
46-60
61-75
76-90
Over
time
359
230
244
276
278
585
132
276
404
323
390
379
68
Table 12.3: Overview of yellow cards given in the Belgian and Dutch first division over 5 seasons.
12.5 COUNTERING FATIGUE
Fatigue at the end of a match can be countered. Physical activity can be handled
economically, of course, so that there is sufficient energy left at the end of the match.
However, there are also other strategies for countering fatigue.
12.5.1 Training
The relationship between a player’s fitness and the distance covered in a match
has already been discussed in detail. Although this fitness is, in part, determined
genetically, it is of course also defined by the quantity and quality of training. Mohr
et al. (2010) demonstrated a significant correlation between training status and fati-
gue development during match play. In another study of Mohr et al. (2003), the
physical performance of players during matches was examined. The researchers
showed that the number of training sessions during the week was related to the
distance covered at high intensity. Moreover they showed that that physical perfor-
mance decreased significantly if the normal training program was interrupted by a
number of matches. Well-trained athletes thus cover greater distances at different
speeds and need less time to recover between high-intensity activities.
[email protected] 06 Aug 2018
FITNESS IN SOCCER
Fatigue
212
12.5.2 Use of substitutes
A reduced work rate between playing halves could be countered by the strategic
use of substitute players. Substitutes run a considerably greater distance in the last
15 minutes than players who are involved in the entire match (Di Salvo et al., 2007).
This was confirmed by a study of Carling et al. (2010). They demonstrated that
midfield substitutes covered greater overall and high-intensity distances and had
a lower recovery time between high-intensity bouts when compared with other
midfield teammates who continued the match. Forwards covered less distance in
their first ten minutes as a substitute compared to their habitual work-rate profile in
the opening ten minutes when starting matches, but this finding was not observed
in midfielders. The authors suggest that it may be linked to an inability of these
players to “get into the game.” The strategic use of substitutes can help a team’s
physical performance.
12.5.3 Acclimation
The negative effects of competing in heat (hyperthermia) or at a high altitude
(reduction in oxygen) can be countered by acclimation strategies. The adaptati-
ons are dictated by combinations of environmental and individual characteristics
(Maeda, 2005).
- Heat
The elevated tolerance induced by the acclimatization of internal temperature is
about 0.2°C (Patterson et al., 2004), although it should be noted that some athle-
tes will never adapt to exercising or competing in heat.
- Altitude
Altitude affects athletic performance in a negative manner. The reduction in oxy-
gen partial pressure in the atmospheric air, because of altitude ascent, reduces
oxygen availability and consequently reduces performance. FIFA banned inter-
national matches above 2,500 meters in 2007 and suspended, under pressure,
the ban in May 2008. Traveling to lower altitudes does not affect performance,
but traveling to a higher altitude has negative effects. In particular, away teams
perform poorly in Quito, Ecuador (2,800 meters), and La Paz, Bolivia (3,600
meters). However, away teams do relatively well in Bogotá, Colombia (2,550
meters) (Williams, 2011). Athletes may benefit from altitude acclimation to incre-
ase their performance. The performance-enhancing effects, such as increased
red blood cell count, could increase performance back at sea level. Although the
effects of acclimation on performing at high altitude has been demonstrated in
various research, Aughey et al. (2013) concluded that neither 13 days of acclima-
tization nor lifelong residence at high altitude protects against the detrimental
effects of altitude on the match activity profile (Aughey et al., 2013). Recent rese-
arch by Buchheit et al. (2013) examined the effects on performance and physiolo-
gical responses to a 14-day off-season training in heat. The researchers postulate
that the combination of heat and hypoxic exposure during sleep/training might
offer a promising “conditioning cocktail” in team sports.
[email protected] 06 Aug 2018
FITNESS IN SOCCER
Fatigue
213
12.5.4 Tapering
In the following section, we will see how fatigue is managed in order to prepare
players for matches in an optimum way. One of these “fatigue management” stra-
tegies is tapering. Adequate tapering strategies have been shown to improve per-
formance and delay fatigue (Coutts et al., 2007). Bosquet et al. (2007) performed a
meta-analysis and suggested that the optimal strategy to maximize performance
is a tapering intervention with a two-week period where training volume is pro-
gressively decreased by 41–60% but without any modification to either training
intensity or frequency.
12.5.5 Nutrition
The use of supplements like high-CHO drinks and caffeine may delay fatigue. The
potential of low-dose caffeine ingestion (2 – 5mg/kg of body mass) to enhance end-
urance performance is well established. However, in the case of soccer, care must be
taken not to overdose because visual information processing might become impai-
red (Hespel et al., 2007). Good nutritional strategies during the week are extremely
important for replenishing the glycogen reserves in the muscle to the maximum, as
well as for providing sufficient proteins to help muscle development and minerals
to improve the functioning of the muscles. The physical requirements of soccer
training and match play draw heavily on players’ CHO stores, so the benefits of
good nutritional practices for performance and health should be an essential part
of players’ education, particularly for the parents of young players (Williams and
Serratosa, 2006).
12.5.6 Pre-cooling
The use of pre-cooling strategies prior to exercise significantly delays the occur-
rence of fatigue and improves performance (Duffield et al., 2010; Quod et al., 2008;
Castle et al., 2006). The logic for this is that pre-cooling will extend the time before
reaching the critical core temperature (Price et al., 2009). Although evidence for
the transfer of these findings to a valid soccer environment is limited, pre-cooling
may reduce physiological and perceptual loads to improve performance for soccer
training and competition in hot environmental conditions (Duffield et al., 2013).
However, these pre-cooling effects are largely lost during the first half. Direct skin
cooling with wet/cold towels (Marsh et al., 1999) or holding the hands in cold water
during the break is a cheap method for keeping the body temperature as low as
possible (Goosey-Tolfrey, 2008). Drinking ice-slushies and water can also improve
performance in very warm environments (Ross et al., 2011). Duffield et al. (2013)
investigated the effects of field-based pre-cooling strategies (ice-vests, cold towels,
and 350 mL ice-slushie drinks) for professional soccer players during training and
competition in the heat. The researchers presented equivocal findings for the effects
of pre-cooling for professional soccer players during competitive training and mat-
ches in the heat. However, performance and thermoregulatory response trends
showed the same positive similarities to previous laboratory evidence.
12.5.7 Recovery
Like every important form of training, adequate recovery is an essential part of trai-
ning. In the following chapter on fatigue-management strategies, we will discuss
recovery strategies extensively.
[email protected] 06 Aug 2018
FITNESS IN SOCCER
Fatigue
214
12.5.8 Sleep
Sleep remains one of the biggest mysteries of general daily life and sports perfor-
mance in particular. As a state that seemingly freezes all productive activity and
puts animals in danger of being caught by predators, sleep must serve an important
purpose because it has survived so many years of evolution (Sehgal and Mignot,
2011). It is common sense that a “good tiredness” (understood as being physical)
leads to a “good sleep” and, conversely, that a state of “being off form” follows “a
bad night” (Davenne, 2009). Athletes are highly sensitive to any kind of disruptive
factors that can desynchronize their circadian rhythms, such as sleep loss, jet lag
(Waterhouse et al., 2000), or irregular schedules due to training or competitions
(Davenne, 2009). It has long been proven that insufficient sleep can substantially
reduce fitness (Bougard et al., 2006; Reilly and Edwards, 2007). Information-pro-
cessing abilities will also not be as efficient. When sleeping, the brain processes the
information it receives during the day. Finally, insufficient sleep results in emoti-
onal instability. The exercises will feel more difficult, and mental toughness will
diminish. When sleeping, people mostly spend 90 minutes in the first four sleep
phases before entering the REM period. The first cycle of REM sleep lasts around
10 minutes, with the subsequent REM cycles becoming increasingly longer. The
final REM phase lasts as long as an hour. REM sleep accounts for around 20–25% of
the total time spent sleeping by an adult. Professional players are advised to have a
short (less than 30 minutes to avoid sleep inertia) and daily regular sleep period at
the beginning of the afternoon. Finally, sleep extension (getting as much extra sleep
as possible) may help minimize the effects of accumulated sleep deprivation, and
this could be a beneficial strategy for optimal performance (Dement 2005).
Tips for a good night’s sleep:
• Make sure you are distracted as little as possible by night-time noise.
• Make sure the surroundings are dark, because darkness is the evolutionary
signal for sleep. Environmental light, especially the alternation of light and
darkness due to the rotation of the earth, is one of the principal time-givers,
and it synchronizes the internal clock (Boivin et al., 1994).
• Make sure the room is not too cold or too hot. A temperature of 18°C is ideal.
• Make sure you have a good mattress, a good pillow, and sufficient space. Peo-
ple change their sleeping position around 40–60 times in a night
SUMMARY
Fatigue in soccer generally manifests itselfs as an inability to maintain physi-
cal and technical performance during competitive match play. It is not unusual
to see intensity in soccer players declining in certain periods during a game,
especially in the last 20 mins. This chapter has identified that there are various
causes of fatigue, and they are typically described as either central or periphe-
ral fatigue. Central fatigue is when the origin is proximal to the neuromuscular
junction, whereas peripheral fatigue is when the origin is distal to the neuromus-
cular junction. Central fatigue seems to be the main cause of the decrement in
strength and sprinting ability, while peripheral fatigue seems to be more related
to metabolic disturbances and increased muscle soreness. Improved physical
[email protected] 06 Aug 2018
FITNESS IN SOCCER
Fatigue
215
fitness and good nutritional practice can help to attenuate the fatigue experien-
ced during match play. It is also important that residual fatigue from match play
is dealt with as effectively as possible using specific recovery strategies. Fatigue
management and recovery strategies are now discussed in the following chapter.
REFERENCES
•
Allen, N.E., Canning, C.G., Sherrington, C. and Fung, V.S., 2009. Bradykinesia, muscle weakness and reduced muscle power in Parkin-
son’s disease. Movement Disorders, 24(9), pp.1344-1351.
•
Andersson, H., Ekblom, B. and Krustrup, P., 2008. Elite football on artificial turf versus natural grass: movement pattern, technical stan-
dards, and player impressions. J Sports Sci, 26, pp.113-122.
•
Appiantono, T., Nunome, H., Ikegami, Y. and Sano S., 2006. The effect of muscle fatigue on instep kicking kinetics and kinematics in
association football. J Sports Sci, 24, pp.951-60.
•
Ascensão, A., Rebelo, A., Oliveira, E., Marques, F., Pereira, L., and Magalhães, J., 2008. Biochemical impact of a soccer match-analysis of
oxidative stress and muscle damage markers throughout recovery. Clin Biochem, 41(10-11), pp.841-51.
•
Aughey, R.J., Hammond, K., Varley, M.C., Schmidt, W.F., Bourdon, P.C., Buchheit, M., Simpson, B., Garvican-Lewis, L.A,, Kley, M., Soria,
R., Sargent, C., Roach, G.D., Claros, J.C., Wachsmuth, N. and Gore, C.J., 2013. Soccer activity profile of altitude versus sea-level natives
during acclimatisation to 3600 m (ISA3600). Br J Sports Med; 47(1), pp.i107-i113.
•
Baker, L.B., Dougherty, K.A., Chow, M. and Kenney, W.L., 2007. Progressive dehydration causes a progressive decline in basketball skill
performance. Med Sci Sports Exerc, 39, pp.1114-23.
•
Baldwin, J., Snow, R.J., Gibala, M.J., Garnham, A., Howarth, K., and Febbraio, M.A., 2003. Glycogen availability does not affect the TCA
cycle or TAN pools during prolonged, fatiguing exercise. J Appl Physiol, 94, pp.2181-7.
•
Bangsbo, J., Norregaard, L. and Thorso, F., 1991. Activity profile of competition soccer. Can J Sports Sci, 16, pp.110-116.
•
Bangsbo, J., 1994. The physiology of soccer - with special reference to intense intermittent exercise. Acta Physiol Scand, 151, pp.1–193.
•
Bangsbo, J., Nielsen, J.J., Mohr, M., Randers, M.B., Krustrup, B.R., Brito, J., Nybo, L. and Krustrup, P., 2010. Performance enhancements
and muscular adaptations of a 16-week recreational football intervention for untrained women. Scand J Med Sci Sports, 20(Suppl 1),
pp.24–30.
•
Bergeron, M.F., 2003. Heat cramps: Fluid and electrolyte challenges during tennis in the heat. Journal of Science and Medicine in Sport,
6, pp.19-27.
•
Bosquet, L., Montpetit, J., Arvisais, D., Mujika, I., 2007. Effects of tapering on performance: a meta-analysis. Med Sci Sports Exerc, 39,
pp.1358-65.
•
Bougard, C., Moussay, S. and Davenne, D., 2006. Combined effects of time of day and sleep deprivation on two-wheeler driving perfor-
mance. Recherche Transport Sécurité, 91, pp.137-151.
•
Bradley, P.S., Di Mascio, M., Peart, D., Olsen, P. and Sheldon, B., 2010. High-intensity activity profiles of elite soccer players at different
performance levels. J Strength Cond Res, 24(9), pp.2343-2351.
•
Bradley, P.S., Sheldon, W., Wooster, B., Olsen, P., Boanas, P. and Krustrup, P., 2009. High-intensity running in English FA Premier League
soccer matches. Journal of Sports Sciences, 27(2), pp.159-168.
•
Bradley, P.S. and Noakes, T.D., 2013. Match running performance fluctuations in elite soccer: indicative of fatigue, pacing or situational
influences? J Sports Sci., 31(15), pp.1627-38.
•
Boivin, D.B., James, F.O., Wu, A., Cho-Park, P.F., Xiong, H. and Sun, Z.S., 2003. Circadian clock genes oscillate in human peripheral blood
mononuclear cells. Blood, 102(12), pp.4143–4145.
•
Buchheit, M., Racinais, S., Bilsborough, J., Hocking, J., Mendez-Villanueva, A., Bourdon, P.C., Voss, S., Livingston, S., Christian, R.,
Périard, J., Cordy, J. and Coutts, A.J., 2013. Adding heat to the live-high train-low altitude model: a practical insight from professional
football. Br J Sports Med, 47(1), pp.i59-i69.
•
Burgess, M.L., Robertson, R.J., Davis, J.M. and Norris, J.M., 1991. RPE, blood glucose, and carbohydrate oxidation during exercise: effects
of glucose feedings. Med Sci Sports Exerc, 23, pp.353-9.
•
Carling, C., Bloomfield, J., Nelsen, L. and Reilly, T., 2008. The role of motion analysis in elite soccer: contemporary performance measu-
rement techniques and work rate data. Sports Med, 38, pp.839–62.
•
Carling, C. and Bloomfield, J., 2010. The effect of an early dismissal on player work-rate in a professional soccer match. Journal of Science
and Medicine in Sport, 13, pp.126–128.
•
Cortis, C., Tessitore, A., Lupo, C., Perroni, F., Pesce, C. and Capranica, L., 2013. Changes in jump, sprint, and coordinative performances
after a senior soccer match. J Strength Cond Res, 27(11), pp.2989-96.
•
Coutts, A., Reaburn, P., Piva, T.J. and Murphy, A., 2007. Changes in selected biochemical, muscular strength, power, and endurance
measures during deliberate overreaching and tapering in rugby league players. International Journal Of Sports Medicine, 28(2),
pp.116-124.
•
Davenne, D., 2009. Sleep of athletes - problems and possible solutions. Biological Rhythm Research, 40(1), pp.45-52.
•
Davids, K., Glazier, P., Araújo, D. and Bartlett, R., 2003. Movement systems as dynamical systems: the functional role of variability and
its implications for sports medicine. Sports Med, 33(4), pp.245-60.
•
Dement, W.C., 2005. Sleep extension: getting as much extra sleep as possible. Clinics in Sports Med, 24, pp.251-268.
•
Di Salvo, V., Baron, R., Tschan, H., Calderon Montero, F.J., Bachl, N. and Pigozzi, F., 2007. Performance characteristics according to play-
ing position in elite soccer. Int J Sports Med, 28(3), pp.222-7.
•
Duffield, R., Coutts, A.J. and Quinn, J., 2009. Core temperature responses and match running performance during intermittent- sprint
exercise competition in warm conditions. Journal of Strength and Conditioning Research, 23(4), pp.1238-1244.
•
Duffield, R., Green, R., Castle, P. and Maxwell, N., 2010. Precooling can prevent the reduction of self-paced exercise intensity in the heat.
Medicine and Science in Sports and Exercise, 42(3), pp.577–584.
•
Duffield, R., Coutts, A., McCall, A. and Burgess, D., 2013. Pre-cooling for football training and competition in hot and humid conditions.
European Journal of Sport Science, 13(1), pp.58-67.
•
Edwards, A.M. and Clark, N.A., 2006. Thermoregulatory observations in soccer match play: Professional and recreational level applicati-
ons using an intestinal pill system to measure core temperature. British Journal of Sports Medicine, 40(2), pp.133–138.
•
Ekblom, B., 1986. Applied physiology of soccer. Sports Medicine, 3, pp.50–60.
•
Ekstrand, J., Gillquist, J., Möller, M., Oberg, B. and Liljedahl, S.O., 1983. Incidence of soccer injuries and their relation to training and team
success. The American journal of sports medicine, 11(2), pp.63-7.
•
Ferrauti, A., Neumann, G., Weber, K., Keul, J., 2001. Urine catecholamine concentrations and psychophysical stress in elitetennis under
practice and tournament conditions. J Sports Med Phys Fitness, 41, pp.269-74.
•
Fisher, A.C., ed., 1976. Psychology of sport: issues and insights. Mountain View, CA: Mayfield Publishing Company.
•
Gandevia, S.C., 2001. Spinal and supraspinal factors in human muscle fatigue. Physiol Rev, 81(4), pp.1725-89.
•
Goosey-Tolfrey, V., Swainson, M., Boyd, C., Atkinson, G. and Tolfrey, K., 2008. The effectiveness of hand cooling at reducing exercise-in-
duced hyperthermia and improving distance-race performance in wheelchair and able-bodied athletes. J Appl Physiol, 105, pp.37-43.
•
Hespel, P., Maughan, R.J. and Greenhaff, P.L., 2006. Dietary supplements for football. Journal of sports sciences, 24(7), pp.749-61.
[email protected] 06 Aug 2018
FITNESS IN SOCCER
216
Fatigue
•
Jordeta, G., Hartmana, E., Visschera, C. and Koen, A. P. M. Lemminka, 2007. Kicks from the penalty mark in soccer: The roles of stress,
skill, and fatigue for kick outcomes. Journal of Sports Sciences, 25(2), pp.121-129.
•
Krustrup, P., Mohr, M., Steensberg, A., Bencke, J., Kjær, M. and Bangsbo, J., 2006. Muscle and blood metabolites during a soccer game:
implications for sprint performance. Med Sci Sports Exerc, 38, pp.1165-1174.
•
Leatherwood, W.E. and Dragoo, J.L., 2013. Effect of airline travel on performance: a review of the literature. Br J Sports Me, 47, pp.561-567.
•
Maeda, T., 2005. Perspectives on environmental adaptability and physiological polymorphism in thermoregulation. J Physiol Anthrop
Appl Hum Sci, 24, pp.237-240.
•
Marsh, D. and Sleivert, G., 1999. Effect of precooling on high intensity cycling performance. Br J Sports Med, 33, pp.393-7.
•
McMorris, T., Myers, S., MacGillivary, W.W., Sexsmith, J.R., Fallowfield, J., Graydon, J. and Forster, D., 1999. Exercise, plasma
catecholamine concentrations and decision-making performance of soccer players on a soccer-specific test. J Sports Sci, 17, pp.667-76.
•
McMorris, T. and Rayment, T., 2007. Short-duration, high-intensity exercise and performance of a sports-specific skill: a preliminary
study. Percept Mot Skills, 105, pp.523-30.
•
Mohr, M., Krustrup, P. and Bangsbo, J., 2003. Match performance of high-standard soccer players with special reference to the develop-
ment of fatigue. J Sports Sci, 21, pp.519-528.
•
Mohr, M., Krustrup, P., Nybo, L., Nielsen, J.J. and Bangsbo, J., 2004. Muscle temperature and sprint performance during soccer matches
- beneficial effects of re-warm up at half-time. Scand J Med Sci Sports, 14, pp.156-162.
•
Mohr, M., Krustrup, P. and Bangsbo, J., 2005. Fatigue in soccer: A brief review. Journal of Sports Sciences, 23(6), pp.593-599.
•
Mohr, M., Mujika, I., Santisteban, J., Randers, M.B., Bischoff, R., Solano, R., Hewitt, A., Zubillaga, A., Peltola, E. and Krustrup, P., 2010.
Examination of fatigue development in elite soccer in a hot environment: a multi-experimental approach. Scand J Med Sci Sports, 20(3),
pp.125-32.
•
Morrison, S., Sleivert, G.G., Cheung, S.S., 2004. Passive hyperthermia reduces voluntary activation and isometric force production. Eur
J Appl Physiol, 91, pp.729-736.
•
Mustafa, K.Y. and Mahmoud, N.E., 1979. Evaporative water loss in African soccer players. J Sports Med Phys Fitness, 19, pp.181–3.
•
Noakes, T.D., 2006. Exercise in the heat: old ideas, new dogmas. Int Sport Med J, 7, pp.58-74.
•
Patterson, M.J., Stocks, J.M. and Taylor, N.A., 2004. Sustained and generalised extracellular fluid expansion following heat acclimation.
J Physiol, 559, pp.327-334.
•
Presland, J.D., Dowson, M.N. and Cairns, S.P., 2005. Changes of motor drive, cortical arousal and perceived exertion following prolonged
cycling to exhaustion. Eur J Appl Physiol, 95, pp.42-51.
•
Price, M.J., Boyd, C. and Goosey-Tolfrey, V.L., 2009. The physiological effects of pre-event and midevent cooling during intermittent run-
ning in the heat in elite female soccer players. Applied Physiology, Nutrition and Metabolism, 34(5), pp. 942-949.
•
Quod, M.J., Martin, D.T., Laursen, P.B., Gardner, A.S., Halson, S.L., Marino, F.E., Tate, M.P., Mainwaring, D.E., Gore, C.J., Hahn, A.G.,
2008. Practical precooling: Effect on cycling time trial performance in warm conditions. Journal of Sports Sciences, 26(14), pp.1477–1487.
•
Rahnama, N., Lees, A. and Reilly, T., 2006. Electromyography of selected lower-limb muscles fatigued by exercise at the intensity of soc-
cer-match play. J Electromyogr Kinesiol, 16, pp.257-263.
•
Rahnama, N., Reilly, T. and Lees, A., 2002. Injury risk of playing actions during competitive soccer. Br J Sports Med, 36, pp.354-359.
•
Rahnama, N., Reilly, T., Lees, A. and Graham-Smith, P., 2003. Muscle fatigue induced by exercise simu- lating the work rate of competi-
tive soccer. Journal of Sports Sciences, 21(11), pp.933-942.
•
Rampinini, E., Coutts, A.J., Castagna, C., Sassi, R. and Impellizzeri, F.M., 2007. Variation in top level soccer match performance. Int J
Sports Mede, 28, pp.1018-24.
•
Rampinini, E., Impellizzeri, F.M., Castagna, C., Azzalin, A., Ferrari Bravo, D. and Wisløff, U., 2008. Effect of match-related fatigue on
short-passing ability in young soccer players. Med Sci Sports Exerc, 40(5), pp.934-42.
•
Rampinini, E., Bosio, A., Ferraresi, I., Petruolo, A., Morelli, A. and Sassi, A., 2011. Match-related fatigue in soccer players. Medicine and
Science in Sports and Exercise, 43(11), pp.2161¬–70.
•
Reilly, T. and Maskell, P., 1989. Effects of altering the sleep—wake cycle in human circadian rhythms and motor performance. In: Procee-
dings of the Proceedings of the First IOC World Congress on Sport Science. Colorado Springs. p.106.
•
Reilly, T., 2003. Motion analysis and physiological demands. In: T. Reilly and A.M. Williams, eds. 2003. Sci- ence and soccer. London:
Routledge. pp. 59-72.
•
Reilly, T. and Rigby, M., 2002. Effect of an active warm-down following competitive soccer. In: W. Spinks, T. Reillya and A. Murphy A,
eds. 2002. Science and Football IV. London:Routledge. pp. 226–229.
•
Reilly, T., Atkinson, G. and Waterhouse, J., 1997. Travel Fatigue and Jet Lag. Journal of Sport Sciences, 15, pp.365–369.
•
Reilly, T., Waterhouse, J. and Edwards, B., 2005. Jet lag and air travel: implications for performance. Clin Sports Med, 24(2), pp.367–80.
•
Reilly, T. and Edwards, B., 2007. Altered sleep-wake cycles and physical performance in athletes. Physiol Behav, 90, pp.274-284.
•
Reilly, T. and Maskell, P., 1989. Effects of altering the sleep-wake cycle in human circadian rhythms and motor performance. In: Proce-
dings of the First IOC World Congress on Sports Science, p.106. Colorado Springs: US Olympic Committee.
•
Reilly, T., Drust, B. and Clarke, N., 2008. Muscle fatigue during football match-play. Sports Med, 38, pp.357-67.
•
Ross, M.L.R., Garvican, L.A., Jeacocke, N.A., Laursen, P.B., Abbiss, C.R., Martin, D.T. and Burke, L.M., 2011. Novel Precooling Strategy
Enhances Time Trial Cycling in the Heat. Medicine And Science In Sports And Exercise, 43(1), pp.123-133.
•
Royal, K.A., Farrow, D., Mujika, I., Halson, S.L., Pyne, D. and Abernethy, B., 2006. The effects of fatigue on decision making and shooting
skill performance in water polo players. J Sports Sci, 24, pp.807-15.
•
Russell, M., Rees, G. and Kingsley, M. 2013. Technical demands of soccer matchplay in the English Championship. Journal of Strength
and Conditioning Research, (Epub ahead of print).
•
St Clair Gibson, A., Baden, D.A., Lambert, M.I., Lambert, E.V., Harley, Y.X., Hampson, D., Russell, V.A. and Noakes, T.D., 2003. The cons-
cious perception of the sensation of fatigue. Sports Med, 33, pp.167–176.
•
Saltin, B., 1973. Metabolic fundamentals in exercise. Med Sci Sports, 5, pp.137-46.
•
Sehgal, A. and Mignot, E., 2011. Genetics of Sleep and Sleep Disorders. Cell, 146(2), pp.194-207.
•
Sprague, P. and Mann, R.V., 1983. The effects of muscular fatigue on the kinetics of sprint running. Res Q Exerc Sport, 54, pp.60-6.
•
Stickgold, R. and Walker, M.P., 2007. Sleep-dependent memory consolidation and reconsolidation. Sleep Med, 8, pp.331-343.
•
Stofan, J.R., Zachwieja, J.J., Horswill, C.A., Lacambra, M., Murray, R. and Eichner, E. R., 2003. Sweat and sodium losses in NCAA Division
1 football players with a history of whole-body muscle cramping. Medicine and Science in Sports and Exercise, 35, S48.
•
Strudwick, T. and Reilly, T., 2001. Work-rate profiles of elite premier league football players. Insight FA Coach Assoc J, 42(2), 28-29.
•
Thompson, K.G., Haljand, R. and MacLaren, D.P., 2000. An analysis of selected kinematic variables in national and elite male and female
100-m and 200-m breaststroke swimmers. J Sports Sci, 18, pp.421-31.
•
Van Gool, D., Van Gerven, D. and Boutmans, J., 1988. The physiological load imposed on players during real match-play. In: T. Reilly, A.
Lees, K. Davids et al., eds. 1988. Science and football (pp. 51-59). London: E and FN Spon.
•
Vigne, G., Gaudino, C., Rogowski, I., Alloatti, G. and Hautier C., 2010. Activity Profile in Elite Italian Soccer Team. Int J Sports Med,
31(5), pp.304-310.
•
Waterhouse, J., Nevill, A., Edwards, B., Godfrey, R., Reilly, T., 2003. The relationship between assessments of jet lag and some of its symp-
toms. Chronobiol Int, 20(6), pp.1061–73.
•
Waterhouse, J., Reilly, T. and Edwards, B., 2004. The stress of travel. J Sports Sci., 22(10), pp.946-65; discussion 965-6.
•
Waterhouse, J., Reilly, T., Atkinson, G. and Edwards, B., 2007. Jet lag: trends and coping strategies. Lancet, 369(9567), pp.1117–29.
•
Waterhouse, J., Atkinson, G., Edwards, B. and Reilly, T., 2007. The role of a short post-lunch nap in improving cognitive, motor, and sprint
performance in participants with partial sleep deprivation. J Sports Sci, 25(14), pp.1557–2166.
•
Weitzman, E.D., 1976. Circadian rhythms and episodic hormone secretion in man. Ann Rev Med, 27, pp.225-243.
•
Williams, T., 2011. The Effects of Altitude on Soccer Match Outcomes. MIT Sloan Sports Analytics Conference.
•
Williams, C. and Serratosa, L., 2006. Nutrition on match day. Journal of Sports Sciences, 24(7), pp.687-697.
•
Wilmore, J.H., 1968. Influence of motivation on physical work capacity and performance. J Appl Physiol, 24, pp.459-63.
[email protected] 06 Aug 2018
FITNESS IN SOCCER
Fatigue management
217
13
FATIGUE MANAGEMENT
Jan Van Winckel, Werner Helsen, Kenny McMillan, John Fitzpatrick,
Ester Lowette, Kyle Woodruff, Paul Bradley, David Tenney
13.1 INTRODUCTION
In the preceding chapter, we conside-
red the causes and effects of fatigue.
We also discussed the various ways
of countering fatigue. In this chapter,
we will discuss the concept of “fatigue
management,” which involves monito-
ring, manipulating, and adjusting fati-
gue. Professional players are expected
to compete in 60–70 high-level mat-
ches per year. Therefore, it is virtually
impossible to peak by means of clas-
sic peaking strategies, as there will be
a loss of consistent performance in the
preceding and ensuing weeks. It is up
to the coaching staff to keep the team
at a maximal stable level for an entire
season. This process is referred to as
performance stabilization.
[email protected] 06 Aug 2018
FITNESS IN SOCCER
Fatigue management
218
13.2 PERFORMANCE STABILIZATION
At the very top level, performance stabilization can be considered at least as impor-
tant as performance enhancement. It is a challenge for every soccer coach to keep
the players at an appropriate level (around 85% of peak physical capacity) for the
entire season, although periods with higher performance levels can be strategically
planned during the season.
Fig. 13.1: Example of a buildup in an individual sport (e.g., marathon or cycle racing) as opposed to
performance level in soccer.
To maintain this constant high level, a clear strategy has to be developed to manage
and manipulate a player’s fatigue. We refer to this as fatigue management.
Fig. 13.2: Representation of the fatigue management strategies in a microcycle
[email protected] 06 Aug 2018
FITNESS IN SOCCER
Fatigue management
219
13.3 FATIGUE MANAGEMENT
As we already mentioned in the preceding chapters, performance preparedness
results from the interplay between the body’s long-term fitness increase, which
is stimulated by training, and the opposing short-term aftereffects of fatigue, also
caused by training (Siff and Verkhoshansky, 1999). Specifically, it reflects the readi-
ness of an athlete to participate in an enhanced level of training and/or excel in
competition (Zatsiorsky, 1995). Fatigue is the degree to which training or match-in-
duced stress masks the capacity to display fitness. The higher the accumulated fati-
gue levels, the greater the inability to utilize the increased fitness levels. This does
not imply that fitness levels have decreased but rather that they are simply masked
by match- or training-induced fatigue. This also implies that, within physiologi-
cally acceptable levels, the greater the increase in accumulated fatigue induced by
training stress, the greater the potential to increase fitness levels once the player
has the opportunity to recover from the stress and fatigue imposed by training or
matches. Fatigue levels should accumulate at various times of a training program
to create overload and elicit adaptation. Training is nothing more than systemati-
cally disrupting homeostasis and permitting higher levels of performance to occur.
Fatigue need to be managed at two levels:
1. Within a mesocycle:
• Within a mesocycle, a certain specific load is imposed in each microcycle
in order to generate specific fatigue, causing the body to make a specific
adaptation.
• Within each mesocycle, an unloading period (a lowering of volume and/or
intensity) is applied to allow fatigue to decline and let supercompensation
take place. The term “regeneration” is used at times to refer to periods of
extended recovery within a long-term training plan (Hackney, 1999).
2. Within a microcycle:
• Recovery strategies to reduce the fatigue induced by matches as fast as
possible.
• Loading strategies in order to create specific acute fatigue to elicit adaptation.
• Tapering strategies to allow fatigue to decline and consequently increase pre-
paredness for an upcoming match.
Fig. 13.3: Fatigue management within a microcycle composed of three phases
[email protected] 06 Aug 2018
FITNESS IN SOCCER
Fatigue management
220
1. Phase 1: Recovery strategies
The objective in this phase is to eliminate fatigue induced by the game as rapidly
and as thoroughly as possible. The training load is reduced, and recovery strate-
gies are applied. Preparedness will decrease due to excessive fatigue, but fitness
levels remain high due to the match load.
2. Phase 2: Loading strategies
In the second phase of fatigue management, the training load is high in order to
create accumulated fatigue and overload. In this phase, the load is adapted to
the physical periodization. Preparedness declines due to accumulated fatigue,
whereas specific fitness increases.
3. Phase 3: Tapering strategies
In this phase of the microcycle, the main objective is to enhance the players’ pre-
paredness as much as possible. This is done by lowering the training load via
reducing the volume while keeping the intensity sufficiently high (80%).
13.4 RECOVERY STRATEGIES
Fatigue occurs in various forms, namely physiological, psychological, neural and
hormonal. A good recovery strategy has to tackle these different forms of fatigue.
Moreover, Gould and Dieffenbach (2002) demonstrated that failure to adequately
recover from the stress of training induces a state of overtraining and burnout.
The term under-recovery is often used in this regard. Under-recovery predisposes
players to overtraining injuries during a congested fixture period where players
are required to compete repeatedly within a short period (e.g., two games a week)
(Dupont et al., 2010). Professional soccer players are exposed to demanding com-
petition schedules and can be easily exposed to 70 games in a single competitive
season (King and Duffield, 2009). Playing competitive soccer involves eccentric
work, particularly during competition, resulting in varying levels of exercise-indu-
ced muscle damage (EIMD). This EIMD is characterized by delayed-onset muscle
soreness (DOMS) (Impellizzeri et al., 2008), decreased muscle function (Jakeman et
al., 2009), impaired performance (Reilly and Ekblom, 2005), and increased percei-
ved fatigue (Twist and Eston, 2009). Many biochemical and tissue repair processes
take place after a match, and the body needs rest to recover completely for the next
game or training session. Although the recovery process is initiated automatically,
it can be assisted by appropriate recovery strategies. The capacity to recover from
training and competition is therefore an important determinant in soccer perfor-
mance (Kellmann, 2002; Odetoyinbo et al., 2009).
Athletes attempt to recover from training and competition as quickly as possible,
so their performances in the subsequent training session or game are not compro-
mised by muscle soreness or reductions in physical abilities. According to Peter-
son (2005), “The concept of effective, regular, and varied recovery activities has
become part of the language of today’s smart, professional athlete.” Recovery
can be defined as an inter- and intra-individual multidisciplinary (physiological
and psychological) process to restore the initial performance level. This definition
implies that recovery is much more than just rest - it is a strategy that should be
adapted according to the type, intensity and volume of the previous training cycle
(Steinacker and Lehmann, 2002).
[email protected] 06 Aug 2018
FITNESS IN SOCCER
Fatigue management
221
Recovery can be defined on different levels:
1. Within a training session or match: The amount of time between exercises (trai-
ning session) or high-intensity efforts (match)
2. Within the microcycle: the amount of time between sessions on a daily basis
3. Within the mesocycle: the amount of time between longer cycles or periods of
training
4. Within the year planning: the amount of time during the off-season and mid-sea-
son breaks.
13.4.1 Recovery between high-intensity efforts
Krustrup et al. (2006) and Mohr et al. (2010) demonstrated that the ability to per-
form repeated bouts of high intensity, an important physical ability in soccer, is
reduced toward the end of soccer games. Some research has demonstrated a posi-
tive effect of active recovery on performance in repeated sprints and on the speed
of lactate removal (Bogdanis et al., 1996). This contradicts recent research that pos-
tulates that active recovery adversely affects performance, decreases the speed
of replenishment of phosphocreatine, and increases fatigue (Dupont et al., 2003;
Dupont et al., 2004; Spencer et al., 2006; Jougla et al., 2010). On the other hand, pas-
sive recovery induces a faster re-oxygenation of myoglobin (Dupont et al., 2004).
In conclusion, it seems better to recover passively between intensive bouts during
a match, but the recommendation that players should walk or stand still during
and following bouts of repeated sprinting needs to be coordinated with tactical
windows of opportunity.
13.4.2 Recovery post-match
Several studies have demonstrated that it takes more than 72 hours to reach pre-
match values for physical performance and normalize muscle damage and inflam-
mation (Andersson et al., 2008).
The magnitude of match-induced fatigue, extrinsic factors (e.g., match result, qua-
lity of the opponent, match location, playing surface, environmental conditions)
and/or intrinsic factors (e.g., training status, age, sex, muscle fiber typology), could
influence the time course of recovery (Nédélec et al. 2012).
Several post-match recovery interventions have been suggested to enhance per-
formance (Barnett, 2006). These recovery strategies are broadly classified into two
categories (Bompa, 1999): active and passive recovery. Active recovery strategies
include cycling, jogging, aqua-jogging, and deep-water running, followed by stret-
ching exercises. These interventions are regularly used after training sessions and
matches in professional soccer (Dabedo et al., 2004). In particular, when matches
are played on a weekly or twice-weekly basis, focus is placed on accelerating the
recovery and consequently the regeneration processes. This commences immedia-
tely after the match by using nutritional strategies to replenish glycogen stores and
drinking water or carbohydrate beverages to restore fluid balance. With the next
competitive match 3–7 days away, a recovery training session is often planned the
next day as well. It is still unclear whether immediate post-match recovery offers
additional benefits when compared to a traditional next-day recovery. A cool down
after a tough training session often feels good, and the psychological relief of some
[email protected] 06 Aug 2018
FITNESS IN SOCCER
Fatigue management
222
easy jogging, stretching and discussing the session with teammates can work won-
ders for the mental well-being of players. However, a cool down after a game or
during bad weather conditions is often impractical and can put additional psycho-
logical and physiological stress on the players. Is it really necessary to start active
recovery sessions immediately after the game, or can this wait until the next day?
Dawson and colleagues (2005) investigated four types of immediate post-match
recoveries:
1. Control (i.e., no proactive recovery): The players were instructed to perform no
recovery procedures other than eating (fruit), drinking (water and soft drinks),
and showering.
2. Stretching: The players were led through 15 minutes of gentle static stretching
of the legs and back, involving two or three reps of 30s-held stretches across
several muscle groups and joints.
3. Pool walking: The players were taken through 15 minutes of easy walking
(moving forwards, backwards and sideways) in the shallow end of a 28°C
swimming pool.
4. Hot/Cold cycling: The players alternated between standing in a hot (~ 45°C)
shower for two minutes and standing waist deep in icy water (~12°C) for one
minute, repeated until five hot and four cold exposures had been completed.
Additional ice was added to the cold water as required to maintain a constant
temperature.
The authors concluded that performing any form of immediate post-match reco-
very did not significantly enhance the recovery of muscle soreness, flexibility and
power within the first 48 hours following a game when compared to just perfor-
ming a “next-day” recovery training session.
[email protected] 06 Aug 2018
FITNESS IN SOCCER
Fatigue management
223
13.4.3 Types of recovery
13.4.3.1 Allowing sufficient recovery time
Soccer governing bodies such as FIFA and UEFA should consider the physiological
and mental consequences for players in periods of congested fixtures and lighten
the physiological strain as much as possible by mandating a minimum of 72 hours
between competitive matches (Reilly, 2005; Ispirlidis, 2008). A soccer match increa-
ses the levels of oxidative stress and muscle damage throughout a 72-hour period
(Andersson, 2010; Ascensao, 2008; Ispirlidis, 2008). The recovery time between two
matches in a week seems sufficient to maintain levels of physical performance, but
it is not long enough to maintain a low injury rate. Adequate recovery strategies
are necessary to maintain a low injury rate among soccer players during periods of
congested match fixtures (Dupont, 2010).
13.4.3.2 Active recovery
Active recovery (Baldari et al., 2004; Tessitore et al., 2007):
• reduces muscle soreness (Reilly, 1998)
• increases muscle-damage recovery (Gill et al., 2006)
• prevents venous pooling in the muscles after maximal effort (This can cause
dizziness and sometimes fainting. When an athlete or player faints or collap-
ses after maximal efforts (or when crossing the finish line), the most common
cause is stopping so suddenly that the blood pools in the extremities (usually
the legs), depriving the brain of oxygen for a moment. Typically, this is refer-
red to as postural hypotension (Crisafulli et al., 2006).)
• restores metabolic perturbations (Bangsbo et al., 1994; Bogdanis et al., 1996)
• increases lactate clearance. (Maximum clearance occurred at active recovery
close to the lactate threshold (Menzies et al., 2010). However, for team sports
like soccer, lactate removal is not a determining factor, as matches are gene-
rally 3–9 days apart.)
✓ Running activities
Reilly and Rigby (2002) investigated the effect of post-match active recovery in soc-
cer and reported that muscle soreness disappeared two days after the match in the
active post-match recovery group. They found that amateur soccer players who
did an immediate post-match recovery comprised of some jogging, stretching and
a leg-muscle “shakedown” (by a partner) for 12 minutes had lower muscle soreness
ratings and were closer to their pre-match jump and sprint performances both 24
and 48 hours after the match when compared to a group of players who did not
perform any recovery. In another interesting study by Rey et al. (2012), the effect of
immediate post-training active- and passive-recovery interventions on anaerobic
performance and lower-limb flexibility in professional soccer players was investi-
gated. The active recovery consisted of 20 minutes of low-intensity exercises, inclu-
ding 12 minutes of submaximal running at 65% of maximum aerobic speed and
8 minutes of static stretching, involving 3 bilateral repeats of 30s-held stretches to
the hamstring, quadriceps, gastrocnemius, and adductor muscles. The investiga-
tors suggest that post-training active-recovery intervention may help in restoring
counter movement jump performance, but this does not represent performance
[email protected] 06 Aug 2018
FITNESS IN SOCCER
Fatigue management
224
enhancements in the 20m sprint, Balsom agility test, and lower-limb flexibility for
professional soccer players.
Running activities followed by static stretching could reduce delayed onset muscle
soreness. However, the research is inconclusive about the effects of low-intensity
running exercises on recovery.
✓ Pool sessions
Exercising in water has been suggested by some researchers (Dowzer and Reilly,
1998; Oda et al., 1999; Suzuki et al., 2004). The advantages of running in water
(aquajogging or deep-water running) over normal running are numerous:
• It avoids excessive eccentric actions, especially in deep water.
• It naturally massages the muscles (via the water turbulence).
• It reduces mechanical load on the joints.
• It aids recovery from musculoskeletal fatigue.
• It increases the physiological and psychological indices of relaxation.
✓ Stretching
Few publications have investigated the effect of stretching on recovery. Many coa-
ches still believe that stretching post-exercise will increase blood flow. Research
demonstrates clearly that stretching after a workout does not help and may in fact
discourage blood flow (Poole et al. 1997, Mika et al. 2007).
Montgomery et al. (2008) postulated that static stretching after exercise could be
recommended as a recovery strategy in order to prevent delayed onset muscle sore-
ness and improve range of motion. Contradicted findings were published by Wessel
and Wan (1994) who found that stretching before or after exercise did not improve
DOMS. Coaches should be careful in applying stretching after intensive training or
match play. This causes exercise-induced muscle damage, and post-exercise stret-
ching can potentially cause further trauma. In conclusion, serious stretching after
an intensive training or game is contraindicated for recovery.
13.4.3.3 Passive recovery
✓ Cold-water immersion (CWI)
These are the possible mechanisms of post-exercise cooling:
• It reduces pain and swelling, having an anti-inflammatory effect and reducing
the potential for DOMS.
• It causes vaso-constriction, which increases blood flow and metabolic trans-
portation post-exercise. Additionally, CWI may decrease nerve transmission
speed (Wilcock, 2006) and alter the receptor threshold, leading to decreased
pain perception. There may also be a psychological mechanism whereby the
body feels more “awake” and perceives a reduced sensation of fatigue after
exercise (Cochrane, 2004).
In conclusion, a cold-water bath after a match will not cause any harm, and it may
likely boost recovery and constitute a good recovery strategy for those with a “mar-
ginal gains” philosophy. Poppendieck et al. (2013) concluded in their meta-ana-
[email protected] 06 Aug 2018
FITNESS IN SOCCER
Fatigue management
225
lysis that the expected percentage improvements in performance recovery from
post-exercise cooling are large enough to be relevant for competitive athletes. In
particular, for whole-body CWI, cooling-induced improvements of 5% or more can
be expected. These results are similar to those of Leeder et al. (2011) and Bleakley
et al. (2012), who identified positive effects of cooling on the reduction of muscle
soreness, although they found only small or unclear effects on performance indices.
Halson (2011) postulated that no gold standard exists for CWI as regards water
temperature, immersion depth, and duration. Based on the available literature, the
recommendation is for a whole-body immersion lasting 10–20 minutes in a water
temperature of 10–15°C (Halson, 2011).
✓ Compression garments
Compression garments (CGs), such as compression socks, were originally used
in clinical settings. While the benefits of CGs include being relatively cheap, easy
to use, and non-invasive, the current literature indicates that wearing these gar-
ments has limited physiological or performance effects, although reports of detri-
mental effects are rare (Macrae, 2011). Various research has suggested that CGs
increase the removal of cellular debris, moderate the formation of edema associ-
ated with EIMD, attenuate muscle oscillation, change sub-maximal oxygen usage
during exercise, alleviate swelling, and reduce perceived muscle soreness during
post-exercise recovery. They have also been suggested to offer mechanical support
(dynamic casting effect) to the muscle, allowing faster recovery following dama-
ging exercise (Kraemer et al., 2001). Recent research pointed out that a whole-body
compression garment worn during the 24-hour recovery period following an
intense heavy-resistance training workout enhances various psychological, physio-
logical, and performance markers of recovery, when compared with non-compres-
sive control garment conditions. The use of compression appears to help in the
recovery process after an intense heavy-resistance training workout in men and
women (Kraemer et al., 2010). This was confirmed by Jakeman et al. (2010) when
they concluded that compression clothing is an effective recovery strategy follo-
wing EIMD. A recent review by MacRae et al. (2011) concluded that the temptation
to take findings from one cohort (e.g., untrained people) or exercise type (e.g., jum-
ping) and apply them to other cohorts and exercise types (e.g., untrained people
and prolonged running) is questionable. The garment type, the applied pressure,
and the duration of wear often differ, complicating the matter further. Hence, more
research is required before practical recommendations can be made.
In conclusion, wearing CGs might support recovery and reduce DOMS, and no
detrimental effects have been reported. Players could be encouraged to use com-
pression socks during recovery or taper, particularly when travelling by car or
plane.
✓ Sleep
The effect of sleep on athletic performance has become a topic of great interest
because of the growing body of scientific evidence demonstrating a direct rela-
tionship between critical sleep factors (sleep length, sleep quality, and circadian
sleep phase) and human performance (Samuels, 2008). Research speculates that
sleep supports improvements in sport performance, because during phases of deep
sleep, growth hormone is released. Growth hormone stimulates muscle growth
[email protected] 06 Aug 2018
FITNESS IN SOCCER
Fatigue management
226
and repair, promotes bone building, and helps athletes recover. On the other hand,
a lack of sleep has been associated with under-recovery, alterations in mood and
motivation, and a negative effect on athletic performance.
Sleep deprivation:
• reduces the ability to store glycogen
• reduces decision-making quality and reflexes
• increases stress hormones (cortisol)
• negatively affects recovery. (Skein et al. (2013) examined the effects of over-
night sleep deprivation on recovery following competitive rugby league
matches. They found that sleep deprivation negatively affects recovery,
specifically impairing CMJ distance and cognitive function.)
• lowers levels of growth hormone needed to help repair the body
For optimal performance, players should be encouraged to maximize their sleep in
a dark, calm, relaxing and fresh atmosphere during the week preceding competition
(Halson, 2008). This was confirmed by Mah et al. (2011) who investigated measures
of basketball performance after sleep extension. Participants were first asked to
follow their habitual sleep period (e.g., an eight-hour sleep period). They were then
subsequently asked to voluntarily extend their total sleep time, with a minimum
goal of a ten-hour sleep period for a five-to-seven-week period. The participants
were found by all the measures to have enhanced basketball performance after the
habitual sleep extension. Total sleep times increased by approximately two hours,
and participants were shown to sprint faster and have greater shooting accuracy
when compared to their baseline performance. Alertness also improved—as did
mood, weariness, and fatigue—leading the investigators to conclude that optimi-
zing sleep need (i.e., reaching sleep satiation) was likely to have a positive impact
on measured athletic performance. Although there is an individual variation in
the amount of sleep required for essential recovery processes, the adaptive sleep
range is approximately 8–10 hours (Bompa, 2009; Calder, 2003). Athletes should be
encouraged to take a 20-minute nap (often called a “power nap”) during the day
(Postolache and Oren, 2005). Naps should be scheduled in the mid-to-late after-
noon after 2pm but not after 4pm, because this can result in sleep inertia (Samuels,
2008). Naps can equate to an hour of “extra” nighttime sleep (Horne, 2011).
Recommendations for females aged 18+ and males aged 19+ (Samuels, 2008):
• Ensure a comfortable sleep environment when travelling and competing.
• Monitor for competition stress and anxiety insomnia.
• Observe sleep to identify sleep disorders.
• Maintain a regular sleeping and napping routine.
• Monitor for a delayed sleep phase, such as difficulty falling asleep and waking
up for school.
• Get early-morning light exposure for 30 minutes daily.
• Maintain reliable nutrition routines. Breakfast is the most important meal of
the day.
• Focus on reducing sleep debt. Get 56–70 hours of sleep per week.
• Do not train if unrested and sleep deprived.
• Avoid technology (e.g., PCs, smartphones, tablets) before bed.
[email protected] 06 Aug 2018
FITNESS IN SOCCER
Fatigue management
227
✓ Psychological strategies
Performance in soccer is a result of a complex synergistic interaction of technical,
tactical, physiological, psychological, environmental, and social factors. In this
regard, the athlete has been described as a “psychosocio-physiological entity”
(Kenttä and Hassmén, 2002). Soccer players currently face more social pressure
than ever before, and they are exposed to increased media demands, sponsor-
ship requirements, and information overload (Botterill and Wilson, 2002). Mental
recovery is a vital part of the recovery process (Maughan, 1998). Mental-recovery
strategies may include debriefing, emotional recovery, mental toughness skills,
and relaxation techniques. A successful debriefing enables both the coach and the
player to evaluate game performance and identify specific areas in need of change.
Moreover, goals can be reframed, with realistic goals being set for the next training
session or match. Venter (2012) investigated the perceptions of team athletes on the
importance of recovery modalities. The results from this study demonstrated that
team players do perceive psychosocial aspects to be among the most important
recovery modalities. Sport psychologists could assist coaches with effective debrie-
fing procedures after matches to aid mental and emotional recovery, as well as
facilitating team cohesion to address aspects of psychosocial recovery. There may
be a need to educate players and coaches in regard to recovery modalities, and this
might also assist with psychosocial recovery.
Effective strategies:
• Organize a debriefing after each game.
• Set realistic goals.
• Social networks can help players deal with the problems, disappointments,
joys and stresses of life (Quinn and Fallon, 1999).
• Appoint players carefully for media demands and sponsor needs.
• Reframe goals if long-term goals look difficult to reach.
• Give players space to develop effective pre- and post-match strategies.
• Social support may increase performance (Freeman and Rees, 2008).
• Try to protect players from the negative impact of stressors (Botterill and
Wilson, 2002; Rees and Hardy, 2004).
• Encourage players to create a playlist of music they enjoy that generates a
range of moods and atmospheres so as to produce a stimulating or calming
effect (Calder, 2000).
• Do not force players into post-match recovery strategies that are perceived
as stressful.
• Encourage friends and teammates to provide listening and emotional sup-
port; challenge evaluation of attitudes, values and feelings; express appre-
ciation; and motivate other players to greater excitement and involvement
(Barefield and McCallister, 1997).
It can be concluded that relaxation strategies—such as meditation, music, muscle
relaxation, visualization, breathing exercises, music, and floatation—are regularly
used, yet the effects of these strategies have been barely investigated.
[email protected] 06 Aug 2018
FITNESS IN SOCCER
Fatigue management
228
✓ Nutrition and hydration (See chapter 4)
Alcohol consumption occurs regularly in many team sports, typically as part of a
post-match celebration or as an escape from the realization of failure (Maughan,
2006). This behavior is widespread and often seen as an acceptable part of team
culture (Barnes et al., 2012). O’Brien et al. (2005) studied a student population and
found higher rates of hazardous drinking in elite sportspeople (O’Brien et al., 2005).
On the other hand, it has been reported that sports participation might delay drin-
king debut in youngsters (Hellandsjo Bu et al., 2002). Barnes et al. (2010) concluded
that alcohol magnifies the severity of skeletal muscle injury and therefore delays
recovery of strength over the following 24-hour period, suggesting that partici-
pants of sports involving intense eccentric muscular work should be encouraged
to avoid alcohol intake in the post-event period when optimal recovery is required.
This was confirmed a few years later by the same research group after 80 minutes
of a simulated rugby game. The consumption of 1g of alcohol per kilogram of body
mass had a negative impact on lower-body vertical power output.
✓ Massage
There is limited scientific evidence showing that massage might assist in recovery
strategies (Monedero and Donne, 2000). Recent research by Jakeman et al. (2010)
reported that a combined treatment of a 30-minute manual massage and a 12-hour
lower-limb compression significantly decreased perceived soreness at 48 and 72
hours after plyometric exercise when compared to passive recovery or compression
alone. This was confirmed by Hilbert et al. (2003) when they reported moderated
muscle-soreness ratings 48 hours after exercise when a massage was administered
2 hours after eccentric exercise. Massage should be carefully administered after
intensive training or match play, since massage can possibly counter the natural
recovery process of the body. Some researchers even suggest that a massage should
not be applied after training or a match because post-exercise massage could cause
further trauma when training or match play has caused EIMD (Barnett, 2006).
Moreover, it seems that the training level of the therapist affects the effectiveness of
massage (Moraska, 2007).
✓ Cortisol and the autonomic nervous system
Cortisol, or hydrocortisone, is a steroid hormone produced by the adrenal glands in
response to a stressor. A stressor is any potential source that places a physical, men-
tal, or emotional strain on the body or mind during a demanding circumstance.
When faced with a stressor, the brain triggers a cascade of hormones that ultima-
tely leads to the release of cortisol (sympathetic nervous system). This hormone is
responsible for physically preparing the body to deal with whatever situation has
been encountered. This physiological reaction is often referred to as the “fight-or-
flight” response. This term applied in a much more literal sense during prehistoric
times. An encounter with a rival looking for a fight or a hungry predator looking for
a meal demanded the physical preparation necessary to endure the conflict or run
from the danger. Since the evolution of civilization, however, the need to fight or
run for survival is a rare occurrence. Typical stressors today include school exams,
deadlines at work, and troubles with relationships. Although humanity’s social
behaviors have rapidly evolved, the reaction to stress remains the same. Physiolo-
gical changes induced by the stress response still include a temporary elevation of
[email protected] 06 Aug 2018
FITNESS IN SOCCER
Fatigue management
229
heart rate and an increase in fuel supply to the muscles. At times, this reaction to a
stressful situation can be less than ideal. For instance, consider standing in front of
a crowd to give a speech with a pounding heart and sweaty palms. For a stressor
such as exercise, though, these physical changes are optimal for physical exertion.
Cortisol plays a necessary role in performance during exercise. The increase in heart
rate and the fuel supply to working muscles provides the necessary adaptations to
perform at a high level. After exercise has ended, however, a sufficient period for
recovery is necessary to return to baseline hormonal levels. Adequate time allows
the clearance of elevated levels of circulating cortisol, while insufficient time leads
to chronically elevated levels. If cortisol levels remain elevated for a prolonged
period, a number of adverse side effects will occur. These include slower recovery
rates, immune system suppression, gastrointestinal problems, lower testosterone
levels, weight gain, cardiovascular disease, insomnia, fatigue, psychological stress,
depression, increased blood pressure, reduced serotonin levels, memory disorders,
decreased bone formation, blood sugar imbalance, fertility problems, and more.
While these side effects are numerous and undesirable, they can be avoided with
the practice of appropriate lifestyle habits. Proper recovery from exercise requi-
res a multi-factorial approach. Healthy lifestyle habits strongly influence the time
needed to balance disrupted hormone levels. A timely recovery can be achieved
with adequate sleep, proper nutrition, and the practice of various other beneficial
lifestyle habits. During sleep, a natural balance of circulating hormones occurs. A
good night’s rest results in a sleep-induced decline of elevated cortisol levels. These
rise even further, however, with insufficient sleep. Seven and a half hours of sleep
per night may be considered a sufficient amount, but nine hours is optimal. Proper
nutrition provides all of the essential vitamins and minerals necessary for bodily
functions. Nutritional factors will also strongly affect hormonal levels. Maximizing
foods like fruits, vegetables, and nuts while minimizing foods like trans fats, refined
carbohydrates, and sugar will result in a decline of circulating cortisol. Conversely,
poor dietary habits will result in an increase in the levels of this hormone. The
practice of many other various habits will also influence levels of circulating cor-
tisol. Several parameters will reduce cortisol levels and therefore decrease the time
needed for recovery. These factors include proper hydration, massage, meditation,
deep-breathing techniques, laughter, music therapy, reduction of psychological
and emotional stress, and consumption of whole foods such as fruits, vegetables,
beans, nuts, seeds, and wild fish. Likewise, several factors increase cortisol levels,
extending the time necessary for recovery. These factors include alcohol consump-
tion, caffeine intake, severe caloric restriction, a low-fiber diet, the consumption of
insufficient micronutrients and antioxidants, a sedentary lifestyle, and being over-
weight. Cortisol and sympathetic dominance is a necessary component of exercise,
but prolonged elevated levels can be detrimental to performance. While the role
this hormone plays in exercise is elaborate and complex, the necessary methods
for recovery are simple. Adequate sleep, proper nutrition, and the practice of good
lifestyle habits will result in improved recovery from exercise and an increase in
performance.
[email protected] 06 Aug 2018
FITNESS IN SOCCER
Fatigue management
230
13.4.3.4 Individualization
Since various studies on the effectiveness of recovery strategies show a high inter-
individual variability, coaches should utilize different recovery strategies
with different players. Coaches should also consider appropriate diets, rehydra-
tion, and a controlled lifestyle, and this may be a sufficient recovery intervention
for young elite athletes (Tessitore et al., 2007). It may be even advisable to custo-
mize recovery interventions individually based on the requirements and preferen-
ces of players. After a match, emotional and mental states can increase or decrease
fatigue. One player might want to go to the forest or park for a recovery session to
clear his head, while another player might perceive this as an additional source of
frustration, exacerbating the psychological fatigue.
It seems essential to customize recovery methods according to gender, especially
given the effects of gender on the physiological responses during exercise and the
post-exercise recovery period, so as to maximize the processes of physiological
recovery while minimizing the risks of injury in female athletes (Hausswirth and
Le Meur, 2011). Venter (2012) examined how elite team athletes perceive the impor-
tance of various recovery modalities. Differences between men and women, play-
ers from various team sports, and different levels of participation were determined.
Recovery modalities that were rated as important by all players—regardless of gen-
der, type of sport, or level of participation—were sleep, fluid replacement, and soci-
alizing with friends. Gender could play a role in how the importance of recovery
modalities was perceived. Men rated an ice bath and supplements as significantly
more important than women, while women rated discussions with their teammates
and coaches after training and matches as significantly more important than men.
13.4.4 Recovery strategies: Conclusion
The recovery phase must be considered as an inherent component of the trai-
ning process. It must therefore be granted the same degree of attention in its pro-
gramming and management as the exercise sessions themselves (Hausswirth and
Le Meur, 2011). Given the importance of improving how athletes feel, combined
recovery strategies could be used after intense soccer match play to help perceived
recovery (Kinugasa and Kilding, 2009).
Recommendations:
• Replenish glycogen stores immediately after a match (intake of carbohydrates).
• Consume proteins to assist muscle regeneration.
• Don’t drink alcohol before or after a match.
• Warm up properly, because this will decrease post-match DOMS.
• Restore fluid balance.
• Do not use massage.
• Replenish electrolytes.
• Sleep a minimum of 10 hours for each of the two days following a match (sleep
extension).
• Take a daily nap of 25 minutes after lunch (between 1pm and 4pm).
• Avoid any eccentric work in the two days following the match.
• Avoid explosive actions, such as sprinting or shooting drills, in the 48 hours
after a match.
[email protected] 06 Aug 2018
FITNESS IN SOCCER
Fatigue management
231
• Organize a debriefing and set realistic goals after the match.
• Organize whole-body, cold-water immersion lasting 10–20 minutes at a water
temperature of 10–15°C. (This may be after the game or the day after.)
• Avoid stressful situations.
• Customize recovery and don’t oblige players to participate in recovery strate-
gies that could be perceived as stressful.
• Explain the use of the recovery strategies.
• Focus on mental recovery after the game.
In conclusion, post-match recovery can help prevent muscle soreness and therefore
the quality of subsequent training. However, passive post-match recovery strate-
gies—such as mental recovery, social support, nutrition, hydration and adequate
sleep—are probably the most important recovery strategies for the hours directly
following a game. Active recovery strategies are best planned for the following
day, because no differences have been found when using immediate post-match
active recovery. Coaches should also be aware that rest and mental recovery are
important. Forcing players to come to the ground through busy traffic, or forcing
skeptical players to undergo cold-water immersion or contrast baths, will probably
frustrate adequate recovery because it increases mental stress, and this will subse-
quently jeopardize recovery.
Short-term recovery
Process
Duration
Phosphocreatine stores
3
–5 min. The replenishment of CP stores is an oxygen
dependent processes (Bonen et al., 1978)
Breakdown and processing of lactate
1
–3 hours. The half-life period is approximately 15
min. A wide range of lactate elimination constants
(expressed as half-life period: 9.2
–18.2 min) has been
demonstrated in cyclists after exhaustive exercise.
This supports the hypothesis of inter-individual
variation in lactate kinetics. (Francaux et al., 1989)
Table 13.1: Short-term recovery (< 6 hours).
Recovery between 6 and 36 hours
Process
Duration
Glycogen compensation
24
–36h
Normalization and replenishment of electrolyte concentrations (N, Ka)
6h
Buildup of contractile proteins
12
–48h
Table 13.2: Recovery between 6 and 36 hours.
[email protected] 06 Aug 2018
FITNESS IN SOCCER
Fatigue management
232
RECOVERY >48H
Process
Duration
Replenishment of muscle enzymes
48
–60h
Rebuilding of protein structures,
including mitochondria
48
–72h
Supercompensation of glycogen
reserves
48
–72h
Replenishing electrolytes (Mg, Fe)
48
–72h
Replenishment of hormones
catecholamine resynthesis
48
–72h
Cortisol resynthesis
3
–5 days
Replenishing of glycogen stores
Piehli (1974) investigated the replenishment of glycogen
stores after exercise. During the first five hours, there
was a marked storage of glycogen in the muscle that
was related to the carbohydrate intake, but pre-exercise
concentrations of muscle glycogen were first observed
after 46 hours. The increase in glycogen occurred in
both fiber types, but the fast twitch fiber replenished
their glycogen somewhat faster than the slow twitch
fibers, suggesting a higher glycogen synthetase activity.
New production of structural proteins
(enzymes, mitochondria, binding
support tissue)
days to weeks
Table 13.3: Recovery > 48 hours.
13.5 MONITORING FATIGUE AND RECOVERY IN SOCCER
13.5.1 Introduction
The implementation of a successful training program in soccer requires an appro-
priate training stimulus relative to the physical capabilities of the player, coupled
with adequate recovery periods. Failure to maintain this equilibrium can increase
injury risk and lead to overtraining (Kuipers and Keizer, 1988). Therefore, in hig-
hly trained soccer players subjected to high training loads, any methods likely to
improve the knowledge of a player’s training status are of great interest to coa-
ches. Multiple methods for monitoring load and status have been suggested, but
their invasive (e.g., blood markers) (Heisterberg et al., 2013) and/or exhaustive
(e.g., maximal tests) (Meeusen et al., 2006) nature makes them difficult to monitor
frequently in a team sport environment. More recently, a number of more practi-
cal testing methods have been suggested and researched, such as heart rate vari-
ability (HRV), monitoring of neuromuscular fatigue through jump tests, and the
use of subjective questionnaires. This chapter will therefore detail various practical
methods for monitoring fatigue and recovery, outline protocols for data collection
in a squad environment, and provide information on various analysis methods.
Finally, it will offer the reader some steps and information on developing a play-
er-monitoring system that can be used to visualize data and provide the coach or
sports scientist with an overview of a player’s training status.
[email protected] 06 Aug 2018
FITNESS IN SOCCER
Fatigue management
233
13.5.2 Heart Rate Variability (HRV)
It has been proposed that the cardiac autonomic nervous system—assessed nonin-
vasively via exercise heart rate (HRex), heart rate recovery (HRR) or heart rate vari-
ability (HRV) (Buchheit et al., 2012)—may provide useful information regarding
functional adaptations to a given training stimulus. HRV recordings have been
shown to reflect acute fatigue following exercise (Mourot et al., 2004) and used to
make inferences about appropriate training periodization (Kiviniemi et al., 2007).
The usefulness of a marker to assess physiological adaptation to training ideally
requires it to be easy to administer, so frequent monitoring will be possible with
minimal inconvenience to the athlete (Borresen and Lamber, 2008). Studies monito-
ring daily morning HRV at rest (Plews et al., 2012; Sartor et al., 2013) or post-exer-
cise (Buchheit et al., 2012) have used protocols that require recordings in excess of
five minutes. This may not be practical in a team sport environment. It has been
suggested that ECG recordings as short as 10 seconds can accurately predict car-
diac vagal tone (Hamilton et al, 2004). This therefore opens the door for shorter,
more practical HR recordings, which could then be used to access daily HRV in a
team environment.
13.5.2.1 Guidelines for collection
Day-to-day variation in HRV values is high because of a number of environmental
factors, such as noise, temperature, light and so on (TaskForce, 1996). The lack of
sensitivity of HRV measures to detect fatigue may at times be caused by the relative
“error” of these recordings (Al Haddad et al., 2011), and these factors most likely
account for the large discrepancy between studies. Thus, a consensus on the most
valid and reliable HRV index and collection method needs to be established for
consistent research methodology and data collection in a practical environment. As
is shown in the literature, HRV assessments can be highly sensitive to physiolo-
gical and environmental changes. The physiological changes are what we want to
monitor, so it is therefore very important to limit the number of external factors that
can lead to inaccurate, unreliable results. In order to gain the most accurate and the-
refore most useful results, it is vital to be consistent in your measurement protocol.
One of the most important factors in gaining accurate results is the timing of the
measurement. Research and product guidelines from companies offering HRV-as-
sessment products (e.g., OmegaWave, iThlete, etc.) suggest that the most accurate
time for assessment of ANS status is first thing in a morning upon waking. During
sleep, the parasympathetic branch of the ANS is dominant, repairing and rebuil-
ding muscles and replenishing fuel stores. Thus, after a night of rest is the optimum
time for HRV assessment. However, this may not be the most practical method in
a team environment. It requires each player to have access to equipment at home
and trust in the players to complete this assessment correctly away from coaching
and medical staff.
Another assessment protocol proposed by Martin Buchheit is the 5’-5’ test. This
involves 5 minutes of running at a submaximal pace (9 km/h) followed by 5 minu-
tes of recovery. This test allows for assessment of HRex during the 5-min run, HRR
during the first 60s of recovery and post-exercise HRV from the final 3 minutes of
recovery. The rationale behind this method of assessment is the ability to assess
multiple HR indices all at once and its ability to eliminate environmental stressors
that are apparent during resting HRV assessments. While this protocol is time con-
[email protected] 06 Aug 2018
FITNESS IN SOCCER
Fatigue management
234
suming, making it less practical for daily monitoring of fatigue and recovery in
soccer, it could be used on a weekly, monthly or post-training-phase basis, and it
has been shown to correlate well with fitness- and drill-based running performance
(Buchheit et al., 2012).
A more practical method of assessing HRV may be a morning resting reading con-
ducted on arrival at the training ground. This allows for a quick and reliable assess-
ment on a daily basis under the supervision of coaching and medical staff. When
using this protocol, it is important to educate the players about their morning rou-
tines. Players must consume no liquids other than water, particularly no energy
drinks or coffee. They must also refrain from any strenuous activity and not con-
sume any food until after the assessment. Further details and an example of this
protocol will be set out later in the chapter.
13.5.2.2 Analysis
Once a valid and reliable assessment protocol has been set out and data has been
collected, the next important step is data analysis. With modern technology like
iThlete and OmegaWave, all of the analysis is done for you. You simply perform the
ECG recording and are given a HRV score. Some statistical analysis on your “readi-
ness” to train is even provided using rolling averages and worthwhile-change sta-
tistics. However, for a sports scientist, it is important to understand the process
behind these numbers. The first step in the analysis of HRV is obtaining high-qua-
lity ECG tracings under stable, controlled conditions. In a practical environment,
this will usually be completed via HR telemetry. The second step is the recognition
of the QRS complex (Figure 13.4A). Peak detection is often performed with com-
mercially available software. An algorithm is then used (Beckers et al., 1999) for
threshold detection. The result is a discrete, unevenly spaced time event series: the
tachogram obtained from the ECG. It is crucial that these signals are corrected for
abnormal and missed beats before processing (Aubert and Ramaekers, 1999; Pum-
prla et al., 2002). After this step, an R-R interval (all intervals between adjacent QRS
complexes resulting from sinus node depolarizations, often called a normal-to-nor-
mal (N-N) interval) can be obtained (Figure 13.4B).
A
B
Fig. 13.4: A) Heart rate QRS complex obtained from ECG. B) Example of heart rate R-R interval.
[email protected] 06 Aug 2018
FITNESS IN SOCCER
Fatigue management
235
✓ HRV Indices
Using the R-R interval gained from the ECG, a number of time-domain and fre-
quency-domain methods can be used for analysis (mathematical calculations
used to assess HRV from R-R intervals). Task-Force (1996) suggests the variety of
time-domain measures of HRV is not important, because many of the measures
correlate closely with others. However, the Ln rMSSD is suggested as the prefer-
red index for assessing short-term components of HRV. Ln rMSSD is a mathemati-
cal calculation between R-R intervals and stands for “the natural logarithm of the
square root of the mean sum of the squared differences between R-R intervals.”
Ln rMSSD has been shown to be the most reliable HRV index for short-term recor-
dings, and it is used by manufacturers of HRV-assessment products for a number
of reasons:
• Breathing frequency, unlike other spectral indices of HRV, does not signi-
ficantly influence Ln rMSSD and is therefore more suited to ambulatory
measures.
• Ln rMSSD can capture levels of parasympathetic activity over a short time
frame, which is more convenient for athletes who have limited time to acquire
a reading.
✓ Daily vs. Weekly Analysis
As previously stated, day-to-day variation in HRV can be high due to environmen-
tal noise. This makes the analysis of daily changes difficult to interpret. Research
has proposed that when HRV is used to assess changes in both negative and posi-
tive adaptation, both weekly and seven-day rolling averages may provide better
methodological validity than values taken on a single day. For example, Plews et al.
(2013) found that when HRV data points were averaged over a week, a meaningful
representation of training status was apparent in an NFOR (non-functional over-re-
aching) elite triathlete (i.e., worthwhile reductions in weekly-averaged HRV were
observed only during the period of NFOR). Comparatively, when single day values
were used for analysis, the HRV data were misleading (i.e., worthwhile reductions
in HRV indicative of NFOR occurred when the athlete was training and perfor-
ming effectively). This suggests that averaged morning resting HRV data provi-
des a more consistent representation of actual changes in an athlete’s autonomic
balance with training when compared with a single isolated value.
✓ Weekly Coefficient of Variation (CV)
An innovative method of assessment proposed by Plews et al. (2013) is a weekly
rolling coefficient of variation (CV). The authors found a reduction in the day-to-
day variability of HRV, in conjunction with rolling average HRV, in an athlete that
was diagnosed with NFOR. The authors therefore suggested weekly rolling CV
may provide a more complete measure for diagnosing NFOR, as it is still unclear
whether HRV should be expected to increase or decrease in the case of overtraining
(OT). The use of rolling CV would be therefore applicable irrespective of the trend
towards parasympathetic or sympathetic dominance and the stage of NFOR or OT.
[email protected] 06 Aug 2018
FITNESS IN SOCCER
Fatigue management
236
✓ HRV to HR Ratio
A further method of HRV analysis that was suggested by Plews et al., (2013) is
the Ln rMSSD to R-R interval ratio. They propose that a common misconception
made by sports practitioners using HRV to assess ANS status is that there is a direct
linear relationship between the vagal-related indices of HRV and the parasympa-
thetic influence on heart rate (HR). In reality, however, the relationship is quadratic
(Goldberger et al., 1994). This means that at both low (high HR) and high (low HR)
levels of vagal tone, vagal-related HRV indices are reduced. This is an important
consideration for practitioners using HRV to assess training status in elite athletes,
who typically have a low resting HR, undergo high training loads, and are there-
fore prone to saturation (e.g., decrease in HRV and decrease in HR) (Kiviniemi et
al., 2004). For example, during the different phases/loads of training, reductions in
HRV can occur, “theoretically” indicating ANS stress. However, this trend should
only be interpreted in light of the respective changes in resting HR to assess whether
this decrease can be the result of the saturation phenomenon or not. This can be
achieved by using the HRV to HR ratio, which simultaneously considers changes in
both vagal tone (HR) and vagal modulation (HRV). However, research has shown
that individual players can display very different HRV to HR ratios when they are
fatigued or in an optimal state (Plews et al., 2013; Fitzpatrick et al., unpublished).
Fig. 13.5: HRV to HR profiles for six different players who all followed the same training program
over a six-week preseason training period (Fitzpatrick et al., unpublished).
[email protected] 06 Aug 2018
FITNESS IN SOCCER
Fatigue management
237
Figure 13.5 shows HRV to HR profiles for six players in the same squad, all of
who completed the same six-week preseason training program. All players show
distinctly different profiles, despite the fact that all players coped well with the
demands of training, as is evident in the stable levels of HRV (-0.01 (-0.11; 0.09)
AU/day) and wellness (-0.02 (- 0.06; 0.03) AU/day) throughout the training period
This has important implications for practitioners working in soccer, where data
may be analyzed as a group and the conceptions of what is optimal may be applied
to the group as a whole. Furthermore, the optimal relationship between HRV and
RHR is likely to be individual (i.e., correlated, low-correlated or saturated [Kivi-
niemi et al., 2004]). This implies that longitudinal monitoring and an understan-
ding of an individual player’s response to training and competition (HRV to HR
“fingerprint”) is needed before this relationship can be useful enough to assist with
training prescription and act as a possible predictor of overtraining.
13.5.2.3 HRV Summary
In summary, reductions in HRV may be associated with fatigue in soccer players.
However, the conclusions from past literature suggest isolated HRV values should
be viewed with caution. We suggest the use of both the HRV rolling weekly aver-
age and HRV-to-HR ratio to correctly interpret fatigue, or a “readiness to perform,”
in soccer players. (i.e., Worthwhile reductions in HRV with concurrent increases in
the HRV to HR ratio are more indicative of fatigue, with decreases in both possibly
indicating readiness to perform.) Furthermore, the optimal relationship between
HRV and HR for training and performance alone is likely to be individual. This
implies that longitudinal monitoring and an understanding of a particular athlete’s
response to training and competition is required for effective monitoring.
13.5.3 Monitoring Neuromuscular Fatigue
Measures of neuromuscular function are often used to assess recovery after soccer
training or match play (Magalhães et al., 2010) because of their greater ability to
monitor low-frequency fatigue compared with other indirect markers. Measures of
neuromuscular function include various jump tests (e.g., countermovement jump,
squat jump), sprint performance, and isokinetic dynamometry. Jump procedures
are popular due to their replication of the stretch-shortening capabilities of the
lower-limb musculature and the ability to evaluate fatigue (Komi, 2000). Moreover,
jump measures are ideal for a soccer environment because they are noninvasive,
easy to administer, easy to interpret, and cause minimal additional fatigue (Twist
and Highton, 2013). While some research has questioned the sensitivity of jump
procedures in assessing neuromuscular fatigue in team sports (Cormack et al.,
2008), others have found it to detect impaired muscle function in soccer players
following match play (Magalhães et al., 2010).
[email protected] 06 Aug 2018
FITNESS IN SOCCER
Fatigue management
238
13.5.3.1 Methods of Assessment
3D kinematic motion analysis is considered the “gold-standard” criterion method
to evaluate jump performance; however, this procedure is time consuming and
impractical in an applied setting. Another data collection method is to use a por-
table force platform. This can provide comprehensive data on a number of para-
meters, such as muscle force, power, rate of force development, jump height, and
flight-time characteristics during jumping. Another useful variable that appears to
be sensitive to fatigue changes after match play is the flight time to contraction time
ratio or reactive strength index (RSI, jump height / contact time). This represents
the time from the initiation of the countermovement until the player leaves the
force plate. Collecting data on several parameters is particularly useful given that
peak force recovers more quickly than peak power and rate of force development
in team sport players after a match (McLellan et al., 2011).
Some protocols may include single countermovement jumps, while other resear-
chers have suggested multiple jumps (e.g., five repeated countermovement jumps)
because several variables within this protocol might react differently than with a
single jump, and this could be useful in understanding the mechanisms of fatigue
(Cormack et al., 2008). Jump performance can also be assessed using a contact mat
or similar system, but this provides only measures of flight time, predicted jump
height based on vertical displacement, and contact time. This method does unde-
restimate jump height when compared with a criterion measure, but it still has
good reliability (Moir et al., 2008). The contact mat therefore provides a cost-effec-
tive alternative to measuring neuromuscular function when a portable force plat-
form is not available.
13.5.3.2 Types of Jump Assessment
The countermovement jump (CMJ) is one method often used to assess neuro-
muscular fatigue. Although this test has been widely researched across a range
of sports, inconsistency still exists with regard to how effective CMJ performance
is as an indicator of fatigue. Most notably, studies by Cormack et al. (2008; 2008a),
examined the reliability of a number of CMJ parameters during inter- and intra-day
repeat tests and the response of several of these variables following a single AFL
game. These studies identified that CMJ height lacked the necessary sensitivity to
optimally detect the changes associated with neuromuscular fatigue. They propo-
sed that because CMJ height is a performance outcome, small alterations in techni-
que are not acknowledged during data analysis, yet it is these minor modifications
that occur when neuromuscular fatigue is present. It was proposed by Cormack et
al. (2008) that the CMJ ratio of flight time to contraction time appears to be the most
useful variable for monitoring neuromuscular status because of its high sensitivity
and the substantial changes observed following match play.
This is further supported by the work of Taylor et al. (in review). The authors
looked at various kinetic and kinematic variables in order to examine their sensiti-
vity to fatigue-induced neuromuscular status. They found jump height to be sensi-
tive to changes in neuromuscular status, but this was not apparent in all subjects.
Findings showed that negative responses in the flight time to contraction time ratio
were observed during deliberate overreaching for all subjects.
[email protected] 06 Aug 2018
FITNESS IN SOCCER
Fatigue management
239
If the flight time to contraction time ratio is going to be measured, one simple
method of assessing this is a drop jump (DJ). A study by Hamilton (2009) suggested
the DJ may offer a more valuable insight into the neuromuscular changes associa-
ted with fatigue, due to the comparable muscle qualities required for success in a
drop jump, agility tasks, and maximal running speed.
13.5.3.3 Drop jump protocol to assess recovery
• Each player should perform a thorough standardized warm up consisting of
dynamic stretching and jumping activities.
• As suggested by Taylor et al. (2012) multiple trials (>4) should be performed to
ensure the most reliable results.
• Instruct players to drop from a box height of 30cm then jump vertically for
maximal height with minimal contact on the ground and with minimal flexion
of the knee and hip.
• Verbal encouragement should be given to players to perform maximally.
• If using a contact mat, calculate the reactive strength index (RSI) by dividing
jump height by contact time.
• Take the mean of multiple DJ-RSI scores for analysis.
13.5.4 Psychometric and subjective monitoring tools
Changes in subjective psychometric wellness and mood states have frequently
been described as consistent, sensitive, and early markers of overreaching and
overtraining in competitive athletes (Meeusen et al., 2006; Urhausen and Kinder-
mann, 2002). Alterations in perceived fatigue and muscle soreness are also known
to outlast reductions in neuromuscular performance and biochemical markers in
elite team sport players (Twist et al., 2012). An advantage of subjective measures is
their ability to capture other aspects of player wellness, such as fear of failure, com-
petitive failure, excessive expectations from a coach or the public, and the demands
of competition, as well as the professional and social areas of a player’s life. This
change in psychological state, or mental fatigue, is also known to alter an individu-
al’s sense of effort, forcing athletes to down-regulate their exercise capacity (Mar-
cora et al., 2009). Measurement of these subjective markers is therefore deemed
necessary to better understand fatigue and recovery in soccer players.
A range of tools for the measurement of subjective wellness exist, such as the Pro-
file of Mood States questionnaire (POMS), the Daily Analysis of Life Demands for
Athletes questionnaire, the Recovery-Stress Questionnaire for athletes, and the
Total Quality Recovery scale. These all enable coaches to easily monitor the com-
plex psychophysiological stresses that are associated with fatigue and recovery,
such as muscle soreness, sleep quality, mood disturbances, and altered attitudes
to training. Unquestionably, the time course of changes in a player’s psychological
state during periods of intense training and underperformance is concurrent with
physiological and performance changes. However, a concern raised by coaches is
the subjectivity of these measures and the scope for athletes to manipulate respon-
ses to facilitate a favorable outcome. Moreover, when questionnaires are completed
daily, coupled with the length of some questionnaires, concerns over player com-
pliance need to be considered.
[email protected] 06 Aug 2018
FITNESS IN SOCCER
Fatigue management
240
13.5.4.1 Profile of Mood States (POMS)
POMS is a psychological rating scale that measures the state of mind/mood for
sportspersons via six scales: Tension-Anxiety, Depression-Dejection, Anger-Hosti-
lity, Vigor-Activity, Fatigue-Inertia, Confusion-Bewilderment. Players are asked to
self-report a series of mood states. The original test was developed by McNair and
co-workers and has 65 items. A shorter version of the POMS test was developed
by Cella and colleagues in 1987 that contains only 11 of the original POMS items.
The POMS scale has been used in thousands of scientific investigations and is very
useful in assessing how players cope with training loads.
13.5.4.2 RESTQ-sport (The Recovery-Stress Questionnaire for Athletes)
There are also questionnaires available for monitoring recovery. The RESTQ-sport
(Kellmann and Kallus, 2001) assesses the player’s perception of recovery. The
RESTQ-sport has been used worldwide to monitor perceived recovery. Coutts and
Reaburn (2008) assessed whether the Recovery-Stress Questionnaire for Athletes
(RESTQ-Sport) could be used to monitor changes in perceived stress and reco-
very during intensified training of rugby league players. They concluded that the
RESTQ-Sport is a practical psychometric tool for monitoring responses to training
in team sport athletes.
However, the test cannot be executed daily because it asks the athlete about how
often the respondent participated in various activities during the preceding three
days and nights.
13.5.4.3 Total quality recovery (TQR)
The TQR (Kentta and Hassmen, 2002) is a 20-point scale that assesses recovery as a
combination of recovery actions and the athlete’s perceptions of recovery. Players
using the TQR concept collect points in a 24-hour period. A score of 20 is the maxi-
mum score, while 13 is considered the minimum score. Scores below this arbitrary
threshold could indicate under-recovery. This questionnaire makes the player
aware of the important factors for boosting recovery, such as eating regularly and
drinking enough before and after physical exertion. It is very easy to use and can be
used daily, and it is easily assessed by both players and coaches.
Scoring Recovery Points
Nutrition & Hydration (8 points)
Breakfast
1 point
Lunch
2 point
Supper
2 points
Snacks between meals
1 point
Carbohydrate reloading after practice
2 points
Adequate hydration (8 points)
throughout the day
1 point
During and post-workout
1 point
[email protected] 06 Aug 2018
FITNESS IN SOCCER
Fatigue management
241
Sleep and Rest (4 points)
Good night of quality sleep
3 points
Daily nap (20
–60min)
1 point
Relaxation and Emotional Support (3 points)
Full mental/muscular relaxation ASAP after practice
2 points
Maintaining a relaxed state throughout the day
1 point
Stretching and Warm down (3 points)
Proper warm down after each training period
2 points
Stretching all the exercised muscle groups
1 point
Table 13.4: Total quality recovery
13.5.4.4 Ratings of Perceived Exertion
Ratings of perceived exertion (RPEs) are a qualitative and simple way of measuring
the exertion perceived during training. It takes into consideration the mental and
physical factors that cause the stresses of training. The concept of perceived exer-
tion was introduced by Gunnar Borg as the “Borg RPE Scale®.” This was done by
placing verbal anchors from simple category (C) scales (rank order scales) at the
best possible position on a ratio scale (a “CR-scale”), covering the total subjective
dynamic range, so that a correspondence in meaning was obtained between the
numbers and the anchors. The range of 6–20 was created so the HR can be simply
estimated by multiplying the Borg score by 10. This gives an approximate heart rate
for a particular level of activity.
Total Quality Recovery
6
No recovery at all
7
extremely poor recovery
8
9
very poor recovery
10
11
poor recovery
12
13
reasonable recovery
14
15
good recovery
16
17
very good recovery
18
19
extremely good recovery
20
Maximal Recovery
[email protected] 06 Aug 2018
FITNESS IN SOCCER
Fatigue management
242
13.5.4.5 Wellness questionnaires
Possibly a more practically applicable solution is the use of shorter, simpler ques-
tionnaires, such as that proposed by McLean et al. (2010). A simple questionnaire
such as this is time efficient, always available for daily collection, and able to cap-
ture data on a number of wellness measures. Figure 13.6 shows an example ques-
tionnaire adapted from Mclean et al. (2010). It includes fatigue and energy levels,
sleep quality, sleep duration, general muscle soreness, and stress and mood levels.
Fig. 13.6:. Example Daily Wellness Questionnaire. (Adapted from Mclean et al., 2010)
[email protected] 06 Aug 2018
FITNESS IN SOCCER
Fatigue management
243
Another simple measure that can be added to a daily wellness questionnaire is
“areas of muscle soreness, stiffness and pain.” This can allow coaches, sports scien-
tists, and medical staff to monitor any potential areas of discomfort and injury
(Figure 13.7).
Fig. 13.7: A simple anatomical diagram that can be used to allow players to note down areas of
soreness on their daily wellness questionnaire (TopSportsLab)
✓ Analysis of Daily Wellness Questionnaire
All five measures on this simple daily questionnaire are scored on a 1–5 scale, with 1
being very poor and 5 being very good. This allows for certain variables to be either
analyzed on an individual basis or through a summed score (out of 25) that gives
the Total Daily Player Wellness. Statistical analysis of the questionnaire, along with
all other measures of fatigue and recovery, will be explained in the next section.
13.5.5 Statistical analysis
The fundamental goal for any player-monitoring system is the ability to inform
decisions and ultimately improve performance. Although daily assumptions can
be made using various data-collection methods, as discussed above, it is important
to note that it can take months and even years of data collection to truly understand
what the data means and how to use it. Jumping to conclusions based on an inade-
quate amount of data can lead to poor decisions being made that have a negative
effect on performance.
To successfully collect, analyze, and interpret data, the first step is your collection
protocol. Below is an example of a typical daily routine that can be carried out each
morning in around 20 minutes.
• 8:30am – Players arrive at the training ground and fill out Daily Wellness
Questionnaires as they collect their training kits.
• 8:35am – Players report to the gymnasium for a one-minute HR assessment.
This involves a few minutes of relaxation followed by the one-minute HR
reading to assess HRV and Resting HR.
• 8:40am – Following their HRV assessment, players perform a standardized
warm up before completing four drop jumps on a contact mat to assess daily
RSI.
[email protected] 06 Aug 2018
FITNESS IN SOCCER
Fatigue management
244
Once this protocol has been completed, players are free to have breakfast and relax
until the start of training. In this time, the data can be analyzed by support staff
and reported to coaches, detailing players who require rest or a reduced training
load and players who are in an optimum condition to train fully. If this system is to
work, an efficient data-collection database and analysis system needs to be in place.
Following data collection, the next important step is analyzing the data and
deciding which changes in the daily measures warrant intervention. The use of
arbitrary thresholds (e.g., a change of 5%) has been discouraged (Twist and High-
ton, 2013) because the variation observed, when identifying a fatigued condi-
tion, may fall within the boundaries of typical variation for some measurements
(e.g., jump measurements ~1–6%; Cormack et al., 2008). One possible statistical
method that may provide a better insight into the magnitude of change is the smal-
lest worthwhile change statistic (SWC) (Hopkins et al., 2009). This is calculated by
multiplying the between-player standard deviation by 0.2. Figure 13.8 depicts an
example of how this method can be used to show a positive or negative change in
monitoring data.
Fig. 13.8: Example of monitoring changes in rolling average HRV using SWC.
This method can be applied to all monitoring data to give coaches and support
staff a qualitative description of the magnitude of daily changes in recovery status.
13.6 TAPERING
Tapering is part of fatigue-management strategies. In the last phase of the micro-
cycle, mini-tapering strategies should be applied. Tapering is one of the most
important challenges for a coach, because it is a method of strategically unloading
athletes in order to reach peak levels of preparedness for competition. Various fac-
tors have to be taken into account in this regard, such as the accumulated fatigue
of the preceding days, physical and psychological stress, and recovery (e.g., sleep,
nutrition, etc.). Tapering is a progressive non-linear reduction of the training load
during a variable period of time in an attempt to reduce the physiological and
psychological stress of daily training and optimize sports performance (Mujika
and Padilla, 2003). Various forms of tapering have been described in the literature,
such as a linear taper in training load (Hickson et al., 1982), an incremental step-
wise reduction (Houmard and Johns, 1994), and an exponential taper with slow
or fast time-constant decay of the training load (Banister et al., 1995). Training
parameters like intensity, duration, frequency and volume can be altered to lower
[email protected] 06 Aug 2018
FITNESS IN SOCCER
Fatigue management
245
the training load in the days or weeks preceding a competition or match. This is
done in order to reduce accumulated fatigue and unmask fitness levels, because
residual fatigue may mask or attenuate fitness gains that have occurred through
overload training (Kuipers and Keizer, 1988). This decrease in training load could,
however, compromise training-induced adaptations. Lower levels of training load
and the subsequently decreased levels of accumulated fatigue can cause a partial
loss of training-induced performance adaptations, a process known as detraining
or deconditiong. Coaches must determine the extent to which the training load can
be reduced at the expense of the training parameters while retaining or improving
adaptations (Mujika, 2011). Exercise intensity during a taper seems to be the key in
maintaining or elevating performance. Research has demonstrated that low trai-
ning intensities either maintained or deteriorated performance (McConnell et al.,
1993), while tapers using intensities of 90% VO
2max (Costill et al., 1985) resulted in
enhanced performance. Houmard and Johns (1994) advised using interval training
work (>90% VO
2max) with sufficient recovery between bouts to maximize exercise
intensity. They suggest this is necessary to maintain training-associated adaptati-
ons despite the reduction in training volume. This was confirmed by Bosquet et
al. (2007) who found that maximal gains are obtained with a tapering intervention
of a two-week duration where the training volume is exponentially decreased by
41-60%, without any modification to either training intensity or frequency.
13.6.1 Effects of Taper
Tapering provides for:
• increased hemoglobin
• increased hematocrit value
• decreased percentage of neutrophils
• increased red blood cell volume
• increased production of new red blood cells
• increased buffer capacity for lactic acid
• increased muscle glycogen
• increase in testosterone
• reduction of cortisol
• increase in the testosterone-cortisol ratio
• increased sleep (This is important because of growth hormone being released
during certain phases of sleep, resulting in muscle tissue repair [Taylor et al.,
1997]).
• improved perceived sleep quality
[email protected] 06 Aug 2018
FITNESS IN SOCCER
Fatigue management
246
13.6.2 Rules for good tapering
13.6.2.1 Intensity
Intensity during tapering must be maintained in order to avoid detraining. It is
through the reduction of the other training parameters (i.e., volume, frequency and
duration) that efficient tapering should be achieved. Bosquet et al. (2007) highligh-
ted that the training load should not be reduced at the expense of training intensity
during a taper (Bosquet et al., 2007).
13.6.2.2 Frequency
Decreasing training frequency has not been demonstrated to improve perfor-
mance. Bosquet et al. (2007), however, highlighted that frequency of training is clo-
sely linked to other training parameters, such as volume and intensity.
13.6.2.3 Volume
Research suggests that the volume of training can be reduced to 50-70% of normal
without the special adaptations specific to the training being compromised. Mujika
et al. (2000) reported some years ago that better performance ensues from low-vo-
lume rather than moderate-volume tapers. This finding was confirmed by Le Meur
et al. (2012) when they suggested that athletes would maximize taper-associated
benefits by roughly halving their training volume.
13.6.2.4 Duration
Research shows that the optimal taper duration depends on the pre-taper training
volume and intensity, and it is generally 4–21 days. Tapering takes longer for speed
and strength athletes than it does for endurance athletes on account of the nervous
system recovering more slowly. It may be concluded that a taper duration of 7 to
15 days appears to represent the threshold between the positive effects of lowering
accumulated fatigue and the negative effects of deconditioning (Fitz-Clarke et al.,
1991) on performance.
13.6.3 Conclusion
The effects of mini-tapers have not yet been examined in team sports. Almost
all research on tapering strategies has focused on individual (endurance) sports.
Based on this research, we suggest the following strategies within the microcycles,
mesocycles, and macrocycle of team sports.
13.6.3.1 Microcycle
Mini-tapering strategies are applied during the last two days before a match to
reduce levels of accumulated fatigue, unmask fitness levels, and increase freshness
and preparedness.
1. Reduce the training duration by 50-60%.
2. Training intensity remains the same.
3. Increase the recovery time between exercises.
4. Stimulate mental recovery.
5. Stimulate sleep extension.
6. Wear compression socks while traveling.
7. Skip commercial activities and sponsor needs.
8. Manage media demands.
[email protected] 06 Aug 2018
FITNESS IN SOCCER
Fatigue management
247
13.6.3.2 Mesocycle
1. Tapering strategies are applied every third week to allow the body to recover
while avoiding detraining:
2. Reduce the total training volume by 60% by reducing the duration of training
sessions.
3. Keep the volume of high-intensity training sessions high.
4. Increase the recovery time between exercises.
5. Reduce training frequency by 20%.
6. Activities during tapering should be specific to the technical/tactical requi-
rements of the sport. So, in particular, reduce activities that are not specific to
the sport.
13.6.4 Macrocycle
There is an ongoing discussion in the media about players’ recovery time before
the start of every major tournament. Many players sustain injuries during such
tournaments, and some “star” players remain below their normal levels. Natio-
nal federations try to solve this problem by shortening the competition or brin-
ging it forward. Everyone probably remembers the 1992 European Championships
when Denmark unexpectedly won the tournament. Ten days before the start of
the UEFA European Football Championship™ finals qualifiers, Yugoslavia were
excluded and replaced by Denmark, the runners-up in their qualifying group.
National coach Richard Møller Nielsen had to contact his players, many of whom
had already left on vacation. They literally changed from their holiday clothes into
training gear. Some players had already been on vacation for four weeks. Accor-
ding to many observers, the psychological and physical freshness of the players
had a decisive factor in the success.
Two scientific studies describe preparations for an international tournament. In the
first study, Bangsbo et al. (2006) describe the preparation of the Danish national
team for the 1996 European Championships. The players were given a 1–2 week
break before the start of preparations, followed by 18 days of training divided into
two nine-day phases. The intensity of the exercises was identical in both phases,
but the volume was reduced in the second phase. The researchers emphasized that
it is important to measure the training load during all exercises. The load during
non-fitness exercises also has to be taken into account.
In 1998, France won the World Championships. Four years later, the same natio-
nal team was eliminated at the group stage, despite fielding a virtually identical
team. A study conducted in 2003 (Ferret and Cotte, 2003) describes the difference
between the two preparation programs. In 1998, 14 players arrived 32 days before
the start of the competition, 11 players arrived 25 days before, and finally, three
players started their preparations 19 days before the start of the competition. Four
years later, 7 players started preparing 25 days before the competition, 15 players
started 18 days before, and one player started only 8 days before. According to
the authors, the team had enough time in 1998 to prepare properly for the World
Championships by optimizing the players’ fitness. The staff organized two trai-
ning camps (Tignes and Clairefontaine). The group started with high volumes of
training, followed by three weeks of tapering, during which a few friendly games
were played and the players were given rest periods to eliminate fatigue. In 2002,
[email protected] 06 Aug 2018
FITNESS IN SOCCER
Fatigue management
248
the players had only a few days to prepare. During this period, it was impossible to
rebuild fitness and still allow tapering. Medical and biochemical markers showed
that the players were fatigued. In these circumstances, it was impossible for the
staff to prepare the team properly.
SUMMARY
In elite soccer, off-season and preseason periods are becoming shorter and shor-
ter, and players are increasingly expected to play in more competitive games
throughout the calendar year. Therefore, performance stabilization for the
modern soccer player is extremely important, and correct fatigue management
strategies are becoming paramount in the modern game. Simple, inexpensive
wellness questionnaires can be used by coaches to help monitor the fatigue sta-
tus of each player, providing easy-to-understand information in order to adjust
the training program accordingly. The implementation of tapering and recovery
strategies throughout a competitive season is critical to stabilize the performance
of the players, so that they can perform as close to their peak as possible over
an extended period of time. It is important that the coach pays particular atten-
tion to the needs of the individual player, ensuring that each player’s training
program is periodized correctly to avoid accumulation of fatigue and staleness.
Periodization is discussed in more detail in the following chapters.
REFERENCES
•
Al Haddad, H., Laursen, P.B., Chollet, D., Ahmaidi, S. and Buchheit, M., 2011. Reliability of resting and postexercise heart rate measures.
International journal of sports medicine, 32(08), pp.598-605.
•
Andersson, H., Karlsen, A., Blomhoff, R., Raastad, T. and Kadi, F., 2010. Active recovery training does not affect the antioxidant response
to soccer games in elite female players. British Journal of Nutrition, 104, pp.1492–1499.
•
Andersson, H., Raastad, T., Nilsson, J., Paulsen, G., Garthe, I. and Kadi, F., 2008. Neuromuscular fatigue and recovery in elite female
soccer: effects of active recovery. Med Sci Sports Exerc, 40(2), pp.372–80.
•
Aubert, A.E. and Ramaekers, D., 1999. Neurocardiology: the benefits of irregularity: the basics of methodology, physiology and current
clinical applications. Acta Cardiologica, 54(3), pp.107-20.
•
Baldari, C., Videira, M., Madeira, F., Sergio, J. and Guidetti, L., 2004. Lactate removal during active recovery related to the individual
anaerobic and ventilatory thresholds in soccer players. European Journal of Applied Physiology, 93, pp.224-230.
•
Barefield, S. and McCallister, S., 1997. Social support in the athletic training room: athletes’ expectations of staff and student athletic
trainers. J Athl Train, 32(4), pp.333–338. Bangsbo, J., Graham, T., Johansen, L. and Saltin, B., 1994. Muscle lactate metabolism in recovery
from intense exhaustive exercise: Impact of light exercise. J. Appl. Physiol., 77, pp.1890–1895.
•
Bangsbo, J., Mohr, M., Poulsen, A., Perez-Gomez, J. and Krustrup, P., 2006. Training and testing the elite athlete. J Exerc Sci Fit, 4, pp.1–14.
•
Banister, E.W., Carter, J.B. and Zarkadas, P.C., 1999. Training theory and taper: validation in triathlon athletes. Eur J Appl Physiol, 79,
pp.182–91.
•
Barnes M.J., Mundel, T. and Stannard, S.R., 2012. The effects of acute alcohol consumption on recovery from a simulated rugby match.
Journal of Sports Sciences, 30(3), pp.295-304.
•
Barnes, M.J., Mündel, T. and Stannard, S.R., 2010. Acute alcohol consumption aggravates the decline in muscle performance following
strenuous eccentric exercise. Journal of Science and Medicine in Sport, 13, pp.189–193.
•
Barnett, A., 2006. Using recovery modalities between training sessions in elite athletes. Does it help? Sports Medicine, 36, pp.781–796.
•
Beckers, F., Ramaekers, D. and Aubert, A.E., 1999. ACTS: automated calculation of tachograms and systograms. Prog Biomed Res, 4,
pp.160-5.
•
Bleakley, C., McDonough, S., Gardner, E., Baxter, G.D., Hopkins, J.T. and Davison, G.W. Cold-water immersion (cryotherapy) for preven-
ting and treating muscle soreness after exercise. Cochrane Database Syst Rev, 2012 Feb 15;2:CD008262. doi: 10.1002/14651858.CD008262.
pub2.
•
Bogdanis, G.C., Nevill, M.E., Lakomy, H.K., Graham, C.M. and Louis, G., 1996. Effects of active recovery on power output during repe-
ated maximal sprint cycling. Eur J Appl Physiol Occup Physiol, 74(5), pp.461–9.
•
Boileau, R.A., Misner, J.E., Dykstra, G.L. and Spitzer, T.A., 1983. Blood lactic acid removal during treadmill and bicycle exercise at various
intensities. Journal of Sports Medicine and Physical Fitness, 2, pp.159–167.
•
Bompa, T., 1999. Periodization: Theory and methodology of training. London: Blackwell Scientific.
•
Bompa, T.O. and Haff, G.G., 2009. Periodization: Theory and Methodology of Training-1999 Reprint. Champaign, IL: Human Kinetics,
pp.3-30.
•
Bonen, A. Campbell, C. Kirby, R. and Belcastro, A., 1978. Relationship between slow twitch muscle fibres and lactic acid removal. Cana-
dian Journal of Applied Sport Sciences, 3, pp.160- 162.
•
Borg, G., 1970. Perceived exertion as an indicator of somatic stress. Scandinavian journal of rehabilitation medicine, 2(2), pp.92–98.
[email protected] 06 Aug 2018
FITNESS IN SOCCER
Fatigue management
249
•
Borresen, J. and Lambert, M.I., 2008. Autonomic control of heart rate during and after exercise. Sports medicine, 38(8), pp.633-646.
•
Bosquet, L., Montpetit, J., Arvisais, D. and Mujika, I., 2007. Effects of tapering on performance: a meta-analysis. Med Sci Sports Exerc,
39(8), pp.1358—65.
•
Botterill, C. and Wilson, C., 2002. Overtraining: Emotional and interdisciplinary dimensions. In: M. Kellmann, ed. 2002. Enhancing reco-
very: Preventing underperformance in athletes. Champaign, IL: Human Kinetics. pp. 143-160.
•
Buchheit, M., Simpson, M.B., Al Haddad, H., Bourdon, P.C. and Mendez-Villanueva, A., 2012. Monitoring changes in physical perfor-
mance with heart rate measures in young soccer players. Eur J Appl. Physiol, 112(2), pp.711-723.
•
Calder, A., 2003. Recovery strategies for sports performance. USOC Olympic Coach E-Magazine.
•
Camm, A.J., Malik, M., Bigger, J.T., Breithardt, G., Cerutti, S., Cohen, R.J. and Singer, D.H., 1996. Heart rate variability: standards of
measurement, physiological interpretation and clinical use. Task Force of the European Society of Cardiology and the North American
Society of Pacing and Electrophysiology. Circulation 93(5), pp.1043-1065.
•
Cochrane, D.J., 2004. Alternating hot and cold water immersion for athlete recovery: A review. Physical Therapy in Sport, 5(1), pp.26–32.
•
Cormack, S.J., Newton, R.U. and McGuigan, M.R., 2008. Neuromuscular and endocrine responses of elite players to an Australian rules
football match. International journal of sports physiology and performance, 3(3), p.359.
•
Cormack, S.J., Newton, R.U., McGuigan, M.R. and Doyle, T.L., 2008. Reliability of measures obtained during single and repeated coun-
termovement jumps. International Journal of Sports Physiology and Performance, 3(2), p.131.
•
Costill, D.L., King, D.S., Thomas, R., Hargreaves, M., 1985. Effects of reduced training on muscular power in swimmers. Phys Sportsmed,
13, pp.94–101.
•
Coutts, A.J. and Reaburn, P., 2008. Monitoring changes in rugby league players’ perceived stress and recovery during intensified training.
Percept Mot Skills, 106(3), pp.904-16.
•
Crisafulli, A., Orru, V., Melis, F., Tocco, F. and Concu, A., 2003. Hemodynamics during active and passive recovery from a single bout of
supramaximal exercise. Eur. J. Appl. Physiol., 89, pp.209–216.
•
Dadebo, B., White, J. and George, K.P., 2004. A survey of flexibility training protocols and hamstring strains in professional football clubs
in England. Br J Sports Med, 38(4), pp.388–394.
•
Dawson, B., Cow, S., Modra, S., Bishop, D. and Stewart G., 2005. Effects of immediate post-game recovery procedures on muscle soreness,
power and flexibility levels over the next 48 hours. J Sci Med Sport, 8(2), pp.210-21.
•
Dowzer, C.N. and Reilly, T., 1998. Deep-water running. Sport Exerc. Inj., 4, pp.50–61.
•
Dupont G., Moalla, W., Guinhouya, C., Ahmaidi, S. and Berthoin, S., 2004. Passive versus active recovery during high-intensity intermit-
tent exercises. Med Sci Sports Exerc, 36(2), pp.302–8.
•
Dupont, G., Blondel, N. and Berthoin, S., 2003. Performance for short intermittent runs: active recovery vs. passive recovery. Eur J Appl
Physiol, 89(6), pp.548–54.
•
Dupont, G., Moalla, W., Guinhouya, C., Ahmaidi, S. and Berthoin, S., 2004. Passive versus Active Recovery during High-Intensity Inter-
mittent Exercises. Med. Sci. Sports Exerc., 36(2), pp. 302–308.
•
Dupont, G., Nedelec, M., McCall, A., McCormack, D., Berthoin, S. and Wisløff, U., 2010. Effect of 2 soccer matches in a week on physical
performance and injury rate. Am J Sports Med, 38, pp.1752‐1758.
•
Ferret, J. and Cotte, T., 2003. Analyse des differences de preparation medicosportive de l’Equipe de France de football pour les coupes du
monde 1998 et 2002. Lutter contre le dopage en gerant la recuperation physique. Publications de l’universite de SaintEtienne, pp.23—6.
•
Fitz-Clarke, J.R., Morton, R.H. and Banister, E.W., 1991. Optimizing athletic performance by influence curves. J Appl Physiol, 71,
pp.1151–8.
•
Fitzpatrick, J.F., Ade, J. and Weston, M., 2013. Monitoring heart rate variability and psychometric wellness during preseason training in
elite youth soccer players. (Unpublished data).
•
Francaux, M.A., Jacqmin, P.A. and Sturbois, X.G. 1989. Simple kinetic model for the study of lactate metabolic adaptation to exercise in
sportsmen routine evaluation. Arch Int Physiol Biochem, 97, pp.235–245.
•
Freeman, P. and Rees, T., 2008. The effects of perceived and received support on objective performance outcome. European Journal of
Sport Sciences, 8, pp.359-368.
•
Gill, N.D, Beaven, C.M. and Cook, C., 2006. Effectiveness of post-match recovery strategies in rugby players. Br. J. Sports Med, 40,
pp.260–263.
•
Goldberger, J.J., Ahmed, M.W., Parker, M.A. and Kadish, A. H., 1994. Dissociation of heart rate variability from parasympathetic tone.
American Journal of Physiology-Heart and Circulatory Physiology, 266(5), pp.H2152-H2157.
•
Gould, D. and Dieffenbach, K., 2002. Psychological issues in youth sports: Competitive anxiety, overtraining, and burnout. In: R. Malina
and M. Clark, eds. 2002. Youth sports in the 21st century: Organised sports in the lives of children and adolescents. East Lansing, MI:
Exercise Science Publishers.
•
Hackney, A.C., 1999. Neuroendocrine system: exercise overload and regeneration. In: J.M. Steinacker, ed. 1999. Overload, fatigue, perfor-
mance incompetence, and regeneration in sport. New York: Plenum. pp.173–86.
•
Halson, S., 2008. Nutrition, sleep and recovery. Eur J Sport Sci, 8(2), pp.199—226.
•
Halson, S.L., 2011. Does the time frame between exercise influence the effectiveness of hydrotherapy for recovery? Int J Sports Physiol
Perform., 6(2), pp.147–159.
•
Helladnsjo Bu, E.T., Watten, R.G., Foxcroft, D.R., Ingebrigtsen, J.E. and Relling, G., 2002. Teenage alcohol and intoxication debut: the
impact of family socialization factors, living area and participation in organised sports. Alcohol and Alcoholism, 37(1), pp.74–80. Hamil-
ton, D., 2009. Explosive Performance in Youth Soccer Players During Several Games in Succession: A Tournament Scenario. Australian
Journal of Strength & Conditioning. In-Press.
•
Hamilton, R.M., Mckechnie, P.S and Macfarlane, P.W., 2004. Can cardiac vagal tone be estimated from the 10-second ECG? International
journal of cardiology, 95(1), pp.109-115.
•
Hausswirth, C. and Le Meur, Y., 2011. Physiological and Nutritional Aspects of Post-Exercise Recovery: Specific Recommendations for
Female Athletes. Sports Medicine, 41(10), pp.861-882.
•
Heisterberg, M.F., Fahrenkrug, J., Krustrup, P., Storskov, A., Kjær, M., and Andersen, J.L., 2013. Extensive monitoring through multiple
blood samples in professional soccer players. The Journal of Strength & Conditioning Research, 27(5), pp.1260-1271.
•
Hickson, R.C., Kanakis Jr, C., Davis, J.R., Moore, A.M. and Rich, S., 1982. Reduced training duration effects on aerobic power, endurance,
and cardiac growth. J Appl Physiol, 53(1), pp.225–9.
•
Hilbert, J.E., Sforzo, G.A. and Swensen, T., 2003. The effects of massage on delayed onset muscle soreness. Br J Sports Med, 37(1), pp.72–5.
•
Hopkins, W., Marshall, S., Batterham, A. and Hanin, J., 2009. Progressive statistics for studies in sports medicine and exercise science.
Medicine+ Science in Sports+ Exercise, 41(1), p.3.
•
Hopkins, W.G., Hawley, J.A. and Burke, L.M., 1999. Design and analysis of research on sport performance enhancement. Med Sci Sports
Exerc., 31(3), pp.472–485.
•
Horne, J., 2011. The end of sleep: ‘Sleep debt’ versus biological adaptation of human sleep to waking needs. Biological Psychology,
87(1), pp.1-14.
•
Houmard, J.A. and Johns, R.A., 1994. Effects of taper on swim performance: practical implications. Sports Med, 17(4), pp.224–32.
•
Houmard, J.A., Costill, D.L., Mitchell, J.B., Park, S.H., Hickner, R.C. and Roemmich, J.N., 1990. Reduced training maintains performance
in distance runners. Int J Sports Med, 11, pp.46–52.
•
Ispirlidis, I., Fatouros, I., Jamurtas, A., Nikolaidis, M., Michailidis, I., Douroudos, I., Margonis, K., Chatzinikolaou, A., Kalistratos, E.,
Katrabasas, I., Alexiou, V. and Taxildaris, K., 2008. Time-course of changes in inflammatory and performance responses following a
soccer game. Clin J Sport Med, 18, pp.423–431.
•
Impellizzeri, F.M, Rampinini, E., Castagna, C., Martino, F., Fiorini, S. and Wisloff, U., 2008. Effect of plyometric training on sand versus
grass on muscle soreness and jumping and sprinting ability in soccer players. Br J Sports Med, 42, pp.42–46.
•
Jakeman, J.R., Byrne, C. and Eston, R.G., 2010a. Efficacy of lower limb compression and combined treatment of manual massage and
lower limb compression on symptoms of exercise-induced muscle damage in women. J Strength Cond Res, 24(11), pp.3157–65.
•
Jakeman, J.R., Byrne, C. and Eston, R.G., 2010b. Lower limb compression garment improves recovery from exercise-induced muscle
damage in young, active females. Eur J Appl Physiol, 109(6), pp.1137–44.
[email protected] 06 Aug 2018
FITNESS IN SOCCER
Fatigue management
250
•
Jakeman, J.R., Macrae, R. and Eston, R., 2009. A single 10-min bout of cold-water immersion therapy after strenuous plyometric exercise
has no beneficial effect on recovery from the symptoms of exercise-induced muscle damage. Ergonomics, 52(4), pp.456–460.
•
Jougla, A., Micallef, J.P. and Mottet, D., 2010. Effects of active vs. passive recovery on repeated rugby-specific exercises. Journal of Science
and Medicine in Sport, 13, pp.350–355.
•
Kellmann, M. and Kallus, K.W., 1999. Mood, recovery-stress state, and regeneration. In: J.M. Steinacker, ed. 1999. Overload, fatigue,
performance incompetence, and 58 regeneration in sport. New York: Plenum. pp.101–17.
•
preventing underperformance in athletes. Champaign, IL: Human Kinetics. pp.57–77.
•
Kellmann, M., 2002a. Enhancing recovery: Preventing underperformance in athletes. Champaign, IL: Human Kinetics.
•
Kellmann, M., 2002. Underrecovery and overtraining: different concepts: similar impact? In: M. Kellmann, ed. 2002. Enhancing recovery:
preventing underperformance in athletes. Champaign, IL: Human Kinetics. pp.3–24.
•
Kenttἅ, G. and Hassmén, P., 2002. Underrecovery and overtraining: a conceptual model. In: M. Kellmann, ed. 2002. Enhancing recovery:
King, M. and Duffield, R., 2009. The effects of recovery interventions on consecutive days of intermittent sprint exercise. J Strength Cond
Res, 26, pp.1795–1802.
•
Kinugasa, T. and Kilding, A.E., 2009. A comparison of post-match recovery strategies in youth soccer players. J StrengthCondRes, 23(5),
pp.1402–1407.
•
Kiviniemi, A.M., Hautala, A.J., Kinnunen, H. and Tulppo, M.P., 2007. Endurance training guided individually by daily heart rate varia-
bility measurements. European journal of applied physiology, 101(6), pp.743-751.
•
Kiviniemi, A.M., Hautala, A.J., Seppänen, T., Mäkikallio, T.H., Huikuri, H.V. and Tulppo, M.P., 2004. Saturation of high-frequency oscilla-
tions of RR intervals in healthy subjects and patients after acute myocardial infarction during ambulatory conditions. American Journal
of Physiology-Heart and Circulatory Physiology, 287(5), pp.H1921-H1927.
•
Komi, P.V., 2000. Stretch-shortening cycle: a powerful model to study normal and fatigued muscle. Journal of Biomechanics, 33(10),
pp.1197-1206.
•
Kraemer, W.J., Bush, J.A., Wickham, R.B., Denegar, C.R., Gomez, A.L., Gotshalk, L.A., Duncan, N.D., Volek, J.S., Putukian, M. and Sebas-
tianelli, W.J., 2001. Influence of compression therapy on symptoms following soft tissue injury from maximal eccentric exercise. J Orthop
Sport Phys, 31(6), pp.282–290.
•
Kraemer, W.J., Flanagan, S.D., Comstock, B.A., Fragala, M.S., Earp, J.E., Dunn-Lewis, C., Ho, J-Y, Thomas, G.A., Solomon-Hill, G., Pen-
well, Z.R., Powell, M.D., Wolf, M.R., Volek, J.S., Denegar, C.R., and Maresh, C.M., 2010. Effects of a whole body compression garment on
markers of recovery after a heavy resistance workout in men and women. J Strength Cond Res, 24(3), pp.804–814.
•
Krustrup, P., Mohr, M., Steensberg, A., Bencke, J., Kjaer, M. and Bangsbo, J., 2006. Muscle and blood metabolites during a soccer game:
implications for sprint performance. Med Sci Sports Exerc, 38(6), pp.1165–74.
•
Kuipers, H. and Keizer, H.A., 1988a. Overtraining in elite athletes: review and directions for the future. Sports Med, 6(2), pp.79–92.
•
Kuipers, H. and Keizer, H.A., 1988b. Overtraining in elite athletes. Sports Medicine, 6(2), pp.79- 92.
•
Law, R.Y. and Herbert, R.D., 2007. Warm-up reduces delayed onset muscle soreness but cool-down does not: a randomised controlled
trial. Aust J Physiother., 53(2), pp.91-5.
•
Le Meur, Y., Hausswirth C. and Mujika I., 2012. Tapering for competition: A review. Science & Sports, 27, pp.77–87.
•
Leeder, J., Gissane, C., van Someren, K., Gregson, W. and Howatson, G., 2012. Cold water immersion and recovery from strenuous exer-
cise: a meta-analysis. Br J Sports Med, 46(4), pp.233–240.
•
Macrae, B.A., Cotter, J.D. and Laing, R.M., 2011. Compression garments and exercise: garment considerations, physiology and perfor-
mance (Report). Sports Medicine, 41(10), p.815(29).
•
Magalhães, J., Rebelo, A., Oliveira, E., Silva, J. R., Marques, F. and Ascensão, A., 2010. Impact of Loughborough Intermittent Shuttle Test
versus soccer match on physiological, biochemical and neuromuscular parameters. European journal of applied physiology, 108(1),
pp.39-48.
•
Mah, C.D., Mah, K.E., Kezirain, E.J. and Dement, W.C., 2011. The effects of sleep extension on the athletic performance of collegiate
basketball players. Sleep, 34, pp.943–950.
•
Marcora, S.M., Staiano, W. and Manning, V., 2009. Mental fatigue impairs physical performance in humans. Journal of Applied Physio-
logy, 106(3), pp.857-864.
•
Maughan, R.J., and Shirrefs, S.M., 1998. Dehydration, rehydration and exercise in the heat: Concluding remarks. Int. J. sports. Med., 19,
pp.S167-S168.
•
Maughan, R.J., 2006. Alcohol and football. J. Sports Sci., 24, pp.741–748.
•
McConnell, G.K., Costill, D.L., Widrick, J.J., Hickey, M.S., Tanaka, H. and Gastin, P.B., 1993. Reduced training volume and intensity main-
tain aerobic capacity but not performance in distance runners. Int J Sports Med, 14, pp.33–7.
•
McLean, B.D., Coutts, A.J., Kelly, V., McGuigan, M.R. and Cormack, S.J., 2010. Neuromuscular, endocrine, and perceptual fatigue respon-
ses during different length between-match microcycles in professional rugby league players. International journal of sports physiology
and performance, 5(3), p.367.
•
McLellan, C.P., Lovell, D.I. and Gass, G.C., 2011. Markers of postmatch fatigue in professional rugby league players. The Journal of
Strength & Conditioning Research, 25(4), pp.1030-1039.
•
Meeusen, R., Duclos, M., Gleeson, M., Rietjens, G., Steinacker, J. and Urhausen, A., 2006. Prevention, diagnosis and treatment of the over-
training syndrome: ECSS position statement ‘task force’. European Journal of Sport Science, 6(01), pp.1-14.
•
Menzies, P., Menzies, C., McIntyre, L., Paterson P., Wilson, J. and Kemi O.J., 2010. Blood lactate clearance during active recovery after an
intense running bout depends on the intensity of the active recovery. Journal of Sports Sciences, 28(9), pp.975-982.
•
Monedero, J. and Donne, B., 2000. Effect of recovery interventions on lactate removal and subsequent performance. Int. J. Sports Med.,
21, pp.593-597.
•
Mika, A., Mika, P., Fernhall, B. and Unnithan, V.B., 2007. Comparison of recovery strategies on muscle performance after fatiguing exer-
cise. American Journal of Physical Medicine and Rehabilitation, 86, pp.474-481.
•
Mohr, M., Mujika, I., Santisteban, J., Randers, M.B., Bischoff, R., Solano, R., Hewitt, A., Zubillaga, A., Peltola, E. and Krustrup, P., 2010.
Examination of fatigue development in elite soccer in a hot environment: a multi-experimental approach. Scand J Med Sci Sports, 20(3),
pp.125–132.
•
Moir, G., Shastri, P. and Connaboy, C., 2008. Intersession reliability of vertical jump height in women and men. The Journal of Strength
& Conditioning Research, 22(6), pp.1779-1784.
•
Montgomery, P., Pyne, D., Hopkins, W., Dorman, J., Cook, K. and Minahan, C., 2008. The effect of recovery strategies on physical perfor-
mance and cumulative fatigue in competitive basketball. J Sports Sci, 26, pp.1135–1145.
•
Moraska, A., 2007. Therapist education impacts the massage effect on postrace muscle recovery. Med Sci Sports Exerc, 39(1), pp.34–7.
•
Morgan, W.P., Brown, D.R., Raglin, J.S., O’Connor, P.J. and Ellickson, K.A., 1987. Psychological monitoring of overtraining and staleness.
Br J Sports Med, 21(3), pp.107–14.
•
Mourot, L., Bouhaddi, M., Tordi, N., Rouillon, J.D. and Regnard, J., 2004. Short- and long-term effects of a single bout of exercise on
heart rate variability: comparison between constant and interval training exercises. European journal of applied physiology, 92(4-5),
pp.508-517.
•
Mujika, I. and Padilla, S., 2003. Scientific bases for precompetition tapering strategies. Med Sci Sports Exerc, 35(7), pp.1182–7.
•
Mujika, I., 2011. Tapering for triathlon competition. J. Hum. Sport Exerc, 6(2), pp. 264-270.
•
Mujika, I., Goya, A., Padilla, S., Grijalba, A., Gorostiaga, E. and Ibanez, J., 2000. Physiological responses to a 6-d taper in middle-distance
runners: influence of training intensity and volume. Med Sci Sports Exerc, 32(2), pp.511–7.
•
Nédélec, M., McCall, A., Carling, C., Legall, F., Berthoin, S. and Dupont, G., 2012. Recovery in soccer: part I - post-match fatigue and time
course of recovery. Sports Med, 42(12), pp.997-1015.
•
Oda, S., Matsumoto, T., Nakagawa, K. and Moriya, K., 1999. Relaxation effects in humans of underwater exercise of moderate intensity.
Eur. J. Appl. Physiol. Occup. Physio, 80, pp.253–259.
•
Odetoyinbo, K., Wooster, B. and Lane, A., 2009. The effect of a succession of matches on the activity profiles of professional soccer players.
In: T. Reilly and F. Korkusuz, eds. Science and Football VI. London: Routledge.
[email protected] 06 Aug 2018
FITNESS IN SOCCER
Fatigue management
251
•
Olsen, O., Sjøhaug, M., van Beekvelt, M. and Mork, P.J., 2012. The effect of warm-up and cool-down exercise on delayed onset muscle
soreness in the quadriceps muscle: a randomized controlled trial. Journal of Human Kinetics, 35, pp.59-68.
•
O’Brien, K.S., Blackie, J.M. and Hunter, J.A., 2005. Hazardous drinking in elite New Zealand sportspeople. Alcohol and Alcoholism,
40(3), pp.239–241.
•
Peterson, K., 2005. Overtraining: balancing practice and performance. In: S. Murphy, ed. The sport psych handbook. Champaign, IL:
Human Kinetics. pp. 49–70.
•
Piehl, K., 1974. Time Course for Refilling of Glycogen Stores in Human Muscle Fibres Following Exercise-Induced Glycogen Depletion.
Acta Physiologica Scandinavica, 90(2), pp.297–302.
•
Plews, D.J., Laursen, P.B., Kilding, A.E. and Buchheit, M., 2012.Heart rate variability in elite triathletes, is variation in variability the key
to effective training? A case comparison. European journal of applied physiology, 112(11), pp.3729-3741.
•
Plews, D.J., Laursen, P.B., Stanley, J., Kilding, A.E. and Buchheit, M., 2013. Training Adaptation and Heart Rate Variability in Elite End-
urance Athletes: Opening the Door to Effective Monitoring. Sports Medicine, 43, 773–781.
•
Poole, D.C., Musch, T.K. and Kindig, C.A., 1997. In vivo microvascular structural and functional consequences of muscle length changes.
American Journal of Physiology, 272, pp.2107-2114.
•
Poppendieck, W., Faude, O., Wegmann, M. and Meyer, T., 2013. Cooling and Performance Recovery of Trained Athletes: A Meta-Analy-
tical Review. International Journal of Sports Physiology and Performance, 8, pp.227-242.
•
Postolache, T.T. and Oren, D.A., 2005. Bright light: alerting, circadian phase shifting and antidepressant treatment. Clin Sports Med, 24,
pp.381–412.
•
Pumprla, J., Howorka, K., Groves, D., Chester, M. and Nolan, J., 2002. Functional assessment of heart rate variability: physiological basis
and practical applications. International Journal of Cardiology, 84, pp.1-14.
•
Quinn, A.M. and Fallon, B.J., 1999. The changes in psychological characteristics and reactions of elite athletes from injury onset until full
recovery. Journal of Applied Sport Psychology, 11, pp.210-229.
•
Rees, T. and Hardy, L., 2004. Matching social support with stressors: Effects on factors underlying performance in tennis. Psychology of
Sport and Exercise, 5, pp.319-337.
•
Reilly, T., 2005. An ergonomic model of the soccer training process. Journal of Sports Science, 23(6), pp.561-572. Reilly, T. and Rigby, M.,
2002. Effect of an active warm-down following competitive soccer. In: W. Spinks, T. Reilly and A. Murphy, eds. Science and football IV.
London: Routledge. pp.226–229.
•
Reilly, T., 1998. Recovery from strenuous training and matches. Sport Exerc. Inj., 4, pp.156–158.
•
Reilly, T., Drust, B. and Clarke, N., 2008. Muscle fatigue during football match‐play. Sports Med, 38, pp.357‐367.
•
Reilly T. and Ekblom B., 2005. The use of recovery methods post-exercise. J Sports Sci, 23, pp.619–27.
•
Rey, E., Lago‐Peñas, C., Lago‐Ballesteros, J., Casáis, L. and Dellal A., 2010. The effect of a congested fixture period on the activity of elite
soccer players. Biol Sport, 27, pp.181‐185.
•
Rey, E., Lago-Peñas, C., Casáis, L. and Lago-Ballesteros, J., 2012. The effect of immediate post-training active and passive recovery inter-
ventions on anaerobic performance and lower limb flexibility in professional soccer players. Journal of Human Kinetics, 31, pp.121-9.
•
Rey, E., Lago-Peñas, C., Lago-Ballesteros, J. and Casáis, L., 2012, The effect of recovery strategies on contractile properties using ten-
siomyography and perceived muscle soreness in professional soccer players. Journal of Strength and Conditioning Research, 26(11),
pp.3081-8.
•
Samuels, C., 2008. Sleep, recovery, and performance: The new frontier in high-performance athletics. Neurologic Clinics, 26, pp.169–180.
•
Sartor, F. Vailati, E., Valsecchi, V., Vailati, F. and La Torre, A., 2013. Heart rate variability reflects training load and psychophysiological
status in young elite gymnasts. Journal of Strength & Conditioning Research, Published ahead of print.
•
Schwane, J.A., Johnson, S.R., Vandenakker, C.B., 1983. Delayed onset muscle soreness and plasma creatine kinase phosphate and LDH
activities after downhill running. Med Sci Sports Exerc, 15, pp.51-56.
•
Shirreffs, S.M. and Sawka, M.N., 2011. Fluid and electrolyte needs for training, competition, and recovery. Journal of Sports Sciences,
29(sup1), pp.S39-S46.
•
Skein, M., Duffield, R., Minett, G. M., Snape, A., and Murphy, A., 2013. The Effect of Overnight Sleep Deprivation Following Competitive
Rugby League Matches on Post-Match Physiological and Perceptual Recovery. Int. J. Sports Physiol. Perform., [Epub ahead of print].
•
Siff, M.C. and Verkhoshansky, Y.V., 1999. Supertraining. 4th ed. Denver, CO: Supertraining International.
•
Signorile, J.F., Ingalls, C. and Tremblay, L.M., 1993. The effects of active and passive recovery on short-term, high intensity power output.
Can J Appl Physiol, 18(1), pp.31–42.
•
Spencer, M., Bishop, D., Dawson, B., Goodman, C. and Duffield, R., 2006. Metabolism and performance in repeated cycle sprints: active
versus passive recovery. Med Sci Sports Exerc, 38(8), pp.1492–9.
•
Steinacker, J.M. and Lehmann, M., 2002. Clinical findings and mechanisms of stress and recovery in athletes. In: Kellmann, M., ed. Enhan-
cing recovery: preventing underperformance in athletes. Champaign, IL: Human Kinetics. pp.103-18.
•
Suzuki, M., Umeda, T., Nakaji, S., Shimoyama, T., Mashiko, T. and Sugawara, K., 2004. Effect of incorporating low intensity exercise into
the recovery period after a rugby match. Br. J. Sports Med., 38, pp.436–440.
•
Taylor, K., Hopkins, W., Chapman, D.W., Cronin, J.B., Newton, M.J., Cormack, S. and Gill, N., 2012. Monitoring neuromuscular fatigue
using vertical jumps. International Journal of Sports Medicine (in review).
•
Tessitore, A., Meeusen, R., Cortis, C. and Capranica, L., 2007. Effects of different recovery interventions on anaerobic performances follo-
wing preseason soccer training. J. Strength Cond. Res., 21(3), pp.745–750.
•
Twist, C., Waldron, M., Highton, J., Burt, D. and Daniels, M., 2012. Neuromuscular, biochemical and perceptual post-match fatigue in
professional rugby league forwards and backs. Journal of sports sciences, 30(4), pp.359-367.
•
Twist, C. and Eston, R.G., 2009. The effect of exercise-induced muscle damage on perceived exertion and cycling endurance performance.
European Journal of Applied Physiology, 105, pp.559–567.
•
Urhausen, A. and Kindermann, W., 2002. Diagnosis of overtraining. Sports medicine, 32(2), pp.95-102.
•
Venter, R.E., 2012. Perceptions of team athletes on the importance of recovery modalities. European Journal of Sport Science, pp.1-8.
•
Wegmann, M., Faude, O., Poppendieck, W., Hecksteden, A., Frohlich, M. and Meyer, T. 2012. Pre-cooling and sports performance: a
meta-analytical review. Sports Med., 42(7), pp.545– 564.
•
Weiss, S.K., 2006. Better Sleep for Your Baby & Child. Toronto: Robert Rose Inc.
•
Wessel, J, and Wan, A. 1994. Effect of stretching on the intensity of delayed-onset muscle soreness. Clinical Journal of Sport Medicine,
4, pp.83-87.
•
Wilcock I.M., Cronin, J.B. and Hing, A.H., 2006. Physiological response to water immersion. Journal of Sports Medicine, 36(9), pp.747-
765. Young, W., Hawken, M. and McDonald, L., 1996. Relationship between Speed and Agility and Strength Qualities in Australian Rules
football. Strength & Conditioning Coach, 4(4), pp.3-6.
•
Zatsiorsky, V.M., 1995. Science and practice of strength training. Champaign, IL: Human Kinetics.
[email protected] 06 Aug 2018
FITNESS IN SOCCER
252
I Fatigue management
[email protected] 06 Aug 2018
FITNESS IN SOCCER
Periodization in soccer
253
14
PERIODIZATION IN SOCCER
Jan Van Winckel, Kenny McMillan, Carlo Buzzichelli, David Tenney, Paul Bradley
Periodization is a planned/programmed distribution or variation in training
methods and means on a cyclic or periodic basis. As highlighted in the previous
chapter, an important aim of periodization in elite soccer is fatigue management.
Periodization for soccer entails organizing the season in a structured manner to
ensure the level of performance is kept as consistently high as possible (perfor-
mance stabilization) throughout the season. To achieve this, periods of loading,
unloading (recovery), and tapering (for the most important competition(s) of the
year) have to be sensibly arranged. Periodization refers to the planned alternation
of loading and unloading (fatigue management), the structured sequence of which
physical ability (i.e., strength, speed, endurance) to develop, and the division of the
annual plan into distinct periods.
14.1 HISTORY OF PERIODIZATION
The Ancient Greeks used very elementary plans to prepare for the Olympic Games.
The legendary Milo of Croton (6th Century BC), winner of six Olympic Games, was
one of the first to use a primitive form of periodization by varying his training load
during his training program. Milo began his training most days by lifting a calf,
and as the animal grew bigger, the lifting load increased, consequently improving
his performance. At the end of his training process, he was able to carry the animal
around the Olympic stadium. Galen (129–200 AD) was a Roman physician, surgeon
and philosopher (Nutton, 1973). At the age of 28, he returned to Pergamon in Italy
as a physician to the gladiators and became one of the first to write about periodi-
zation. He believed that various types of exercise needed to be blended in order to
improve performance. He divided exercises into three categories: without “hostile”
movement, such as weightlifting; quick exercises, such as ball games; and exercises
with a “hostile” nature, which we now refer to as plyometric exercises. It was not
until the run-up to the Olympic Games in Helsinki (1952) that the experience of the
Russian coaches became the impetus for the methodological principles of training
systems. Researchers emphasized that the competition schedule had to be integra-
[email protected] 06 Aug 2018
FITNESS IN SOCCER
Periodization in soccer
254
ted into the overall system and that “active rest” was very important. The former
Eastern Bloc, especially the Soviet Union, believed in a multi-year development
preparation period, and the coaches there delayed the specialization phase of the
sport for longer. This was in contrast to Western coaches who implemented speci-
alization much earlier and without any thorough multilateral development. In the
Soviet Union, as well as in other Eastern Bloc countries, a clear sports program exi-
sted to train children from elementary school level up to the elite level. In this way,
they monitored and controlled all the factors. Dr. Verkhoshansky himself went so
far as to say that periodization was based on the principles of communism. In the
West, it was impossible to adopt the same training approach, because the culture
did not permit such a thing. East Germany could obviously not be left behind, and
in 1956, the German High School for Physical Culture was established in Leipzig.
With the Cold War as the catalyst, sport became the flagship of various countries.
State support was more the rule than the exception. However, the medal also had
a darker side. “Sport for all” was an empty concept, because East Germany selec-
ted children at a young age and only invested in the very strongest. Two distinct
trends then emerged from 1970 onwards: The West invested time and energy in the
different areas of sport—such as school sports, health and rehabilitation—while in
the East, the emphasis continued to be focused on the elite. It was in this race for
better performances that periodization models surfaced. In the 1970s, many scien-
tists, mainly Eastern European, published a large number of important works on
periodization and the training process, such as Arosiev and Kalinin (1971), Djat-
schkov (1974), Zatsiorsky (1972), Matvejev (1974, 1981), Kusnezov (1972), Harre
(1974), Vorobiev (1974) and Tschiene (1977). Matvejev, the father of periodization
(1964), has not always received the recognition he deserves. Vice-President of Sport
Kolessov stated in 1991 (Sovietsky sport, 1991) that the “outdated” system of Pro-
fessor Matvejev should not be pursued anymore.
The origins of soccer science lie in
the former Soviet Union. The Rus-
sians were the first to practice soc-
cer science in a structured way,
with Valeriy Lobanovskyi playing
an important role in developing
the knowledge and know-how and
intertwining soccer and sport sci-
ence. Lobanovskyi used statistics
and data as a means of gaining com-
petitive advantage in sport more
than two decades before the foun-
dation of specialized companies
such as TopSportsLab®, Amisco, and
ProZone. Lobanovskyi started as
the coach of Dneproprtovsk (1969–
1973), recruiting Anatoly Zelent-
sov, a statistician who was at the
time the Dean of the Dneproprtovsk
Institute of Physical Science. Soccer
became for them a system of 22 ele-
[email protected] 06 Aug 2018
FITNESS IN SOCCER
Periodization in soccer
255
ments (two sub-systems of 11 elements) moving within a defined area (the pitch)
and depending on a series of restrictions (the laws of the game). They had the play-
ers perform tests and then analyzed the results via a computer. Lobanovskyi even
went so far as to let Zelentsov and his computer system make the selection for the
European Championships in 1988. The coach, who died in 2002, surprised friend
and foe alike by playing scientific “total football” with Dynamo Kyiv (1984–1990)
long before Rinus Michels embodied “total” football in the Netherlands. He created
a system that evaluated every action in a match. A group of scientists noted each
successful and unsuccessful action relating to passes, tackles, shots and dribbles.
These data were then analyzed by a computer, enabling each player to be evaluated
for “intensity, activity, error rate and effectiveness.”
14.2 TYPES OF PERIODIZATION
Periodization improves performance through various mechanisms:
1. A planned, progressive overload favoring positive morpho-functional adaptati-
ons through planned alternation of loading and unloading
2. Avoiding reaching critical levels of fatigue and overtraining (Morton, 1997)
3. Tapering at the right moment to reach peak condition
14.3 SEASON PLANNING
There are different ways of preparing players for a game or season. There is the “ad
hoc” approach (deciding from day to day), the intuitive approach (based on the
“best practice” of the coach), and structured periodization. There are definite gaps
in the current knowledge because periodization theory is based largely on empiri-
cal evidence, related research (e.g., overtraining), and a few mesocycle-length vari-
ation studies. Most of these involved experimental periods no longer than two to
three months and/or subjects with limited training experience, whereas no actual
multiple mesocycle or integrated studies (e.g., combined strength/power and
speed/endurance training) on advanced athletes have been published in English
(Plisk and Stone, 2003). Moreover, most of the scientific research published is in
the domain of strength training, and it is not easy to translate these findings to
team sport settings. For example, training parameters such as volume and intensity
in strength training are completely different compared to training parameters in
soccer. We have compiled a classification system below that should enable soccer
coaches to better understand the mechanisms of periodization. This format, which
has not been used anywhere else, attempts to a reach a consensus with regard to
the terms used in the research literature. We have deliberately used all the terms
used in publications in order to make it easier to find more information via search
engines and/or publications.
[email protected] 06 Aug 2018
FITNESS IN SOCCER
Periodization in soccer
256
14.3.1 Season-planning components
Periodization can be considered a process of structuring training into phases to
maximize athletes’ chances of achieving peak performance and therefore their
competitive goals (Bompa, 1999). Accordingly, periodized training programs are
typically structured into macrocycles, mesocycles, and microcycles that progress
from extensive to intensive workloads, as well as from general to special tasks
(Plisk and Stone, 2003). Before discussing the types of periodization, we first give
an overview of the yearly planning components below. There is a chance you will
find other definitions in the literature, but those used here are the most widely sup-
ported and accepted.
1. Multi-year plan or megacycle. For athletes, this is often a four-year (or Olym-
pic) cycle. In soccer, this cycle is used for younger players in academies, where
long-term objectives can be set using models such as the Long-Term Athlete
Development (LTAD) model designed by Dr. Balyi (Ford et al., 2011).
2. Annual plan (Bompa)/Annual Macrocycle (Soviets). According to most
models, the annual plan comprises three macrocycles: the preparation phase,
the competition phase, and the transition phase. The preparation phase is nor-
mally divided up again into general and specific preparation, and the competi-
tion phase is split into a pre-phase and a competition phase.
3. Phase (Bompa)/Macrocycle (Soviets). The term “macro” comes from the Greek
word “makros,” meaning “big.” The term “cycle” refers to something that is
constantly repeated. It defines the general direction of the training process in a
certain period (general or specific preparatory, pre-competitive or competitive,
transitory).
4. Macrocycle (Bompa)/Mesocycle (Soviets). A macrocycle (Bompa) or mesocy-
cle (soviets) is a period of 2–5 weeks that specifies the direction of the training
process for each of its components (i.e., physical strength, speed, endurance,
and technical/tactical). In this timeframe, one to three loading microcycles are
followed by one or two unloading microcycles (thus reducing intensity and/or
volume, but usually just volume). It is particularly during these periods of redu-
ced load that progress can fully manifest itself.
5. Microcycle (from match to match or week to week). The term “micro” comes
from the Greek word “mikros,” meaning small. This microcycle runs from
match to match in most cases, although it can be longer in the preparation phase
and shorter in the competition period.
6. Daily planning:
• Warm up
• Central section
• Rehabilitation and progression training
• Cooling down
In this book, we use the terms macrocycle (for preseason, in-season, off-season,
etc.), mesocycle (2–5 weeks in length) and microcycle (from match to match).
[email protected] 06 Aug 2018
FITNESS IN SOCCER
Periodization in soccer
257
14.4 TYPES OF PERIODIZATION
In this section, we will see how different periodization models can be distinguis-
hed. We do this on the basis of four types of classifications:
1. Volume and Intensity
Periodization models that vary intensity and volume.
2. Physical abilities
Models that vary the basic characteristics (physical abilities) of the sport being
trained (e.g., aerobic fitness, speed, etc.).
3. Workload
Models that vary in workload.
4. Integrated
Multidisciplinary models.
Fig. 14.1: Overview of the different phases of a periodization model.
[email protected] 06 Aug 2018
FITNESS IN SOCCER
Periodization in soccer
258
14.5 PERIODIZATION MODELS: INTENSITY AND VOLUME
The basic concept of a trade-off between intensity and volume seems pretty ele-
mentary, but it has important ramifications because the interaction of these varia-
bles drives many of the decisions made when designing training programs (Plisk
and Stone, 2003). Most scientific research only distinguishes between the variation
in volume and intensity. Volume can be defined as the total duration of the training,
as well as the number of sets and repetitions in strength training or the number of
kilometers in a cycling race. Correspondingly, the intensity could be the running
or cycling speed, for example, or the one-repetition maximum (1RM) percentage in
strength training.
14.5.1 Linear models
14.5.1.1 Linear periodization and single, double and triple models
Leonid Metveyev, a Russian sports scientist, presented a model in which the annual
macrocycle begins with a high volume of low-intensity training. The Metveyev
model and the Western spin-offs have the characteristic of intensity and volume
working in inverse proportion.
Fig. 14.2: Example of linear periodization in which the volume decreases and the intensity increases
This model is particularly suitable for novice athletes. The body easily absorbs the
load because of the high volume and low intensity in the initial phase.
The main criticisms of this model are:
• General preparation is too voluminous and general, thus making the athlete
detrain his specific physical abilities.
• Preparation phase is too long for today’s professional team sports, which have
short preparation phases and long competitive phases.
• Progression is too linear. This, in fact, is not a substantiated criticism because
from the chart, it is impossible to depict what happens at the level of the micro-
cycles and mesocycles, which can, and should, have alternations of loads.
• Unlike individual Olympic sports, team sports usually do not require an ulti-
mate peak at the end of the season.
[email protected] 06 Aug 2018
FITNESS IN SOCCER
Periodization in soccer
259
This brings us to the final problem: The model implies that peaking will occur at
the end of the season. Team sports like soccer do not require a peak in performance.
This could possibly be handled by using a multi-peak approach (Bompa, 1984;
Wilks, 1995; Fleck and Kraemer, 1997). For example, an athlete can peak in the 60m
indoor event in the winter and in the 100m sprint in the summer season. Research
has shown that bi- and tri-cycle models have a greater impact than a model with
a single peak. From this, Poliquin (1997) concluded that it was the variation of
the multi-peak models that was responsible for the greater progress. Bompa (1983)
and Tschiene (1977) recommended periodization of this kind mainly for sportsmen
who have two or more periods of competition per year, followed by so-called tran-
sitory phases (Bompa) or prophylactic intervals (Tschiene). These are short periods
of relative rest, during which the body can recover well, injuries can heal, and moti-
vation can also be regained.
14.5.1.2 Reverse linear
Reverse linear periodization follows the modification in intensity and volume but
in a reverse order to linear periodization models, increasing volume and redu-
cing intensity (Rhea et al., 2003). Reverse linear periodization methods are some-
times used in sports where aerobic endurance is important (e.g., cycle racing and
triathlons).
14.5.2 Non-linear, undulating and daily undulating models
In a non-linear periodization training model, intensity and volume are changed
much more frequently compared to linear models (Kraemer and Fleck, 2007; Fleck,
2011).
14.5.2.1 Undulating
The undulating method makes use of alternating phases of intensity and volume
within the microcycle, mesocycle or macrocycle. At the microcycle level, this can
be achieved by alternating intensities (and energy systems) day by day (e.g., light-
heavy-light-medium or heavy-medium-light). At the mesocycle level, it can be
achieved by either alternating the average load of each microcycle (e.g., heavy-
light-medium-light) or by including an unloading microcycle at the end of the
mesocycle. At the macrocycle level, it can be achieved by alternating different qua-
lities of the same physical ability (e.g., strength-power-strength-power).
Several studies have concluded that these undulating periodization models pro-
duce significantly better results than non-periodized or strictly linear models (Fry
et al., 1992; Stone et al., 1999; Zatsiorsky, 1995).
14.5.2.2 Daily undulating model (DUP)
The daily undulating periodization (DUP) consists of increasing and decreasing
intensity and volume on a daily basis, and it is often planned according to the ath-
lete’s feedback. The variation of training components is more frequent and lasts for
shorter periods (Fleck, 1999).
[email protected] 06 Aug 2018
FITNESS IN SOCCER
Periodization in soccer
260
14.6 PERIODIZATION MODELS: PHYSICAL ABILITIES
The following models differ from each other in the way in which different physi-
cal abilities (e.g., aerobic, endurance, speed) are trained. In general, three different
methods can be distinguished:
1. Unidirectional or sequential method.
2. Parallel, concurrent or intermediary method.
3. Combined model.
14.6.1 Unidirectional, block or sequential method
The sequential method is characterized by a phased unidirectional approach for
each physical component. This method is especially applied to the mesocycle, with
each physical ability, such as speed, being trained separately within a certain period.
Fig. 14.3: Example of
sequential periodization
Examples of the sequential method for the various physical abilities:
- Strength:
1. Preparation:
a. Anatomical Adaptation
b. Hypertrophy
c. Maximum strength
d. Specific Strength
2. Season: Retaining and maintenance of load
- Endurance:
1. Preparation
a. Aerobic endurance
b. Mix of aerobic and specific endurance
c. Specific endurance
2. Season: Specific endurance
-
Speed:
1. Preparation
a. Aerobic endurance
b. Anaerobic endurance
c. Alactic speed (without accumulation of lactate)
d. Specific speed
2. Season: Specific speed
[email protected] 06 Aug 2018
FITNESS IN SOCCER
Periodization in soccer
261
The sequential development of a physical ability can be integrated with the sequen-
tial developments of other abilities. For example, all of the abilities labelled “a”
above could be trained simultaneously (Bompa, 1983) in a “complex” or “concur-
rent” plan, or they could be separated into “blocks.” A concentrated block usually
separates strength development from speed or endurance. Concentrated block trai-
ning results in a long-term delayed training effect (LDTE) of 4–12 weeks, usually
peaking after a duration equal to the block’s duration. The advantage of this system
is that no other aspects are trained, thus avoiding additional strain on the body and
making it easier to train one particular component in overload. This is often found
among advanced athletes because of a great deal of the training load being applied
to one single aspect. The model proceeds from the principle that residual training
effects remain, and these can be built on in the next mesocycle. In this way, more
stable progress can be made with long-term effects. Since block training is often
associated with injuries resulting from sudden transitions between two phases, less
sharply delineated periodizations are often recommended.
14.6.2 Parallel, concurrent or intermediary method
The concurrent model is used to train different physical abilities (e.g., endurance,
strength and speed) during the same phase in order to promote multilateral deve-
lopment. This fits into the macrocycle, the mesocycle or even the microcycle. The
concurrent model makes it possible to place emphasis on a particular factor, such as
by increasing the load for a particular component. This type of periodization may
create a synergistic effect, allowing one skill to strengthen another during buildup.
Fig. 14.4: Example of
concurrent periodization in
a preparation phase. Each
physical ability is trained
together.
When using this model, it is important to assess the interaction of the different
abilities. The interaction between different physical abilities is referred to as the
“interference phenomenon” (Docherty and Sporer, 2000). This phenomenon occurs
when adjustments resulting from training compete with other specific adaptati-
ons. Strength training, for example, has a profound negative influence on muscle
mitochondria, which are essential for endurance (MacDougall et al., 1979). Howe-
ver, if the interference phenomenon is accounted for, these physical abilities can be
trained perfectly well in the same cycle, especially since soccer players normally
don’t need to fully maximize a single aspect. A soccer player must therefore try to
[email protected] 06 Aug 2018
FITNESS IN SOCCER
Periodization in soccer
262
maintain a certain level in all physical abilities and improve on the specific require-
ments of their positions (e.g., acceleration for a winger).
A great deal of research has been conducted over the last decades into the influence
of strength training on aerobic training and vice versa. It is obvious that the two
types of training will interfere with each other because of the body wanting to
constantly adapt to the load (Dudley and Djamil, 1985; Chromiac and Mulvaney,
1990). Several studies have shown that concurrent training can induce subopti-
mal strength and/or endurance adaptations (Gergley, 2009; Glowacki et al., 2004).
If both types of load are being trained, the body’s adaptive capability is disrup-
ted. The challenge in practice is to integrate strength and endurance training so
they both enhance, rather than interfere with, each another. There is little infor-
mation regarding soccer-specific concurrent training and the effects of training
order. Recent research in soccer (McGawley and Andersson, 2013) found a positive
effect of the concurrent training approach on key measures of soccer performance,
but the order of completing high-intensity, run-based training and strength- and
power-based training appears inconsequential to performance adaptations.
14.6.3 Periodization models: Combined model
The aim of the combined model is to combine the benefi of the two previous models,
namely the unidirectional approach of the sequential method and the advantages of
block training. This system trains the diff ent physical abilities in the mesocycle and
a primary or secondary objective in the microcycle. The player thus adapts physio-
logically (functional over-reaching) to a specifi ability, while the other parameters
will be maintained (retaining load). This can prevent stagnation, over-training and
fatigue.
Zatsiorsky emphasizes that this model has the advantages of the cumulative results
of training while accentuating the specifi training eff of the “loading” of a spe-
cifi quality. This ensures greater improvement in performance. The positive accu-
mulation of these training eff results in a more unidirectional increase in work
capacity.
Fig. 14.5: In this model, a specific ability is trained each week, while the other systems are maintained.
In simple terms, the combined model is a model in which one specific quality (e.g.,
speed, endurance, etc.) is trained as the primary objective, while all the other qua-
[email protected] 06 Aug 2018
FITNESS IN SOCCER
Periodization in soccer
263
lities are maintained. The player will then make progress on one aspect, with the
others remaining at the same level. This training model therefore not only combi-
nes all the physical abilities within a particular stage; it also ensures progress in a
particular quality at the same time.
14.7 WORKLOAD
Athird classification of periodization is made based on the distribution of workload.
14.7.1 Stepwise loading
This type of periodization increases the training load in each microcycle and decre-
ases the load in the final microcycle. In this final phase, the body converts the work-
load into progression (supercompensation).
14.7.2 Reverse step loading
In this method, the training load is reduced in each microcycle.
14.7.3 Flat step loading
In this model, a high training load is set for all aspects during a specific period. The
training load is then reduced to allow supercompensation to take effect. The flat
step loading model should not be used for mesocycles longer than three weeks (i.e.,
two loading microcycles and one unloading microcycle, or 2+1 or 2:1).
[email protected] 06 Aug 2018
FITNESS IN SOCCER
Periodization in soccer
264
14.7.4 Pyramid loading
The training load is increased to a maximum and subsequently reduced again.
14.8 Integrated
There are also periodization models that pay attention to all the components of
sport training simultaneously.
14.8.1 Technical
Matvejev was the first scientist to incorporate the technical component into the
periodization model. The skill-strength periodization model (SSP) was mainly
used in the Soviet Union. The model proceeds from the principle that the technical
component has to be trained first and followed by the strength component.
14.8.2 Psychological
Balague (2000) is one of the few scientists to devote attention to the integration of
the psychological/mental aspect. She developed a model in which psychological
preparation goes hand in hand with physical development during different trai-
ning cycles.
14.8.3 Tactical periodization
One of the best examples of synchronization between tactical and physical perio-
dization is the work of José Mourinho. He coordinates the two disciplines during
the year and programs his exercises in such a way that the players train the tactical
principles while also pursuing physical periodization at the same time. We will
elaborate further on this in Chapter 15.
[email protected] 06 Aug 2018
FITNESS IN SOCCER
Periodization in soccer
265
14.9 TYPES OF MICROCYCLES
In the literature, many terms are used to label the different microcycles. Below we
set out the terms used in the literature and the way they are distinguished.
Terms used in literature
Load levels
Adjustment, rebuilding, initializing
Low to medium load, gradual increase in workload and
intensity
Restoration, regeneration
Low load (low intensity, duration, frequency); physical and
mental recovery
Loading, building, developmental
Progressively higher volume and/or intensity
Impact, shock
Extreme workloads (Sleamaker, 1989). These
microcycles could cause many injuries because of an
unaccustomed level of intensity and/or volume. Scholastic
heritage of the Eastern Europe training theory with little
practical application.
Tapering, pre-competitive, tuning,
peaking, unloading
Low load, high intensity
Maintenance, competitive
Medium load with emphasis on event-specific
performances
14.11 PERIODIZATION IN SOCCER
Applying periodized planning to team sports poses unique challenges due to the
variety of training goals, volume of concurrent training and practices, and extended
competition season (Gamble, 2006). Planning must attempt to prepare players to
peak for a match every week for the entire season. In elite soccer, peaking for every
match is not possible. Matvejev wrote back in 1977 that periodization is not just a
simple plan but rather a set of laws or basic principles that accompany the training
process. Bompa (1983) stated that periodization is the process of dividing the sea-
son into smaller parts, with the objective of achieving the best performances during
the most important phases of the season. According to Plisk (2004), periodization
is a programmed variation of training content and training methods on a cyclical
basis. Kraemer (2004) added that, in addition to variation, periodization must also
consist of programmed recovery periods to boost recovery and bring the athlete
(player) back to his present potential. Periodization is a term that is often used
indiscriminately. It is difficult, if not impossible, to examine periodization models
in high-level soccer and map out their effects. The model described below is the-
refore based on scientific research and brings together different aspects that can
be found in the scientific literature. This is done on the basis of several strategies.
When we use the term “periodization” in this book, we refer to the different fati-
gue-management strategies that can be applied when planning the season. Periodi-
zation in soccer is therefore the strategic planning of fatigue management.
[email protected] 06 Aug 2018
FITNESS IN SOCCER
Periodization in soccer
266
• Formulate objec/ves and ambi/ons
• Divide the season into different
phases (macrocycles, mesocycles,…)
• Plan the periodisa/on based on the
expected status of the players
14.11.1 Integrated periodization
Physical periodization must be synchronized with all the other aspects of soccer.
We refer to this as an integrated approach.
Good planning takes account of the following periodization components:
• Technical periodization
• Tactical periodization
• Physical periodization
• Psychological periodization
• Communication and team building
The main focus of training will be different in any sport. In soccer, however, one
component cannot be separated from another. Periodization can therefore best be
defined as a logical, phased method of organizing training variables for the pur-
pose of raising the technical, tactical, physiological and psychological potential of a
player in order to reach specific objectives.
14.11.2 Different phases of drawing up a season plan
Before we start with discussing periodization strategies specific to soccer, let us first
give an outline of the method that will be applied:
1. Formulate objectives and ambitions.
2. Divide the season into manageable phases.
• Setting up the first draft of the season plan
• Assessing the current situation
• Adjust goals and ambitions.
3. Conduct a strength-weakness analysis of the group and the individual.
4. Adjust the training objectives in the mesocycle for the group and the individual.
5. Differentiate and individualize periodization.
•
Formulate objec/ves and ambi/ons
Off-season
• Divide the season into different
phases (macrocycles, mesocycles,…)
• Plan the periodiza/on based on the
expected status of the players
Differen/a/on
and
individualisa/on
Evalua/on of the
actual situa/on
Before the start of each
mesocycle
Adjust training
objec/ves and
the mesocycle
Adjust objec/ves
and ambi/ons
Strength-
weakness
assessment
Fig. 14.9: Layout of a periodization plan during the season
[email protected] 06 Aug 2018
FITNESS IN SOCCER
Periodization in soccer
267
✓ Formulate objectives and ambitions
Objectives and ambitions are set before preparation begins. These goals are agreed
upon by everyone in the club (i.e., players, staff and management). There is a diffe-
rence between an objective and an ambition. An objective could be, for example, to
secure fourth place, qualify for the Europa League, or promote two youngsters into
the first team. An ambition could then be, for example, to play attractive soccer or
compete for the title. It is important for objectives and ambitions to be shared by
everyone and recorded in a document that is communicated externally. This ensu-
res that no false expectations are created.
Season 2014-2015
Objective
Method
Ranking
Reaching the final stage of the
European League
Tapering before champions league
games
Fourth place in the domestic
league
Performance stabilization and daily
work on physical, tactical, mental
and technical periodization
Attack
Average of two goals per
match
Repetition of offensive tactics,
maximizing number of players in
the box
Defense
Less than one goal per match
Daily work on defensive tactical
rules
Home results
More than 15 wins at home
Respect for game philosophy,
knowledge of team tactics
Away results
More than 8 wins
Knowledge of the opponent
1st half of the season
40 points
Rebuilding of fitness in preseason
and respecting tactical periodization
during in-season
2nd half of the season
Performance stabilization
Training camp during the mid-
season break
Table 14.1: Collective objectives
[email protected] 06 Aug 2018
Defense
Season 2013-2014
Season 2014-2015
Matches
Wins
Losses
Goals
against
Clean
sheets
Objectives
Goalkeeper
15
8
4
15
6
1. Average of less than one goal per match
2. 12 matches with a clean sheet
3. Improve time on agility T-test by 0.1s
4. Improve speed over 10m from 1.86s to 1.83 s
Central
defender
21
10
4
22
8
1. Average of less than one goal per match
2. 15 matches with a clean sheet
3. Improve counter movement jump from 47 to 49 cm
Table 14.2: Individual objectives for defensive line
Attack
Season 2013-2014
2014-2015
Games
played
Wins
Losses
Goals
Assist
Objectives
Team
Player
team
Player
Striker
29
16
4
44
16
41
6
1. One goal for every two games
played
2. Average of two goals scored
per game as a team
3. Give 10 assists
4. Improve speed over 10m from
1.81 to 1.78; Improve heading
through individual training
Table 14.3: Individual objectives for offensive line
F
IT
N
E
SS
IN
S
O
C
C
E
R
Pe
rio
d
iz
a
tio
n
in
s
o
cce
r
26
8
[email protected] 06 Aug 2018
FITNESS IN SOCCER
Periodization in soccer
269
✓ Divide the season into manageable phases.
When dividing up the season, account has to be taken of:
• Competition schedule. It goes without saying that the competition schedule
determines the periodization structure. There are, in general, five or six peri-
ods (macrocycles) in a soccer season:
- Preseason
- First half of the in-season
- Mid-season
- Second half of the in-season
- Play-offs
- Off-season
• Competition formula. A competition formula determines the amount of interest
that can be devoted to particular mesocycles. For example, a play-off formula
or group phase in a cup or European competition will influence the way the
season is planned.
• Availability of training facilities. The availability of practice pitches or fitness
rooms is important when planning and preparing for periodization, especially
for youth teams.
• Availability of players. Factors such as school, work, and playing with the nati-
onal team also need to be taken into consideration.
• Training camps. Planning a training camp is an important decision. The sudden
increase in load can cause overload injuries. The ideal time to plan a training
camp is in the third week of preseason and during the mid-season break.
• Climate. Weather conditions like cold, heat and humidity can influence the
training plan.
• Opponents. During in-season, the microcycles are planned according to the
matches. The strength of an opponent can influence the structure of the
microcycle.
The season is subsequently organized into macrocycles, mesocycles and microcycles.
✓ Setting up the first draft of the season plan
After structuring the season into manageable periods, the content of the various
cycles is determined based on the expected status (i.e., physical, tactical, technical
and mental) of the players.
✓ Assessing the current situation
This step is repeated before the start of each mesocycle. Time should be spent eva-
luating the previous mesocycle and planning the next one. This is done based on
the following analysis:
• Schedule: What games are to be played? How many days are there between
matches?
• Tests and questionnaires: Tests can be included during the season (e.g., HR test,
4’ test, submaximal Yo-Yo test) to monitor how the players’ fitness levels are
developing (actual value).
• Opponents: Who are the opponents in the coming weeks?
• Injuries and availability of players: Injuries can affect the planning of a mesocycle.
[email protected] 06 Aug 2018
FITNESS IN SOCCER
Periodization in soccer
270
✓ Adjusting objectives and ambitions
Based on the preceding analysis, the objectives and ambitions are adjusted for both
individuals and the group.
✓ Conducting a strength-weakness analysis of the group and individuals
Strength-weakness assessments, which must be performed as part of any strate-
gic planning process, are made for the team and each player. Based on this analy-
sis, a personal development plan is drawn up for each player and adapted where
necessary.
✓ Adjusting the training objectives and methods in the mesocycle for the group
Training objectives and methods are adapted based on the current situation.
✓ Differentiation and individual periodization
The new mesocycle is adapted to individuals. The training plan is planned in
advance, but individual periodization strategies are adjusted as necessary based on
evaluations by the staff, as well as performance feedback from the athletes regar-
ding perceived fatigue.
SUMMARY
Periodization is a planned variation in training methods on a cyclic or periodic
basis. The soccer season should be periodized in such a way that allows fati-
gue levels to be attenuated appropriately and ensures that team performance is
stabilized across the competitive season at as high a level as possible. In order
to achieve these aims, periods of loading, recovery, and tapering have to be sen-
sibly arranged. Due to the congested fixture list in elite soccer, there is very lit-
tle time for soccer players to train between games, as many training sessions
are aimed at either recovering from match play or tapering in preparation for
the next match. Therefore, it is time efficient if players train tactical principles
while maintaining/improving their physical condition or even during recovery
and tapering sessions. This concept of tactical periodization is discussed in more
detail in the next chapter.
[email protected] 06 Aug 2018
FITNESS IN SOCCER
Periodization in soccer
271
REFERENCES
•
Aagaard, P. and Andersen, J.L., 2010. Effects of strength training on endurance capacity in top-level endurance athletes. Scand J Med Sci
Sports, 20(Suppl. 2), pp.39-47.
•
Ahtiainen, J.P., Hulmi, J.J., Kraemer, W.J., Lehti, M., Pakarinen, A., Mero, A.A., Karavirta, L., Sillan- paa, E., Selanne, H., Alen, M., Komu-
lainen, J., Kovanen, V., Nyman, K. and Häkkinen, K., 2009. Strength, endurance or combined training elicit diverse skeletal muscle
myosin heavy chain isoform proportion but unaltered androgen receptor concentration in men. Int J Sports Med, 30(12), pp.879-887.
•
such as Arosiev and Kalinin (1971),
•
Astrand, P.O. and Rodahl, K., 1970. Textbook of work physiology. New York: McGraw-Hill.
•
Baker, D., 1993. Periodisation of Strength Training for Sports: A review. Strength and Conditioning Coach Journal, 1(3), pp.15–21.
•
Baker, D., 1998. Applying the in-season periodization of strength and power training to football. NSCA Journal, 20(2), pp.18-27.
•
Balague, G., 2000. Periodisation of psychological skills training. Journal of Science and Medicine in Sport, 3(3), pp.230–237.
•
Bompa, T.O. and Carrera, M.C., 2008. Peak conditioning for volleyball. In: J.C. Reeser and R. Bahr, eds. Handbook of sports medicine and
science: volleyball. London: Blackwell Science.
•
Bompa, T., 1984. Theory and methodology of training. The key to athletic performance. Boca Raton, FL: Kendall/Hunt.
•
Bompa, T.O., 1983. Theory and Methodology of Training. Dubuque, Iowa: Kendall Hunt Publishing Co.
•
Bondarchuk, A.P., 1986. Training of track and Held athletes. Kiev: Health Publisher (Zdorovie).
•
Bondarchuk, A.P., 1988. Constructing a training system. Track Technique, 102, pp.3254-3269.
•
Bondarchuk, A.P., 2007. Transfer of Training in Sports. Michigan: Ultimate Athlete Concepts.
•
Bradley-Popovich, G., 2001. Nonlinear versus linear periodization models. Strength Cond J, 23(1), pp.42-43.
•
Burd, N.A., Tang, J.E., Moore, D.R. and Phillips, S.M., 2009. Exercise training and protein metabolism: Influences of contraction, protein
intake, and sex-based differences. J Appl Physiol, 106(5), pp.1692-1701.
•
Butovsky, A., 1906. Problems of Physical Training and Sports at the International Congress in Brussels in Summer 1905, St. Petersburg.
•
Chagovets, N.R., 1957. Biochemical changes in muscles in restitution after physical work. Ukr Biochem J, 29, pp.450–457.
•
Chromiac, J.A. and Mulvaney, D.R., 1990. A review: the effects of combined strength and endurance training on strength development.
J Appl Sport Sci Res, 4, pp.55-60.
•
Councilman, J., 1968. The science of swimming. Engelwood Cliff, NJ: Prentice-Hall.
•
Daussin, F.N., Zoll, J., Dufour, S.P., Ponsot, E., Lonsdorfer-Wolf, E., Doutreleau, S., Mettauer, B., Piquard, F., Geny, B. and Richard, R.,
2008. Effect of interval versus continuous training on cardiorespiratory and mitochondrial functions: relationship to aerobic performance
improvements in sedentary subjects. Am J Physiol Reg, 295(1), pp.R264-272.
•
Djatschkov, W.M., 1974. Die Steuerung und Optimierung des Trainingsprozesses. Berlin: Bartels & Wer- nitz.
•
Docherty, D. and Sporer, B., 2000. A Proposed Model for Examining the Interference Phenomenon between Concurrent Aerobic and
Strength Training. Sports Medicine, 30(6), pp.385-394.
•
Dudley, G.A. and Djamil, R., 1985. Incompatibility of endurance- and strength-training modes of exercise. J Appl Physiol, 59(5),
pp.1446-51.
•
Fleck, S.J. and Kraemer, W., 1987. Designing resistance Training programs. 2nd ed. Champaign, IL: Human Kinetics.
•
Fleck, S.J., 1999. Periodized strength training: A critical review. Journal of Strength and Conditioning Research, 13, pp.82-89.
•
Fleck, S.J., 2011. Non-Linear Periodization for General Fitness & Athletes. J Hum Kinet, 29A, pp.41–45.
•
Ford, P., De Ste Croix, M., Lloyd, R., Meyers, R., Moosavi, M., Oliver, J., Till, K. and Williams, C., 2011. The long-term athlete development
model: physiological evidence and application. Journal of sports sciences, 29(4), pp.389-40.
•
Fry, R.W., Morton, A.R. and Keast, D., 1992. Periodisation of training stress: A review. Can. J. Sports Sci., 17, pp.234–240.
•
Gamble, P., 2006. Periodization of training for team sports athletes. Strength and conditioning journal, 28(5), pp.56-66.
•
Gergley, J.C., 2009. Comparison of two lower-body modes of endurance training on lower-body strength development while concur-
rently training. J. Strength Cond. Res., 23(3), pp.979–987.
•
Glowacki, S.P., Martin, S.E., Maurer, A., Baek, W., Green, H.J., and Crouse, S.F., 2004. Effects of resistance, endurance, and concurrent
exercise on training outcomes in men. Med. Sci. Sport Exerc., 36(12), pp.2119–2127.
•
Gracliam, J., 2002. Periodization research and example application. Strength Cond J, 24(6), pp.62-70.
•
Harren, D., 1974. Trainingslehre. Berlin: Sportverlag.
•
Hawley, J.A., 2009. Molecular responses to strength and endurance training: Are they incompatible? Appl Physiol Nutr Metab, 34(3),
pp.355-361.
•
Hoff, J. and Helgerud, J., 2004. Endurance and Strength Training for Soccer Players. Physiological Considerations Sports Med, 34(3),
pp.165-180.
•
Jakovlev, N.N., 1977. Sportbiochemie. Leipzig: Barth Verlag.
•
Karavirta, L., Häkkinen, K., Kauhanen, A., Arija-Blazquez, A., Sillanpaa, E., Rinkinen, N. and Häkkinen, A., 2011. Individual responses
to combined endurance and strength training in older adults. Med Sci Sports Exerc, 43(3), pp.484-490.
•
Kotov, 1917. Olympic Sport.
•
Kraemer, W.J., 2004. Roundtable Discussion: Periodization of Training Part I. National Strength and Conditioning Association Journal,
26, pp.50-69.
•
Kraemer, W.J. and Fleck, S.J., 2007. Optimizing Strength Training Designing Nonlinear Periodization Workouts. Champaign, IL: Human
Kinetics Publishing.
•
Krümmel, C., Abrahams, H.M., Baetzner, W., 1930. Athletik : Ein Handbuch der lebenswichti- gen Leibesübungen. München: I.F.
Lehmann.
•
Kusnezow, W.W., 1972. Kraftvorbereitung. Berlin: Sportverlag.
•
Letunov, 1950. Reflections on the Systematic Formulation of Training. Sovietskii Sport, 125.
•
MacDougall, J.D., Sale, D.G., Moroz, J.R., Elder, G.C., Sutton, J.R. and Howald, H., 1979. Mitochondrial volume density in human skeletal
muscle following heavy resistance training. Med Sci Sports, 11(2), pp.164–6.
•
Matvejev, L.P., 1974. Periodisierung des sportlichen Trainings. Berlin: Bartels & Wernitz.
•
Matvejev, L.P., 1977. Fundamentals of sports training (Russian). Moscow: Rzkultura i Sport.
•
Matvejev, L.P., 1981. Fundamentals of sports training [English translation of the revised Russian edition]. Moscow: Progress Publishers.
•
McGawley, K. and Andersson, P.I., 2013. The Order of Concurrent Training Does not Affect Soccer-Related Performance Adaptations.
Int J Sports Med, 34(11), pp.983-90.
•
Morton, R.H., 1997. Modelling training and overtraining. J Sports Sci, 15, pp.335–40.
•
Nutton, V., 1973. The Chronology of Galen’s Early Career. Classical Quarterly, 23(1), pp.158–171.
•
Plisk, S.S. and Stone, M.H., 2003. Periodization Strategies. National Strength & Conditioning Journal, 25, pp.19-37.
•
Plisk, S., 2004. Roundtable Discussion: Periodization of Training Part I. National Strength and Conditioning Association Journal, 26,
pp.50-69.
•
Prestes, J., De Lima, C., Frollini, A.B., Donatto, F.F. and Conte, M., 2009. Comparison of linear and reverse linear periodization effects on
maximal strength and body composition. J Strength Cond Res, 23(1), pp.266-274.
•
Poliquin, C., 1997. The poliquin principles: Successful methods for strength and mass development. Napa, CA: Dayton Writer’s Group.
•
Price, M. and Moss, P., 2007. The effects of work: Rest duration on physiological and perceptual responses during intermittent exercise
and performance. J Sports Sci, 25(14), pp.1613-1621.
•
Rhea, M.R., 2004. Determining the magnitude of treatment effects in strength training research through the use of the effect size. J
Strength Cond Res, 18(4), pp.918-920.
•
Rhea, M.R., Phillips, W.T., Burkett, L.N., Stone, W.J., Ball, S.B., Alvar, B.A. and Thomas, A.B., 2003. A comparison of linear and daily
undulating periodized programs with equated volume and intensity for local muscular endurance. J Strength Cond Res, 17, pp.82-87.
[email protected] 06 Aug 2018
FITNESS IN SOCCER
272
Periodization in soccer
•
Schneider, V., Arnold, B., Martin, K., Bell, D. and Crocker, P., 1998. Detraining effect in college football players during the competitive
season. Strength Cond J, 12(1), pp.42-45.
•
Siff, M.C., 2003. Supertraining 6th Ed. Denver: Supertraining Institute.
•
Sleamaker, R. 1989. Serious training for serious athletes. Champaign, IL: Leisure Press.
•
Starischka, S., 1988. Trainingsplanung. Schorndorf: Hofmann.
•
Stølen, T., Chamari, K., Castagna, C. and Wisløff, U., 2005. Physiology of soccer: An update. Sports Med, 35(6), pp.501-536.
•
Stone, M.H., O’Bryant, H.S., Schilling, B.K., Johnson, R.L., Pierce, K.C., Haff, G.G., Koch, A.J. and Stone, M.E., 1999. Periodization. Part 2:
Effects of manipulating volume and intensity. Strength Cond. J., 21(3), pp.54–60.
•
Tang, J.E., Perco, J.G., Moore, D.R., Wilkinson, S.B. and Phillips, S.M., 2008. Resistance training alters the response of fed state mixed
muscle protein synthesis in young men. Am J Physiol Regul Integr Comp Physiol, 294(1), pp.R172-R178.
•
Tschiene, P., 1977. Einige neue Aspekte zur Periodiserung des Hochleistungstrainings. Leistungsport, 7, pp.379-382.
•
Tschiene, P., 1995. A necessary direction in training: The integration of biological adaptation in the training program. Coaching and Sport
Science Journal, 1(3), pp.2-14.
•
Urhausen, A. and Kinderntann, W., 2002. Diagnosis of overtraining: what tools do we have? Sports Med, 32(2), pp.95-102.
•
Vorobiev, A., 1974. Halterofilia: Ensayos sobre fisiología y entrenamiento deportivo. Mexico: Ed. Libros de México
•
Weir, J.P., 2005. Quantifying test-retest reliability using the intraclass correlation coefficient and the SEM. J Strength Cond Res, 19(1),
pp.231-240.
•
Wilks, R., 1995. Training theory and strength training. Strength and Conditioning coach, 3, pp.10-15.
•
Wilson, J.M., Marin, P.J., Rhea, M.R., Wilson, S.M.C., Loenneke, J.P. and Anderson, J.C., 2012. Concurrent training: A meta-analysis exa-
mining interference of aerobic and resistance exercise. J Strength Cond Res, 26(8), pp.2293-2307.
•
Zatsiorsky, V.M., 1972. Die körperlichen Eigenschaften des Sportlers. Berlin: Bartels & Wernitz.
•
Zatsiorsky, V.M., 1995. Science and practice of strength training. Champaign, IL: Human Kinetics.
[email protected] 06 Aug 2018
FITNESS IN SOCCER
The Tactical Periodization Model
273
15
THE TACTICAL PERIODIZATION MODEL
(UNDERSTANDING THE
GAME’S DEMANDS
TO ENHANCE SOCCER PERFORMANCE)
Juan Luis Delgado-Bordonau, Alberto Mendez-Villanueva
15.1 INTRODUCTION
We accept that the football training methodologies have been evolving and improving
greatly over time, but their origin remains the same: methodologies which approach
different aspects of the game in analytical and decontextualized forms (Tamarit, 2007).
In an attempt to simplify the complexity inherent in any human activity, sport-trai-
ning methodologies, like most other sciences, have used the “Cartesian” way of
thinking. Consequently, they suffered from a fragmentation of its various dimen-
sions (e.g., physical, technical, tactical and psychological). From this perspective,
these factors are first trained separately and combined later on when applied in
competition. Training methods have also been characterized by the division of the
season into several periods, and the periodization of these methods was structu-
red so “peak performance” would be reached at major competitions. To do this,
these training methods gave priority to the “physical” factors, because the con-
cept of “performance” appeared to be closely related to a set of adaptive biological
changes (functional and morphological) that occurs in the body. Training methods
were based upon the isolation of performance factors, and training was organized
through analytical approaches where decision-making processes played a secon-
dary role.
In contrast to these analytical training approaches, the so-called integrated training
method has gained momentum in team sports. This is where physical, technical
and tactical aspects are developed in combination. In short, integrated training pro-
motes a resemblance between competition demands and training activities, but it
does not address the contextual and specific features of all the game elements. Its
level of specificity therefore only relates to the sport itself and not to a certain way
of play (game model).
[email protected] 06 Aug 2018
FITNESS IN SOCCER
The Tactical Periodization Model
274
In this regard, Mourinho (quoted by Amieiro et al., 2006) said, “For me, things are
very clear. There is a traditional analytical-training approach; there is the integra-
ted training system that is done with ball, but where fundamental concerns are not
very different from traditional practice; and there is my way of training (called ‘tac-
tical periodization’) that has nothing to do with the other two. The only difference
between traditional training and integrated training is that in the latter, players are
mentally deceived by giving them a ball. But training consequences are exactly the
same as the traditional training.”
As highlighted by Guilherme Oliveira (2004), integrated training does not regard
the tactical dimension to be the driver of the entire training process, so the game
model is not used as a reference. Thus, the “integrated” approach becomes less spe-
cific than tactical periodization, because the decisions taken by the players at diffe-
rent times are not regulated and coordinated by a common language (i.e., the game
model). It does not allow the players to think in harmony and have the optimal
collective behavior the coach wants to see displayed at every moment of the game.
In a similar vein, Carvalhal (cited in Amieiro et al., 2006) states, “There are two
types of work with the ball: integrated (i.e., integrated training) and systemic (i.e.,
tactical periodization). In the first, the ball is present, but it is not subordinate to the
game model. We advocate another kind of training in which the ball is present from
the first day in order to create a model that is the way we want to play (collectively
and individually). Thus, the team is being organized to play from the first day, and
at the same time, performance is being modeled at all levels: physical, technical
and psychological. We pay attention to all dimensions, but which coordinates all of
them (physical, technical and psychological) is the tactical work.”
15.2 TACTICAL PERIODIZATION: A NEW SOCCER TRAINING APPROACH
“We can differentiate among traditional-analytical training where the different factors are
trained in isolation. There is the so-called ‘integrated training,’ which uses the ball, but the
fundamental concerns are not very different from the traditional one, and there is my way
of training, which is called Tactical Periodization. It has nothing to do with the previous
two, even though many people might think so.” (Mourinho, J. in Gaiteiro, 2006)
In recent years, along with the ever-changing soccer demands, we have seen a trend
toward a change in training concepts and methodologies, representing a break with
the past. Perhaps the biggest rupture from traditional soccer-training methods has
taken place in Portugal and Spain. One of the most contemporary training approa-
ches in soccer is the so-called Tactical Periodization method. The Tactical Periodi-
zation method was developed by Vitór Frade, a lecturer at the University of Porto
(Portugal) who is responsible for Porto FC’s coaching methodology. Several top-le-
vel coaches, such as Jose Mourinho, are also applying this method. Explained in
a simplistic manner, the main methodological and pedagogical principle behind
Tactical Periodization is that the soccer game has to be “trained/learned” with res-
pect to its logical structure. For Tactical Periodization, the “logical structure” of the
game revolves around the four moments of the game (see Figure 15.1). Accordingly,
at least one of these four moments of the game has to be accommodated in every
single training exercise, following the principle of specificity.
[email protected] 06 Aug 2018
FITNESS IN SOCCER
The Tactical Periodization Model
275
Fig. 15.1: Moments of the soccer game.
According to Tactical Periodization, the tactical dimension is not reduced to a sys-
tem of play or team shape (spatial organization). As stated by Mourinho (2002),
“Tactics is understood as a well-defined set of principles of play, both for attack and
defense (and their transitions) in accordance with the way of play desired by the
coach. The ultimate goal is to ‘organize’ the ‘chaos.’”
This periodization is called “tactical” because, according to Frade (2003), “The
game’s expression is tactical: the way we want to play.” Tactical Periodization aims
to make an operational game model. Every training exercise is contextualized with
reference to a global framework: the game model. Thus, the game model and its
principles guide the training process from the very beginning. Tactical Periodiza-
tion understands that training has to “model” the game through specific exercises
that include all the game principles relevant for each coach. As Gomes (2006) points
out, the specificity of an exercise not only covers its structural and temporal featu-
res—the coach should also direct players’ attention to behaviors he or she wants to
develop. Thus, Tactical Periodization considers that specificity needs to be direc-
ted not only to the design of the exercise itself but also to the coach’s intervention
(e.g., feedback). Consequently, training will guide the players into a pattern of play,
aiming to develop a collective and individual identity. Frade (2004) stated, “The
game is an ongoing phenomenon; its construction is created by the habits we want
to see happening in the field, which are acquired throughout the action (training).”
Every game action, regardless of which of the four moments of the game it might
happen at, involves a decision (tactical dimension) and an action or motor skill
(technical dimension) that requires a particular movement (physiological dimen-
sion), and it is directed by volitional and emotional states (psychological dimen-
sion) (Oliveira, 2004). A good performer (i.e., a good soccer player) is, first and
foremost, an individual able to select the most appropriate response to different
game scenarios, and these actions are always determined by a tactical context
[email protected] 06 Aug 2018
FITNESS IN SOCCER
The Tactical Periodization Model
276
(Garganta and Pinto, 1998). Accordingly, the tactical dimension should be the
dominant training component. The tactical dimension leads the orders to achieve
the targeted goals. For example, the concept of “speed” would change to “relative
speed,” because a player sometimes needs to be second to be tactically “effective”
in a given soccer situation.
However, the tactical dimension does not exist by itself—it only makes sense when
it occurs through the interaction of the other dimensions (Oliveira, 2004). This
implies that the tactical, technical, physiological and psychological elements are
never trained independently. Everything is included, with the main concern being
that every exercise is organized around at least one of the four moments of the
game and the tactical principles of play.
15.3 GAME MODEL
“To me, the most important aspect in my teams is to have a defined game model, a set of
principles that provides organization. Therefore, since the first day, our attention is direc-
ted to achieve that.” (Mourinho, J., in Gaiteiro, 2006)
Models are creations that are based on interpretations of reality (Le Moigne, 1990).
Modeling results from the need to understand the complex interactions between
the different elements of a system. In the game of soccer, there are specific features,
such as players’ decision making. Those decisions cannot be coincidental, so they
have to be based on certain principles, making the team’s actions follow an internal
logic. While constructing the game model for the team, coaches should consider
several factors that operate within a given specific context, with each factor being
equally important (Figure 15.2).
Fig. 15.2: Factors that influence designing and building up a game model.
(Adapted from Oliveira, G. 2007)
[email protected] 06 Aug 2018
FITNESS IN SOCCER
The Tactical Periodization Model
277
A key aspect in building a game model relates to the style of play the coach wants
to see represented in each of the different moments of the game and the interre-
lationships between them. It is imperative for players to know exactly what they
have to do at every moment of the game. There are certain tactical behaviors and
patterns the coach wants to be revealed during the game, such as collective (i.e., the
whole team), inter-sectorial (e.g., defenders and midfielders), sectorial (e.g., defen-
ders), and individual actions (Figure 15.3). Thus, the model consists of principles,
sub-principles, and sub-sub-principles of play, all of which are articulated with
each other, representing the different moments of the game (Oliveira, 2003). The
compatibility of the different principles and moments of the game is particularly
important, because behaviors can sometimes be incompatible. These behaviors and
patterns, when articulated, express a collective dynamic behavior and reveal a cer-
tain playing identity, which could be called a functional organization. The struc-
tural organization is how the team is placed on the field—it is usually called the
system of play (e.g., 1-5-3-2 or 1-4-3-3). Although the structure only represents a
fixed spatial shape, it can have an important role in promoting or constraining desi-
red behavior. For instance, to have good levels of ball possession and circulation, it
seems important for players to constantly create diagonals and “diamonds” among
themselves. As such, some structural organizations can enhance these behaviors
more than others (e.g., structures with a high number of lines, both transversal and
longitudinal).
Fig. 15.3: Tactical relationship levels.
[email protected] 06 Aug 2018
FITNESS IN SOCCER
The Tactical Periodization Model
278
Regarding the players, the game model should highlight and enhance their best
features and capabilities. It is essential for the coach to acquire, as soon as possible,
a deep knowledge of the players, especially their level of game understanding,
because he or she will interpret the behaviors that lead to the team playing in a cer-
tain way. In this regard, Frade (2003) points out that the game “has to be born first
in the players’ minds.” Therefore, it is crucial for the coach to use strategies that let
the players recognize the importance of certain behaviors, because their convicti-
ons are also vital in developing the game model. Consequently, the construction of
the game model arises through a process that operates between the coach, players
and the team itself. The coach’s constant awareness about what he or she wants to
happen, both in collective and individual terms, and what is actually happening in
the game should be the driver of the training process. However, it is important to
understand that the definition and creation of a clear game model should not be
perceived as something that will require players to act as robots always following a
predefined plan. On the contrary, the main purpose of having a clear game model
is to reduce players’ uncertainty, and this should give players more time to express
their creativity.
The structure and expectations of the club or federation are also important aspects
in creating a game model. Coaching a team that can only train two or three times
a week and coaching a team that can train five times are obviously different tasks.
The scope for improvement, both collectively and individually, is also different.
The culture of the countries and clubs has also to be taken into account when cre-
ating a game model.
15.4 PRINCIPLES OF PLAY AND GAME MODEL
“We exercise our game model; we exercise our principles and sub-principles of play. The
players have to adapt their ideas through a common goal in order to establish the same
behavioral language. We work exclusively on game situations related to our way of play.
We do our weekly planning to create habits in order to maintain high levels of perfor-
mance, which often translates into ‘playing well’.” (Mourinho, 2005)
The fundamental principles of play, according to Carlos Queiroz (1983), are “the
rules which help the players to run and to coordinate their activities (individually
and collectively) during the moments of the game.” Therefore, they are rules of
action that support the basic objectives of soccer. According to the same author,
these fundamental principles are composed of two kinds of principle: the general
principles, which are the general behavioral requirements, and the specific princi-
ples, which are related to the attacking and defensive moments. Both general and
specific principles are inherent to the game, regardless of the way or style of play.
Specific principles include attacking principles (e.g., penetration, depth, mobility,
width and space) and defending principles (e.g., delay, depth, balance, concentra-
tion and composure). General principles include avoiding outnumbered situations,
avoiding parity, and creating overloads. However, there are many different ways to
perform a given general or specific principle. Therefore, Guillerme Oliveira (2003)
states we can add a third type of principle of play: the specific principles of the
game model.
[email protected] 06 Aug 2018
FITNESS IN SOCCER
The Tactical Periodization Model
279
The specific principles of the
game model refer to a set of
match-play patterns the coach
wants the team to adopt at any of
the four moments of the game. In
simple terms, it’s how the coach
wants the team to play, accor-
ding to his or her conception of
the game. Given the high unpre-
dictability that exists during a
soccer match, the coach has to try
to create predictability through a
process of preparation, planning
and training. Accordingly, every
training session is designed to
be as significant as possible to
the coach’s game model. The
systematic repetition (i.e., trai-
ning) of the tactical principles
of play should allow the players
to transform the coach’s desired
match-play patterns into habits,
which could be defined in lay
terms as “shortcuts created by
the brain” (McCrone, 2002). The
creation of these habits, the main objective of which is to “save time,” is only pos-
sible when the brain has already experienced the same or similar situations and
“recorded” them. The work of Haggard and Libet (2001) showed that the brain
prepares movement responses long before we are conscious about the execution of
the movement. Actions and decisions that are taken daily may seem to be conscious
and instantaneous, but they are actually the result of subconscious processes in the
brain. Thus, through these “habits,” decision and reaction times can be substanti-
ally reduced (McCrone, 2002). This method of training intends to prepare players
to understand and react faster to every possible game situation.
Combined, these principles allow our soccer team to perform certain motor beha-
viors and patterns on an individual, sectorial, intersectorial and collective scale.
Therefore, these principles are specifically designed according to our own way of
play and team identity. Obviously, these principles should always be in accord with
the fundamental principles of play. The specific principles of the game model can
be manifested at different levels of complexity. Tactical Periodization uses the follo-
wing nomenclature to hierarchically organize them:
• Main principles of play: related to collective behaviors.
• Sub-principles of play: related to intersectorial and sectorial behaviors.
• Sub-sub-principles of play: related to individual behaviors.
[email protected] 06 Aug 2018
FITNESS IN SOCCER
The Tactical Periodization Model
280
Thus, the model consists of game principles, sub-principles and sub-sub-principles
that represent the different moments of the game. When they are articulated with
each other, they express a functional organization embodying the identity of the
team (Oliveira, 2003). In this sense, it is essential the coach knows well what he or
she wants to see happening at each moment of the game. When defined, the princi-
ples, sub-principles and sub-sub-principles should be clearly exposed to the play-
ers, so everyone can clearly understand the way the team wants to play. However,
making all the players understand the same thing and getting them to act with the
same objective at the same time is not an easy task, and this takes time. Therefore,
it is essential for players to have the will to learn, but it is also crucial for the coach
to convince the players to work toward a common project and establish a common
language between all team members. At this point, it is worth mentioning that the
game principles are “open rules,” so they merely guide the players to act in a coor-
dinated manner while always respecting players’ freedom and creativity.
15.5 TACTICAL PERIODIZATION: METHODOLOGICAL PRINCIPLES
To make an operational game model, Tactical Periodization has defined and deve-
loped its own and unique methodological (pedagogical) principles (Figure 15.4).
Fig. 15.4: Methodological principles of Tactical Periodization.
[email protected] 06 Aug 2018
FITNESS IN SOCCER
The Tactical Periodization Model
281
15.5.1 Principle of Specificity
“For me, training means to train in specificity. That is, to create exercises that allow me to
exacerbate my principles of play.” (Mourinho, in Amieiro et al, 2006).
This is arguably the most important principle of Tactical Periodization. Specificity
arises when there is a permanent relationship between all the dimensions of the
game and the training exercises are specifically representative of the desired game
model (style of play). Therefore, the concept of specificity directs and leads the
“whole” training process. In this regard, Vitor Frade (in Silva, 1998), affirms that
regardless of a training exercise’s features (e.g., with more or fewer players, larger
or smaller spaces, etc.), it should always be articulated in a way that allows our
principles of play to be learned and transferred to competition.
However, every exercise is just “potentially specific.” The fulfillment of the princi-
ple of specificity will be only truly achieved if during training, players understand
the aims and objectives of the exercise and maintain high levels of concentration.
The coach’s intervention should also be appropriate (Oliveira, 2008). Then, speci-
ficity is related to the capacity to make operational the principles of play and their
respective sub-principles. Thus, according to Tactical Periodization, the principle
of specificity should also lead the interactive intervention between the exercise, the
players and the coach.
15.5.2 Principle of making tactical principles of play operational (conditioned
practices)
“One of the most difficult questions is how to make operational our style of play. We try
to achieve that by creating exercises where we are able to embrace all the dimensions (tech-
nical, tactical, physical and mental), but never forgetting our first concern: to enhance a
given principle of play of our game model.” (Mourinho, J. in Gaiteiro, 2006)
When we observe a team, we find it tends to exhibit a dynamic behavior that con-
stitutes its identity, explaining some patterns of action. To transform these patterns
into practice, every training exercise must be performed in close relationship with
our style of play (game model) and the concept of specificity. These references
should always be present in our daily work in order to provide specific adaptati-
ons and tactical knowledge. If a proposed exercise is designed without considering
our style of play, the promoted adaptations can have adverse effects and interfere
with the acquisition of the desired specific knowledge. It is crucial for exercises to
represent the way we want to play and the unpredictability inherent in the game.
This implies that each of the proposed exercises has to bring forward something
the players cannot control. If the game is nonlinear, the training exercises, even
though they are less complex, should also be nonlinear and exclude any direct cau-
se-and-effect relationship. The coach’s intervention plays a key role when conduc-
ting an exercise, because this positively or negatively catalyzes its specificity.
It is also important to note that the structural and functional configuration of the
exercises is crucial in order to comply with the specificity of the game. This means
there are exercises that, because of their structure, promote functionality (e.g., the
[email protected] 06 Aug 2018
FITNESS IN SOCCER
The Tactical Periodization Model
282
acquisition of subconscious behaviors). Alternatively, there are exercises that have
the exact same aim, the same number of players, and the same field dimensions,
but the distribution (i.e., structure) of the players in the field is different to what
would be required in a game (e.g., central defenders training in a different play-
ing position and role). This can consequently promote inadequate subconscious
behaviors and tactical knowledge. As stated by Mourinho (Amieiro et al., 2006),
“Training is only worthwhile when it lets you make your ideas and principles ope-
rational.” Thus, coaches have to find exercises to guide their teams to do what they
want them to do in a game.
It seems intuitive that when the aim is to teach or improve a particular principle
or sub-principle of our game model, the best way to do it is to create appropriate
exercises. Then, if we are interested in certain behaviors related to a given princi-
ple of play, we should make them appear more often in the exercise. As such, the
requested behavior has to appear much more frequently than it would during a
formal game, because this enables players to create multiple mental images about
the desired target. Thus, the configuration of the exercise (i.e., playing space, num-
ber of players, rules, objectives, etc.) must promote the appearance of the required
behavior(s), and this is called “conditioned practice.” For example, setting up an
exercise where a team’s defensive sector is under-loaded and constantly defending
will cause behaviors related to defensive organization to continuously emerge.
There will then be ample opportunities for coaches and players to “shape” these
behaviors.
Fig. 15.5: Principle of making principles of play operational.
[email protected] 06 Aug 2018
FITNESS IN SOCCER
The Tactical Periodization Model
283
15.5.3 Principle of disassembly and hierarchical organization of principles
of play.
“I wrote a document that is never going to be published. It is my ‘training dossier,’ where
I keep all my training guidelines. That is, all my training goals and the way to achieve
them through my methodological principles. If I would have to name this document, its
title would be: The evolution of my training concepts.”
(Mourinho, J. in Lourenço, L. & Ilharco, 2007)
Principles of play are very complex concepts because they involve several variables
that are intrinsically and inextricably related. This is why Tactical Periodization
breaks them down to reduce their complexity. Thus, the principles of play are sub-
divided into sub-principles, and these are further fragmented into sub-sub-princi-
ples. The aim is to make them more understandable for the players and therefore
help their assimilation. This process of disassembling the principles of play has
to be done very carefully, always respecting the style of play (game model) and
the wholeness of the game (systemic vision). Each specific principle of the game
model is directly related to one of the four moments of the game (see Figure 15.6
for an example). Equal value is not awarded to all the principles of play, so there is
a hierarchical organization. The importance of each principle during the training
process is directly related to the intended game model. Some principles are more
important and valued than others in terms of what is intended. A coach’s ability
to articulate all the principles that conform to his or her game model will deter-
mine the team’s “DNA,” which is basically the coach’s conception about the game
(Tamarit, 2007).
Fig. 15.6: Example of the Disassembly of a Principle of Play.
Adapted from Gomes, M. (2006)
[email protected] 06 Aug 2018
FITNESS IN SOCCER
The Tactical Periodization Model
284
15.5.4 Principle of horizontal alternation in specificity
“Our daily concerns are directed to make operational our game model. However, the
structure of the training session and what to do each day is not only related to the tactical
objectives, but also with the physical fitness component to be prioritized.” (Mourinho, in
Amieiro et al., 2006)
This principle relates to the need to maintain a regular and fixed weekly pattern
that respects the balance between training and recovery demands (Amieiro et al.,
2006). The Principle of Horizontal Alternation in Specificity highlights the impor-
tance and relevance that Tactical Periodization gives to the physical/physiologi-
cal dimension, contrary to the common and unfounded misconception that this
dimension is forgotten and untrained. In a simplistic manner, the three main trai-
ning (acquisition) days in the week alternate which physical-fitness component to
promote (assuming the team is playing one game per week) (Figure 15.7). This is
done by prioritizing strength (first acquisition day), endurance (second acquisition
day) and speed (third acquisition day) factors. Thus, no two days within a given
week demand the same physical-fitness component. The main goal is to avoid a
large amount of stress on the same physical-fitness component, giving the body
time to recover and consequently minimizing fatigue. Recovery will take place, at
least partly, by switching the dominant physical-fitness component and its associ-
ated neuromuscular, metabolic and morphological underlying factors throughout
the week. This alternation in the physical-fitness components to be prioritized is
said to occur horizontally along the weekly pattern, rather than between exercises
within the same training session (vertically). The tactical goals and objectives of
each training day can obviously vary in accordance with the specific needs of the
team, but the physical-fitness component being prioritized each day of the week
will remain the same. Thus, it can be said that for Tactical Periodization, the physio-
logical dimension provides the biological framework where the soccer-specific trai-
ning/recovery continuum lays.
[email protected] 06 Aug 2018
FITNESS IN SOCCER
The Tactical Periodization Model
285
[email protected] 06 Aug 2018
FITNESS IN SOCCER
The Tactical Periodization Model
286
The specific training contents (i.e., exercises) for each week arise from the conti-
nuous interaction between the game model, the performance of the team in their
previous game, and the characteristics of the upcoming opponent. The game model
acts as a reference to analyze previous game performance. Thus, positive and nega-
tive aspects can be identified, and any potential issues the team may face in the
next game can be anticipated. Accordingly, the training exercises should take into
account any problems the team showed in the previous game, as well as those they
will probably face in the upcoming game (Figure 15.8).
Fig. 15.8: Factors to take into account when setting weekly goals
(Adapted from Gomes, M. 2006)
[email protected] 06 Aug 2018
FITNESS IN SOCCER
The Tactical Periodization Model
287
15.5.5 Principle of tactical fatigue and tactical concentration
“Concentration needs to be trained. It can be done by training according to a specific phi-
losophy. I cannot dissociate training intensity from the concept of concentration. When I
say that football is made by actions of high intensity, I also refer to the need for permanent
concentration; it is implicit to the game.” (Mourinho, in Amieiro et al, 2006)
Soccer players’ peak performance requires a constant tactical thinking, both in
game and in training. Players need to always concentrate. The development of a
tactical attitude requires an attitude that can think and decide quickly. High levels
of concentration, from the first to the last minute of the game, are an essential requi-
rement. Therefore, “intensity” is not an intangible concept—it is directly related to
the principles and sub-principles of play that, when trained through well-desig-
ned exercises, will direct players’ future actions and thoughts. The more variables
that players need to analyze during the execution of training exercises, the more
demanding and intense the situation will be (Frade, 2003).
The intensity should be always maximal but relative, because it relates to the acti-
ons performed on a given training session. It will differ from day to day because
the complexities of training sessions also vary from day to day, dragging with it
the other dimensions of the game (Figure 15.9). We can exemplify the concept of
relative maximum intensity as follows. If the team played on Sunday, the player is
unlikely to be fully recovered (both physically and mentally/emotionally) by Tues-
day. To overcome all the challenges the Tuesday training session can impose, the
player should work at his or her maximum intensity of concentration. That maxi-
mum intensity, however, will not be enough to overcome the increased complexity
(and intensity) that the training tasks will demand, for instance, on Wednesday and
Thursday (because the player’s recovery status has also improved). Therefore, in
Tactical Periodization, the intensity is always maximal in terms of concentration,
but it is relative to a player’s recovery and readiness to train. The higher the level
of concentration during the training exercises, the less chance there is of making
mistakes. A high concen-
tration provides a higher
degree of learning, so coa-
ches should always seek
the maximum concentra-
tion during training.
[email protected] 06 Aug 2018
FITNESS IN SOCCER
The Tactical Periodization Model
288
15.5.6 Principle of complex progression
“Since the very beginning, the principles and sub-principles of our game model are
prioritized through a set of exercises. But the best way to convey our ideas is by
lowering the complexity through tactical, conditioned small-sided games.”
(Mourinho, J. in Fernandes, 2003).
This principle relates to the hierarchical organization of the principles and sub-prin-
ciples of play. It has nothing to do with a general-to-specific progression, from
volume to intensity, or such like. For Tactical Periodization, the concept of progres-
sion is built around the acquisition of a certain way of playing. This progression
appears at three different levels of complexity: during the season, throughout the
week (taking into account the previous game and the upcoming one), and finally
during each training session, thus becoming a complex progression where each
level is related to the other.
According to Frade (2004), during the early stages of the training season, we should
introduce the general principles of play (related to the four moments of the game:
defensive organization, offensive organization, transition defense-attack, and tran-
sition attack–defense). If players know and “can explain” when to apply the prin-
ciples of play relative to each moment, it will be easier for them to assimilate the
specific principles that each coach has in his or her game model. In a second phase,
we should work on the specific principles of “our” game model. At this stage, we
can distinguish two moments, with the first being the defensive organization of the
team, which we will begin to work with. From our point of view, it seems advisa-
ble to focus first on the defensive organization, because by having a good defen-
sive organization, the team will gain confidence and consistency, and this allows
coaches to progress into other game situations (defending properly to attack even
better). In addition, defending is “easier” than attacking. Coaches can then pro-
gress to the more complex behaviors that the offensive organization requires. The
transitions are a key aspect of modern soccer, so coaches should try to train them
from the very beginning because they will be linked to the team’s defensive and
offensive organization.
To understand the entire logical structure, the Principle of Complex Progression
and the Principle of Horizontal Specificity Alternation should be linked. We refer
to a “building up” and “disassembly” of the principles and sub-principles and their
hierarchy within the weekly plan and over consecutive weeks, according to the
evolution of the players and the team. This methodological principle has two levels
of planning that interact with each other: the short term (i.e., game to game) and the
medium-to-long term (i.e., style of play and game model).
[email protected] 06 Aug 2018
FITNESS IN SOCCER
The Tactical Periodization Model
289
15.5.7 Principle of performance stabilization
“I do not want my team to have peaks in performance. I do not want my team to swing
performance. Rather than that, I prefer to always keep high levels of performance. This is
because to me there are no periods or games that are more important than others.”
(Mourinho, in Amieiro et al., 2006)
From a conventional viewpoint, the concept of performance is normally based on
a set of quantitative-oriented criteria based essentially on the physiological dimen-
sion. Planning and periodization in soccer has to assign vital importance to the
concept of “performance stabilization,” which derives from the game’s long com-
petitive period. From this perspective, “being fit” is to “play well” and “playing
well” is to carry out the on-field duties in accordance with the intended game
model. Underpinning this concept is that collective and individual performance
is the basis of the team’s organization, and this is the fundamental objective to
be maintained. Thus, what really matters is that a team regularly demonstrates
a certain quality of play (despite minor fluctuations) to guarantee consistency in
competition.
A stable level of optimal performance is achieved through the implementation and
maintenance of the standard weekly plans (Figure 15.10). Thus, over the season,
weekly dynamics regarding training content, recovery schemes, and the number
and length of training units remain almost invariable.
Soccer performance and training cannot be separated from competition and the
game. It must be translated in terms of play, a quality instead of quantity approach,
always working on offensive and defensive actions and the dynamics that allow
the connection of these two moments. By working in such a way, the methodologi-
cal Principle of Stabilization is respected.
[email protected] 06 Aug 2018
FITNESS IN SOCCER
290
The Tactical Periodization Model
SUMMARY
It seems to be the consensus today that the tactical dimension plays an important
role in achieving high performance in soccer. As Pinto, J. (1996) states, “It’s incre-
asingly assumed the role of tactics as a center and coordinator of the different
factors of football performance. Tactical training therefore plays a decisive role
in the education and competitive performance of a football player. The deve-
lopment of tactical approaches implies the development of the ability to decide
quickly to be able to create solutions. That is, decision-making skills are inex-
tricably connected with the development of tactical knowledge.” Thus, it beco-
mes important to consider tactics as the dimension that coordinates the game
and training process. The tactical dimension of soccer does not exist by itself;
it makes sense only when it occurs through interaction with the other three: the
technical, physical and psychological. When developing a periodized training
schedule for a soccer team, it can be argued that tactical training should be the
dominant and most important dimension of the plan.
REFERENCES
•
Amieiro, N., Oliveira, B., Resende, N. and Barreto, R., 2006. Mourinho: Porquê tantas vitórias? Lisboa. Gradiva.
•
Fernandes, V., 2003. Implementação do Modelo de Jogo: da razão à adaptabilidade com emoção. Monografia realizada no âmbito da
disciplina de seminário, opção de futebol. FCDEF-UP.
•
Faria, R., 1999. «Periodização Táctica». Um Imperativo Conceptometodológico do Rendimento Superior em Futebol. Porto: R. Faria. Dis-
sertação de Licenciatura apresentada à Faculdade de Ciências do Desporto e de Educação Física da Universidade do Porto.
•
Frade, V., 2003. Entrevista in F. Martins, 2003. A “Periodização Táctica “ segundo Vítor Frade: Mais do que um conceito, uma forma de
estar e de reflectir o futebol. Porto: F. Martins. Dissertação de Licenciatura apresentada à Faculdade de Desporto da Universidade do
Porto.
•
Frade, V., 2004. Entrevista in P. Leal, 2004. Diferentes entendimentos, diferentes orientações metodológicas. Porto: P. Leal. Dissertação de
Licenciatura apresentada à Faculdade de Desporto da Universidade do Porto.
•
Frade, V., 2006. Dossier de Metodologia de Futebol I. Dossier das aulas não publicado. Faculdade de Desporto – Universidade do Porto.
•
Gaiteiro, B., 2006. A Ciência oculta do sucesso: Mourinho aos olhos da ciência. Porto: B. Gaiteiro. Dissertação de Licenciatura apresentada
à Faculdade de Desporto da Universidade do Porto.
•
Garganta, J., 2002. O treino da táctica e da técnica nos jogos desportivos à luz do compromisso cognição – acção. In V. Barbanti, Alberto
A., Jorge B. & António M. (Eds.), Esporte e atividade física: interacção entre rendimento e saúde (pp.281–306). São Paulo: Editora Manole
•
Garganta, J. and Pinto, J., 1998. O Ensino do Futebol. In A. Graça & J. Oliveira (Eds.), O ensino dos jogos deportivos, 3ª Ed. (pp.95–135).
Porto: Centro de Estudos dos Jogos Desportivos, FCDEF-UP
•
Gomes, M., 2006. Do Pé como Técnica ao Pensamento Técnico dos Pés Dentro da Caixa Preta da Periodização Táctica – um Estudo de
Caso. Porto: M. Gomes. Dissertação de Licenciatura apresentada à Faculdade de Desporto da Universidade do Porto.
•
Haggard, P. and Libet, B., 2001. Conscious Intention and Brain Activity. Journal of Consciousness Studies, 8, No. 11, 2001, pp.47–63
•
Le Moigne, J., 1990. La modélisation des systèmes complexes. Dunod. Paris.
•
Lourenço, L. and Ilharco, F., 2007. Liderança: As Lições de José Mourinho. Booknomics.
•
Martins, F., 2003. A “Periodização Táctica “ segundo Vítor Frade: Mais do que um conceito, uma forma de estar e de reflectir o futebol.
Porto: F. Martins. Dissertação de Licenciatura apresentada à Faculdade de Desporto da Universidade do Porto.
•
Matvejev, L., 1981. O processo de treino desportivo. Lisboa : Livros Horizonte.
•
McCrone, J., 2002. Como Funciona o Cérebro: um guia para principiantes. Dorling Kindersley - Civilização Editores. Porto.
•
Mourinho, J., 2002. Quero ganhar títulos com um futebol atractivo. Revista Dragões; Ano 16, nº201.
•
Oliveira, J.G., 2003. Entrevista in J. Tavares (2003). “Uma noção fundamental - a especificidade: o como investigar a ordem das “coisas”
dojogar, uma espécie de invariâncias de tipo fractal”. Porto: J. Tavares. Dissertação de Licenciatura apresentada à Faculdade de Desporto
da Universidade do Porto.
•
Oliveira, J.G., 2004. Conhecimento Específico em Futebol. Contributos para a definição de uma matriz dinâmica do processo ensino-
aprendizagem/ treino do jogo. Porto: J. Guilherme Oliveira. Dissertação de Mestrado apresentada à Faculdade de Desporto da Uni-
versidade do Porto.
•
Oliveira, J.G., 2007. F.C. Porto: Nuestro Microciclo Semanal (Morfociclo). VI Clinic Fútbol Base Fundación Osasuna.
•
Oliveira J.G., 2008: Apontamentos do Curso de Treinadores de Futebol UEFAb, Federação Portuguesa de Futebol, Associação Futebol do
Porto, Associação Nacional de Treinadores de Futebol. Porto. Trabalho não publicado.
•
Pinto, J., 1996. A táctica no futebol: abordagem conceptual e implicações na formação. in J. Oliveira & F. Tavares (Eds), Estratégia e Táctica
nos Jogos Desportivos Colectivos. FCDEF-UP.
•
Queiroz, C., 1986. Estrutura e Organização dos Exercícios de Treino em Futebol. Lisboa: Federação Portuguesa de Futebol.
•
Silva, L., 1998. Rendimento superior no futebol, “sem lesões”, quais as razões? Porto:L. Silva. Dissertação de Licenciatura apresentada à
Faculdade de Ciências do Desporto e de Educação Física da Universidade do Porto.
•
Tamarit, X., 2007. Que es la Periodización Táctica? Vivenciar el juego para condicionar el juego. MCSports. Pontevedra
[email protected] 06 Aug 2018
FITNESS IN SOCCER
Macrocycle: Preseason
291
16
MACROCYCLE: PRESEASON
Jan Van Winckel, Werner Helsen, Kenny McMillan, Paul Bradley
16.1 INTRODUCTION
In the previous chapters, we talked about the importance of “fatigue management”
and “performance stabilization” throughout the competitive in-season period. In
this chapter, we take a closer look at the preseason macrocycle. The preseason trai-
ning period is traditionally the period when players complete the most physical
work, enabling them to cope with the physiological demands of the competitive
season (Bangsbo, 1994). Tae-Seok et al. (2011) examined the physiological loads of
programmed “preseason” and “in-season” training in professional soccer players.
They concluded that the average physiological loads were higher in preseason than
in in-season, and a greater proportion of time was spent exercising at 80–100% of
maximum heart rate. During preseason, coaches usually focus on rebuilding fit-
ness (retraining). Adjustments in load are a direct attempt to deliver a training sti-
mulus to promote specific training adaptations (Tae-Seok Jeong et al., 2011). This
contrasts with the goals of training sessions during the competitive season, where
emphasis is mainly on maintaining the physical abilities developed during pre-
season (Bangsbo et al., 2006). During preseason, the training load can be as high
as one or two daily training sessions (90–120 minutes per session) for five days a
week (Impellizzeri et al., 2006). Overall, the aerobic capacity of team sport players
(e.g., basketball, rugby league and soccer) has been shown to increase throughout
the preseason and decrease during the competitive season when using a classical
team sport conditioning approach (Stone and Kilding, 2009). Thus, the focus of
preseason is usually centered on long-term improvement of physical abilities. For
elite teams unfortunately, the emphasis during preseason is increasingly placed
on commercial activities, or games are planned to meet sponsorship requirements.
Although this may be lucrative in the short term, it could detrimentally affect per-
formance in the longer term.
[email protected] 06 Aug 2018
FITNESS IN SOCCER
Macrocycle: Preseason
292
16.2 PRESEASON TRAINING PRINCIPLES
We highlight below some important training principles, which should be taken into
consideration when setting up a training plan for the preseason macrocycle.
16.2.1 Aerobic fitness
Aerobic fitness is the keystone on which all further training builds upon. For this
reason, aerobic fitness has to be given sufficient attention before other physical abi-
lities can be trained. In an interesting study, Magarey et al. (2013) examined the
relationship between preseason fitness testing and injury in elite junior Australian
football players. Players with lower levels of aerobic endurance (in a 20m mul-
ti-stage shuttle run) were at greater risk of shin/ankle/foot region injuries. The
researchers suggest that this is possibly due to the fact that these players are subject
to higher levels of fatigue at a comparative workload.
16.2.2 Off-season
Professional players should maintain aerobic fitness during the off-season to
reduce the detraining effect. McMillan et al. (2005) found that aerobic endurance
performance increased significantly between the start of the preseason training
period and the early weeks of the competitive playing season. They suggested that
this may be because players return to preseason training in a detrained state after
a summer intermission of several weeks. Bangsbo (1994) found, in contrast with
Impellizeri et al. (2006), no change in VO
2max after a preseason training period in
professional soccer players, although the speed at 3 mmol/L blood lactate concen-
tration increased significantly. Impellizeri et al. (2006) suggest that the absence of
improvement in VO
2max, as found by Bangsbo, could be due to the shorter summer
break of 2-3 weeks that is typical of professional soccer teams (compared to the
longer detraining period for the junior players used in Bangsbo’s study). Amigo et
al. (1998) studied the effects of weeks of rest on three groups of adolescent soccer
players who had undergone systematic training for the previous 11 months. The
researchers found a detraining effect: a decrease in the cross-sectional area of type
I and type II fibers and a significant decrement in the activities of aerobic enzymes.
Bangsbo and Mizuno (1988) found that a relatively short-term training intermis-
sion was not enough to cause a significant decrease in VO
2max, but muscle oxidative
enzymes did decrease quickly. They suggest that for these two reasons, the level
of physical activity needs to be kept reasonably high during a detraining period to
ensure that the mitochondrial enzymatic activity of the players will be as high as it
was before the off-season period.
[email protected] 06 Aug 2018
FITNESS IN SOCCER
Macrocycle: Preseason
293
16.2.3 Physiological load / Mechanical load
With the arrival of GPS devices, the understanding of the mechanical load impo-
sed on players has increased enormously. Joints and muscles are subjected to a
significant load when changing direction (five times the body weight or higher),
which is why it is best to limit the number of impact training sessions in a micro-
cycle. One of the main goals of preseason training is to improve various physical
abilities, and this can be achieved by increasing the physiological load on players
while limiting the mechanical load, thus decreasing the chance of injury. However,
it is also important during preseason to prepare players for the demands of match
play. By monitoring mechanical load during matches using GPS, reference values
can be created. Training can then be tailored to ensure players are able to meet their
mechanical demands (e.g., number of sprints performed, acceleration and decele-
rations, the number of high intensity efforts, etc.).
16.2.4 Respect recovery
If your club does not have appropriate facilities to allow players to rest and recover
between two training exercises or sessions, it is advisable to avoid two impact-trai-
ning sessions per day.
Examples:
- 2 x 75 minute training sessions:
• Warm up = 2 x 30 minutes
• Active learning time = 2 x 45 minutes
• Recovery before the next training session: a maximum of four hours after first
training session and 16–17 hours after second training session.
- 1 x 120 minute training session:
• Warm up = 1 x 30 minutes
• Active learning time = 1 x 90 minutes
• Recovery before the next training session: 24 hours
• When training twice a day, alternative training (cross-training principle) can
also be included in the program. Running, aqua-jogging or cycling can also
be used to improve aerobic fitness and create overload without the risk of
injury.
16.2.5 Match load / Training load
Training should be as match specific as possible. The match itself is therefore good
training in principle. After a hard training session, however, the body needs time
to recover and transform the training work into improved performance, so do not
plan any tough training sessions too soon before a match.
A match is one of the most difficult types of activity to monitor. Not all players will
be active for the entire match, and some players will be used as substitutes. It is the-
refore necessary to closely monitor matches so that all the players receive the same
training load. An extra training session the day after a match is not sufficient. The
load imposed by a match is often difficult to mimic, and players who are not used
regularly will have difficulties coping with the demands of match-play..
[email protected] 06 Aug 2018
FITNESS IN SOCCER
Macrocycle: Preseason
294
16.2.6 Workload management
As we already read in the earlier chapters, it is important to manage and manipu-
late fatigue (fatigue management). This can be done based on objective parameters
given by heart rate monitors and GPS devices, but it can also be based on subjective
parameters.
During the preseason period, it is important to closely follow the balance between
load and load tolerance. This can be done by monitoring the status of players using
a simple questionnaire that can be displayed in the changing room (Fig. 16.1). There
are also software applications available now for smartphones and computers that
can be used by players to record their status.
Session RPI scale 10
Session RPMF scale 20
Overtraining scale
RPI Scale 10
What best reflects the
intensity of the training?
0: Rest
1: Very, very low intensity
2: Very low intensity
3: Moderately intensive
4: Somewhat intensive
5: Intensive
6:
7: Very intensive
8:
9: Maximal intensity
How fatigued are your leg
muscles?
0: No fatigue at al
1:
2:
3:
4:
5: Legs feel slightly heavy
6:
10: Legs feel fatigued
15: Legs feel heavy
20: Training is impossible
Overtraining scale 6
What best reflects your
feeling?
0: No pain/fatigue at all
1: Muscle pain/fatigue
in the morning after
waking up
2: Muscle pain/fatigue in
between exercises
3: Muscle pain/fatigue at
the start of the warm
up, but the pain/fatigue
fades during warming
up
4: Muscle pain/fatigue at
the start of the training,
the muscle pain/fatigue
fades during training
5: Muscle pain/fatigue
is constantly present
during the training
session
6: Training is no longer
possible.
Player 1
Player 2
Player 3
Fig. 16.1: Sheet that can be used to monitor subjective fatigue. ( RPI - Rate of Perceived Intensity;
RPMF - Rate of Perceived Muscle Fatigue)
As training adaptations are only possible when an overload is created which results
in some fatigue accumulation, a player will often feel muscle soreness at the start
of the next training session in the preseason phase. Training sessions in soccer are
normally completed by the entire team, but because the fitness levels of players
can vary significantly, some players will train hard while others undergo a lighter
training session. In order to make sufficient progress for all players, it is therefore
important to properly monitor the overload process. One of the golden rules is
that a maximum of 25% of the players may be in overtraining scale phase 3 during
preseason.
[email protected] 06 Aug 2018
FITNESS IN SOCCER
Macrocycle: Preseason
295
16.2.7 Variation / Monotony
The greatest progress is made when there is sufficient variation in the training.
Variation also ensures that injuries are prevented. If monotony (the lack of varia-
tion in load or intensity) is too high, the likelihood of injury increases.
16.2.8 Finish the training session with an extensive exercise or cool down
You often see training sessions ending with an intensive exercise. This gives the
coach and players the impression that a satisfactory, intensive training session has
been completed. It is important, however, to finish the training session with a cool
down. By gently working the major muscle groups, rest products such as lactate are
actively processed. A cool down also allows body and muscle temperature, heart
rate, and blood pressure to gradually return to resting levels. Due to the increase in
muscle temperature, the cooling down period is a perfect time to stretch and incre-
ase or maintain joint range of movement and flexibility.
16.2.9 Unloading week
It is best to incorporate an unloading period of five to eight days into the presea-
son phase if possible. This allows dissipation of any accumulated fatigue arising
from the first few weeks of preseason training, and also provides time for players
to recover from minor injuries. The unloading period is best planned in the third
or fourth week. This period also allows the staff to analyze data from heart rate
monitors and GPS devices and consequently adjust the training plan and set new
individual goals.
16.2.10 Periodization of tests
All too often, physical tests are scheduled during the fi
week. This is not ideal as
players often arrive in a detrained state and are physically unprepared for intensive
tests. It may be better, for example, not to carry out any speed or agility tests during
the fi
week of preseason. Instead, the ideal time to conduct these tests is in the fi
phase (intensity phase) of preseason. On the other hand, submaximal aerobic tests
can be scheduled in the fi
microcycle, but maximal tests should be avoided in the
fi
few days.
16.2.11 Individual periodization in off-season
Each player needs a minimum of two to three weeks of relative rest after a stres-
sful (both physically and mentally) season. This means that players returning from
international duty must also be given the same time to sufficiently rest and process
the physical and neural fatigue. If this break is not respected, it will have conse-
quences for the remainder of the season.
16.2.12 Foreign players
Foreign players often want to stay in their home countries for as long as possible,
often returning to the club a day or just a few days before the first training session.
This compromises the quality of their training sessions in the first week of presea-
son, and it could lead to overtraining because of insufficient recovery from “travel
fatigue” (Reilly et al. 1997). Ensure that players report for preseason training fresh
and free from jet-lag, because this will allow time for the players to settle in and
cope with the demands of preseason training.
[email protected] 06 Aug 2018
FITNESS IN SOCCER
Macrocycle: Preseason
296
16.3 ORGANIZATION OF THE MESOCYCLE
In the preseason phase, we opt for a six phase periodization strategy. Because pre-
season can extend over a period of five, six, seven and sometimes even eight weeks,
a phase in this mesocycle may be shorter or longer than a week.
These six phases are structured such that they comply with the concept of fatigue
management. In the preseason macrocycle, loading strategies are therefore alterna-
ted with recovery strategies within each microcycle. At the end of the mesocycle,
a microcycle of unloading (tapering) is planned so the players can start the season
“fresh.” The preseason mesocycles differ from in-season mesocycles in that there is
no specific tapering planned in the various microcycles before preseason matches.
This is the structure of the preseason mesocycle:
- Volume phase
• Extensive endurance phase (EEP)
• Intensive endurance phase (IEP)
• Unloading phase (UP)
- Intensity phase
• VO
2max phase (VO2P)
• Interval phase (IP)
• Speed phase (SP)
• Tapering phase (TP)
16.3.1 Extensive endurance phase (see table 16.2)
Training forms:
• Aerobic endurance
• Continuous extensive
• Fartlek variable
• Continuous intensive
[email protected] 06 Aug 2018
FITNESS IN SOCCER
Macrocycle: Preseason
297
16.3.2 Intensive endurance phase (see table 16.2)
Training forms:
• Aerobic endurance
- Continuous intensive
- VO
2max interval
- Long-interval loads
16.3.3 VO2 max phase (see table 16.3)
Training forms:
• VO
2max interval
- Long-interval loads
- Medium-interval loads
• Short-interval loads
16.3.4 High-intensity phase (see table 16.3)
Training forms:
• VO
2max interval
- VO
2max repetition
- Long repetition loads
- Medium repetition loads
- Short repetition loads
- Repeated sprint exercises
16.3.5 Speed phase (see table 16.4)
Training forms:
• Resistance
- Starting speed
• Acceleration
• Maximum speed
• SAQ training
• Medium repetition
• Short repetition
16.3.6 Tapering (see table 16.4)
Training forms:
• Tapering strategies
Macrocycle
Preseason Macrocycle
Mesocycle
Mesocycle Volume
Mesocycle Intensity
Microcycle
Extensive
endurance
Intensive
endurance
Unloading
VO
2max
Interval
Speed
Tapering
Table 16.1: Organization of the preseason macrocycle
[email protected] 06 Aug 2018
FITNESS IN SOCCER
Macrocycle: Preseason
298
16.4 FRIENDLY MATCH PLANNING IN THE PRESEASON STAGE
Casamichana et al. (2012) compared the physical demands of friendly matches
(FMs) and small-sided games (SSGs) in semiprofessional soccer players using GPS
technology. The researchers found the distance covered in the speed zones greater
than 21 km/h was significantly higher in FMs as opposed to SSGs. Moreover, more
sprints per hour of play were performed during FMs, with greater mean durations
and distances, greater maximum durations and distances, and a greater frequency
of sprints of 10-40 and >40 m. Finally, they demonstrated that the frequency of
repeated high-intensity efforts was higher during FMs. The results of this study
(Casamichana et al., 2012) suggest that coaches should consider FMs during pre-
season to elicit specific adaptations in the domain of high-intensity effort.
Below are a number of rules for planning and playing preseason friendly matches:
1. Do not plan matches in the first week.
Players often return after the summer period with reduced fitness. They need
time to adapt to the load of soccer training again. If a friendly match is planned,
it is best done against weaker opponents, with the players not playing for more
than 45 minutes.
2. Plan games according to the number of players.
Coaches sometimes make the mistake of planning two matches per week for a
squad of 18 players. It should be remembered that improving performance is
the main objective. This means that training needs to be approaching the injury
threshold, and this leads to players often experiencing minor problems (medical
attention injuries). Playing with these medical attention injuries carries a great
risk. There will also be players who cannot participate in all of the preseason
because of international obligations (professional players), jobs (amateur play-
ers), or holidays. It is therefore better to plan friendly matches based on one per
16 players, possibly planning games against the reserve team or lesser oppo-
nents in the middle of the week. These matches can potentially be delayed to
later in the preseason phase, or using the players of the reserve team.
3. Varying playing time.
Start by getting everyone to play for 45 minutes. Then progress players up to
playing for 60, 75 and finally 90 minutes of match time before the competitive
season begins. Ideally, every players should have participated in at least two full
games before the competitive season commences.
4. Preseason is for all players.
Preseason is an important period for all players. If a player has a poor preseason,
this will jeopardize the rest of the season, so develop a preseason program for all
players rather than just the first-choice players.
5. Varying intensity.
Try to vary intensity during preseason friendly matches. For example, players
can be instructed to play a high-pressing game for 15 minutes. This will boost
the intensity, which in turn increases the load. This load can then be built up in
the following friendly matches. Periods of ball possession can also be played in
[email protected] 06 Aug 2018
FITNESS IN SOCCER
Macrocycle: Preseason
299
order to reduce the load. This can be done in one of the first weeks of the season,
for instance, if volume is the main objective.
Example of buildup:
• 45 minutes ball possession
• 15 minutes ball possession, 15 minutes pressing, 15 minutes ball possession
• 15 minutes pressing, 15 minutes ball possession with low defensive line,
15 minutes pressing
• 45 minutes pressing
6. Plan the quality of your opponents.
Players will be fatigued during preseason because of the increased load, and this
will inevitably compromise performance. When planning opponents for prac-
tice matches, it is therefore important to make the right choice. Preseason should
start with matches against weaker opponents before facing stronger opponents
in the last two weeks (when the load has decreased and performance and pre-
paredness will increase).
When selecting the opponents, coaches should consider that everyone in the
club will have their own expectations. Suppose you play against a second-class
foreign team in week 2. However, this team starts its league the following week
and plays 90 minutes with its strongest team. You are still working on building
up fitness, and your team will therefore accumulate fatigue. Therefore, players
will be fatigued, or at least less prepared, when starting the game. The result
might be that you lose the game, resulting in dissatisfaction both internally and
externally (media and supporters). Try to avoid this, because the mental aspect
cannot be detached from the physical aspect.
For this reason, practice matches should be arranged against lesser local teams
before subsequently facing stronger teams.
7. Important competitive matches during preseason.
You might possibly have to compete in a European or other cup competition
during the preseason phase. Your pre-season plan will have to take this matter
into account. Clear choiceImportant, strategic decisions have to be made, and
communicated to all of the clubs players and coaching staff.
[email protected] 06 Aug 2018
FITNESS IN SOCCER
Macrocycle: Preseason
300
16.5 ORGANIZATION OF THE PRESEASON TRAINING CAMP
Training camps are often used in an inappropriate way to subject players to exces-
sive loads. The training camp schedule should be organized in such a way to ena-
ble players to recover from training sessions in an optimal manner. As a result, the
training load can be increased gradually. All the recovery strategies (e.g., sleep, rest,
nutrition, hydration, etc.) can be scheduled in an optimal way to ensure that fatigue
between sessions is reduced as quickly as possible.
Planning a preseason training camp is an important consideration. In the past, a
training camp was often organized to start in the first two weeks of preseason. This
often led to injuries because of the load increasing far too quickly. A training camp
in preseason is best scheduled at the start of the third or fourth week, ideally before
the unloading phase. Double sessions are regularly planned during those weeks.
It is also important to consider the objective of a training camp. Is the aim to
strengthen team spirit or improve fitness? Or is it a combination of the two? A night
out or team-building activities like go-karting will disrupt and delay recovery. A
training camp is not necessary for organizing a group activity, but if it is planned
as a team-building activity, it should be accompanied by a reduction in workload.
Training camps can also be organized solely for the purpose of playing friendly
matches. Professional soccer players may cover a distance of 30–45 kilometers
during a normal training week, which is approximately 70% of what a professional
player can process each week. Exceeding this threshold will lead to an exponential
increase in the number of injuries.
Ekstrand and Gillquist (1983) examined the injury incidence of soccer players
during training camps. Each soccer team in this study had two training camps, one
in March-April before the start of the Spring league play and one in July before the
start of the Autumn league play. The Spring season camp, lasting three days with
one to two practice sessions each day, had an injury incidence of 21.3 ± 15.2/1000
hours, which is three times that of average practice injury. The Autumn training
camp, lasting five days with one to two practice sessions per day, also had an injury
incidence that was higher than average, but it was lower than that of the Spring
camp (Ekstrand and Gilquist, 1983).
Non-impact sessions—such as running in running shoes, cycling, mountain biking,
or kayaking—can also be included in a training week in order to build up fatigue
without too much mechanical impact. These are all cross-training options for soc-
cer players during the preseason phase.. There is a lower risk of injury while still
keeping a high load level. However, the effects of a new training mode do need
to be considered. Cycling involves a very different load to soccer, and it therefore
causes a specific form of fatigue. There are examples where coaches organize long
mountain-bike rides in the morning as recovery training followed by a friendly
match in the afternoon. This is likely to result in muscle injuries. Soccer players are
very specifically trained to produce maximum performance. A different mode of
training will therefore quickly entail peripheral local fatigue. You could compare
this to an elite cyclist having to play a soccer match in the morning and then parti-
cipate in a cycle race in the afternoon.
[email protected] 06 Aug 2018
Macrocycle Preseason / Mesocycle Volume
Monday
Tuesday
wednesday
Thursday
Friday
Saturday
Sunday
Screening
week
Preseason
screening
Preseason
screening
Preseason
screening
Free
Extensive endurance phase
Week 1
AM: Strength
training 25 x
30”/30” (Core
circuit)
PM: ConE, Fa
(Vol:
80’ / Rpi: 7)
AM: ConE, ConI,
Fa (Vol:
90’ /
Rpi: 7)
Free
AM: Strength
training 25 x
30”/30”
(Core circuit)
PM: ConE, Fa (Vol:
90’ / Rpi: 7)
AM: ConE, Fa (Vol:
100’ / Rpi: 7)
AM: Strength
training 15 x
30”/30” (Core
circuit)
PM: Match +
(45’-45’)
Free
Frequency:# 8
Volume:
485min
Intensity: Rpi: 7
Match: 45min
Intensive endurance phase
Week 2
AM: Con I,
VO2Int, (Vol
80’/
Rpi 10)
PM: Con I,
VO2Int,
(Vol
70’ / Rpi 7)
AM: Con I, VO2Int,
(Vol
80’/Rpi 10)
PM: ≈Strength
training 30x
35”/25”
(Core circuit)
AM: ConI (60’ /
RPi 9)
PM: Match +
(45’-45’)
AM: Con I, VO2Int,
Lint (Vol
80’/Rpi 10)
PM: Con I, VO2Int,
(Vol
60’ / Rpi 8)
AM: VO2Int, LoInt
(Vol
80’/Rpi 11)
PM: Strength
training 30 x
35”/25”
(Core circuit)
AM: ConI (Vol
45’/Rpi 7)
PM: Match +
(60’-30’)
Free
Frequency: #12
Volume:
715min
Intensity: Rpi: 9
Match: 105min
Unloading phase
Week 3
AM: VO2Int,
LoInt (Vol
80’/
Rpi 11)
PM: ConI,
VO2Int, (Vol
60’
/ Rpi 8)
AM: VO2Int, LoInt
(Vol
80’/Rpi 12)
PM: ConI (Vol
45’/
Rpi 9)
AM: ConI (Vol
45’/Rpi 9)
PM: Match +
+(30’-60’)
Free
Free
Free
Free
Frequency: #5
Volume:
340min
Intensity: Rpi:
9.8
Match: 30 min
Table 16.2: Mesocycle volume in preseason
Legend: The training volume is expressed in minutes.
Training intensity is expressed in RPI (rate of perceived intensity).
1: Not very intensive
5: Moderately intensive
10: Normal
15: Intensive
20: Very intensive
Games are indicated by + according to the
strength of the opponent. The more
+’s, the
stronger the opponent. The duration of play is
state between brackets. (75’-15’) means that
one group of players plays for 75 minutes and
another group 15 minutes.
F
IT
N
E
SS
IN
S
O
C
C
E
R
M
a
cr
o
cy
cl
e:
Pr
es
ea
so
n
30
1
[email protected] 06 Aug 2018
Macrocycle Preseason / Mesocycle Intensity
Monday
Tuesday
Wednesday
Thursday
Friday
Saturday
Sunday
VO
phase
2max
Week 4
Free
Free
AM: VO2Int,
LoInt (Vol
80’/
Rpi 12)
PM: Strength
training 30 x
35”/25” (Core
circuit)
AM: MeInt,
ShInt (Vol
90’/
Rpi 12)
PM: VO2Int,
LoInt (Vol
70’/
Rpi 11)
AM: MeInt,
ShInt (Vol
80’/
Rpi 12)
PM: Strength
training 30 x
35”/25” (Core
circuit)
AM: Training
group 2
MeInt, ShInt
(Vol
80’/Rpi 12)
PM: Match +++
(75’-15’)
Free
Frequency: #7
Volume: 535min
Intensity: Rpi: 11.8
Match: 75min
High intensity phase
Week 5
AM: ConI (Vol
60’ / Rpi 9)
PM: VO2Int
(Vol
60’/Rpi 14)
Group 1
AM: VO2Rep
(Vol
60’/Rpi 15)
PM: Strength
training
40”/20”
(Core circuit)
Group 1
AM: LoRep,
MeRep, RSE
(Vol
70’/Rpi 14)
PM: ConI (Vol
30’/Rpi 7)
Group 1
AM: LoRep,
MeRep, ShRep
(Vol
80’/Rpi 14)
PM: Strength
training
40”/20”
(Core circuit)
Group 1
AM: MeRep,
ShRep (Vol
70’/
Rpi 13)
Group 1
PM: Match
++++ (90’-00’)
Group 1
Free
Group 1:
Frequency: #10
Volume: 580min
Intensity: Rpi: 12.2
Match: 90min
Group 2
AM: VO2Rep
(Vol
45’/Rpi 14)
Group 2
PM: Match +++
(90’-00’)
Group 2
AM: ConI (Vol
45’/Rpi 10)
PM: Strength
training
40”/20”
(Core circuit)
Group 2
AM: MeInt,
ShInt (Vol
70’/
Rpi 13)
PM: Strength
training
40”/20”
(Core circuit)
Group 2
AM: VO2Rep
(Vol
90’/Rpi 15)
PM: ConI (Vol
60’/Rpi 11)
Group 2
Free
Group 2:
Frequency: #10
Volume: 580
Intensity: Rpi: 12.2
Match: 90min
Table 16.3: Organization of the mesocycle intensity in preseason
F
IT
N
E
SS
IN
S
O
C
C
E
R
M
a
cr
o
cy
cl
e:
Pr
es
ea
so
n
30
2
[email protected] 06 Aug 2018
Macrocycle Preseason / Mesocycle Intensity
Monday
Tuesday
Wednesday
Thursday
Friday
Saturday
Sunday
speed phase
Week 6
Group 1
AM: COnI (Vol
60’ / Rpi 7)
Group 1
AM: Sp, Res,
RSA (Vol
60’/
Rpi 16)
PM: Strength
training 30x
40”/20”
(Core circuit)
Group 1
AM: Sp, Res,
(Vol
80’/Rpi 15)
PM: ConI (Vol
30’/Rpi 9)
Group 1
AM: Sp (Vol
60’/
Rpi 14)
Group 1
:VO2Int (Vol
45’/Rpi 15)
Group 1
PM: Match
+++++ (90’-00’)
Group 1
Free
Group 1:
Frequency: #8
Volume: 455min
Intensity: Rpi: 12.6
Match: 90min
Group 2
Sp, Res, RSA
(Vol
70’/Rpi 15)
PM: Sp, Res
(Vol
45’/Rpi 13)
Group 2
AM: Sp, Res,
(Vol
45’/Rpi 14)
Group 2
PM: Match ++
+(90’-00’)
Group 2
AM: ConE (Vol
45’/Rpi 9)
PM: Strength
training 30x
40”/20”
(Core circuit)
Group 2
AM: ConI (Vol
60’/Rpi 19)
Group 2
AM: Sp, Res,
RSA (Vol
80’/
Rpi 16)
Group 2
Free
Group 2:
Frequency: 8
Volume: 465min
Intensity: Rpi: 12.6
Match: 90min
Tapering phase
Group 1
PM: ConI (Vol
45’/Rpi 9)
AM: VO2Rep
b(Vol
80’/Rpi
16)
Free
AM: VO2Int (Vol
75’/Rpi 14)
AM: MeInt (Vol
45’/Rpi 12)
27
Match (League)
Free
Frequency: #6
Volume: 335min
Intensity: Rpi: 13
Match: 90
Group 2
PM: LoInt (Vol
70’/Rpi 14)
Table 16.4: Organization of the mesocycle intensity in preseason
F
IT
N
E
SS
IN
S
O
C
C
E
R
M
a
cr
o
cy
cl
e:
Pr
es
ea
so
n
30
3
[email protected] 06 Aug 2018
FITNESS IN SOCCER
Macrocycle: Preseason
304
Frequency
14
12
10
8
6
4
2
0
Extensive endurance Intensive endurance
Unloading phase
VO2max phase High intensity phase
Speed phase
Tapering phase
phase
phase
Fig. 16.2: Evolution of frequency in preseason
Volume
800
700
600
500
400
300
200
100
0
Extensive endurance
phase
Intensive endurance
phase
Unloading phase
VO2max phase
High intensity phase
Speed phase
Tapering phase
Fig. 16.3: Evolution of volume in preseason
[email protected] 06 Aug 2018
FITNESS IN SOCCER
Macrocycle: Preseason
305
Intensity
14
13
12
11
10
9
8
7
6
5
4
Extensive endurance phase Intensive endurance phase
Unloading phase
VO2max phase
High intensity phase
Speed phase
Tapering phase
Fig. 16.4: Evolution of intensity in preseason
SUMMARY
The objectives of preseason are to prepare the team technically, tactically and
physically for the forthcoming competitive season. Unfortunately, most coaches
train players with too much intensity and volume during preseason training,
especially during preseason camps. This leads to players accumulating too much
fatigue and sustaining injuries, even before the season begins! Coaches should
gradually increase the duration and intensity of training throughout the pre-
season period. It is also important for coaches to prepare their teams tactically
during this period and not place all the emphasis on fitness training. Tactical,
technical and fitness aspects can be trained simultaneously, as discussed in the
previous chapter. Friendly games can be arranged strategically during presea-
son, so players are exposed gradually to playing 90 minutes of match play, as
well as getting used to the playing style and tactics of the team.
[email protected] 06 Aug 2018
FITNESS IN SOCCER
306
Macrocycle: Preseason
REFERENCES
•
Amigo, N., Cadefau, J.A., Ferrer, I., Tarados, N., and Cusso, R., 1998. Effect of summer intermission on skeletal muscle of adolescent
soccer players. Journal of Sports Medicine and Physical Fitness, 38(4), pp.298–304.
•
Bangsbo, J., Mohr, M. and Krustrup, P., 2006. Physical and metabolic demands of training and match-play in the elite football player.
Journal of Sports Sciences, 24, pp.665–674.
•
Bangsbo, J. and Mizuno M., 1988. Morphological and metabolic alterations in soccer players with detraining and retraining and their
relation to performance. In: T. Reilly, A. Lees, K. Davids, W.J. Murphy, eds. 1988. Science and Football. London/New York: E and FN
Spon. pp.114-124
•
Bangsbo, J., 1994a. Physical conditioning. In: B. Ekblom, ed. 1994. Football (Soccer). Oxford: Blackwell Scientific. pp.124–138.
•
Bangsbo, J., 1994b. The physiology of soccer – With special reference to intense intermittent exercise. Acta Physiologica Scandinavica,
151: pp.1–155.
•
Bangsbo, J., Mohr, M. and Krustrup, P., 2006. Physical and metabolic demands of training and match-play in the elite football player. J
Sports Sci., 24(7), pp.665-74.
•
Casamichana, D., Castellano, J. and Castagna, C., 2012. Comparing the physical demands of friendly matches and small-sided games in
semiprofessional soccer players. J Strength Cond Res, 26(3), pp.837–843.
•
Cooper, K. H., 1968. A means of assessing maximal oxygen uptake. Journal of the American Medical Association, 203, pp.201-204.
•
Ekstrand J. and Gillquist J., 1983. The avoidability of soccer injuries. Int J Sports Med, 4(2), pp.124-8.
•
Helgerud J., Wisløff, U., Engen L. and Hoff, J., 2001. Aerobic endurance training improves soccer performance. Medicine and Science in
Sports and Exercise, 33(11), pp.1925-1931
•
Jeong, T.S., Reilly, T., Morton, J., Bae, S.W. and Drust, B., 2011. Quantification of the physiological loading of one week of “pre-season”
and one week of “in-season” training in professional soccer players. Journal of sports sciences, 29(11), pp.1161-6.
•
Impellizzeri, F.M., Marcora, S.M., Castagna, C., Reilly, T., Sassi, A. and Iaia, F.M., 2006. Physiological and performance effects of generic
versus specific aerobic training in soccer players. International Journal of Sports Medicine, 27, pp.483–492
•
Magarey, M.E., Esterman, A., Speechley, M., Scase, E. and Heynene, M., 2013. The relationship between preseason fitness testing and
injury in elite junior Australian football players. Journal of Science and Medicine in Sport, 16(4), pp.307–311.
•
McMillan, K., Helgerud, J., Grant, S., Newell, J., Wilson, J., Macdonald, R., and Hoff, J., 2005. Lactate threshold responses to a season of
professional British youth soccer, Br J Sports Med, 39, pp.432-436.
•
Reilly, T., 2007. The training process. In: The science of training – soccer: A scientific approach to developing strength, speed and end-
urance. London: Routledge. pp.1–19.
•
Reilly, T., Morton, J., Sang-Won Bae, Drust, B, Tae-Seok Jeong, 2011. Quantification of the physiological loading of one week of “pre-sea-
son” and one week of “in-season” training in professional soccer players. Journal of Sports Sciences, 29(11), pp.1161–6.
•
Reilly, T., Atkinson, G. and Waterhouse J., 1997. Travel fatigue and jet-lag. J Sports Sci, 15(3), pp.365-9.
•
Reilly, T., 1997. Energetics of high-intensity exercise (soccer) with particular reference to fatigue. J Sports Sci, 15, pp.257-263.
•
Stone N.M. and Kilding A.E., 2009. Aerobic Conditioning for Team Sport Athletes. Sports Med, 39(8), pp.615-642
[email protected] 06 Aug 2018
FITNESS IN SOCCER
Macrocycle: in-season
307
17
MACROCYCLE: IN-SEASON
Jan Van Winckel, Werner Helsen, Jean-Pierre Meert, Kenny McMillan, Paul Bradley
17.1 INTRODUCTION
In the preceding chapter, we discussed planning strategies during preseason. In
this chapter, we will discuss how the in-season phase can be structured. The match
is the most important event of the week during in-season, and everything is there-
fore focused on attaining optimum performance on that day.
Team success can be partly attributable to the planning and execution of appropri-
ate in-season training periodization strategies. As explained in the previous chap-
ter that discusses fatigue management, planning during the in-season period is
focused on performance stabilization. It comprises four phases in each microcycle:
recovery, loading, tapering, and the match. The load can only be varied in the loa-
ding phase of every microcycle.
17.2 DURATION OF THE MESOCYCLE
17.2.1 Terminology
When a periodization phase of three to six weeks is mentioned in the literature, this
refers to the mesocycle. For the in-season phase however, we opt for a three-phase
mesocycle.
It is difficult to prove the efficiency of a three-, four-, five-, or six-phase mesocycle
in soccer. There are so many factors influencing a match that it is almost impossible
to design research that empirically and quantitatively proves a three-phase cycle
to be more advantageous than its six-phase counterpart. The issue of periodization
during the in-season period is based on best practice rather than evidence-based
findings. Although we have tried to present relevant research findings where possi-
ble, most of the concepts discussed in this chapter are intuitive or anecdotal. Howe-
ver, it would be helpful for researchers to report findings that could add to the
evidence base and therefore fully support or reject these anecdotal reports. Before
looking at the structure of the mesocycle in detail, we first set out a number of prin-
ciples to explain why we opt for a three-phase cycle during in-season.
[email protected] 06 Aug 2018
FITNESS IN SOCCER
Macrocycle: in-season
308
17.2.2 Metabolic training versus neural adaptation
One criteria for defining the duration of the mesocycle could be based on whether
the aim of training is metabolic or neural in nature (Nádori et al., 1989). Longer
cycles are suggested for metabolic training and rebuilding fitness during presea-
son, and shorter cycles are suggested for neural adaptation in order to stabilize
performance during in-season.
17.2.3 Accumulated fatigue
Zatsiorsky (1995) eluded that long periods of high-intensity training quickly resul-
ted in fatigue. The body needs a period of relative rest (unloading) after a few
weeks of training (loading). This gives the player time to recover and convert the
work produced into functional adaptations (supercompensation). For this reason,
after a two-week training period, we typically schedule a week of active rest (unloa-
ding) where the intensity is kept high while volume and frequency are reduced.
17.2.4 Detraining
One of the shortcomings of multi-phase mesocycles is that it takes a while before
a specific physical ability (PA) is trained (e.g., speed, aerobic endurance, power). If
a PA is not trained for a period of six to ten days, detraining occurs (Arciero et al.,
1998), and this causes the performance level of that PA to compromise the player’s
overall physical performance. In addition, that specific PA will decrease to such an
extent that retraining it will take longer than it took to lose it.
17.2.5 Concurrent training
Several team sports require different PAs, such as endurance, power, speed and
strength. For example, in a soccer game, a player may be required to sprint past
his or her opponent to score a goal (explosive power), deliver a hard body check
(strength and muscularity), and run 11 km in a single game (endurance). The inclu-
sion of resistance training (to gain strength, hypertrophy, and power) combined
with aerobic exercise (to enhance endurance) in a single program is known as con-
current training (Wilson et al., 2012). The biggest issue that can arise from this sort
of programming is that the two or three PAs that coaches are looking to enhance
often end up competing with each other for adaptation. In soccer, however, unlike
some other sports (e.g., 100m sprint, cycling, marathon running, etc.), it is unneces-
sary to reach the maximum genetic potential for every PA required. Soccer players
must develop all the required PAs, but with specific individual adjustments accor-
ding to a player’s technical ability and position.
17.2.6 Adaptability
A three-phase mesocycle is easier to adapt and therefore more flexible than a six-
week cycle. This gives the coach the possibility of adjusting his or her planning
more easily.
[email protected] 06 Aug 2018
FITNESS IN SOCCER
Macrocycle: in-season
309
17.3 ORGANIZATION OF THE MESOCYCLE
The three-phase mesocycle is repeated in the competition macrocycle (in-season).
17.3.1 Physical abilities: Parallel or concurrent training
We explained the various possibilities for organizing a training plan in the chap-
ter about periodization. In this book, we opt for a parallel/concurrent approach,
where all PAs are trained simultaneously.
17.3.2 Physical parameters: Linear (volume) and undulating (intensity)
Volume decreases linearly in each mesocycle, while intensity increases at first and
then decreases in the unloading week.
17.3.3 Workload: Reverse step loading
Finally, we prefer “reverse step loading.” The load is decreased each week due to a
decrease in volume. The intensity is retained as much as possible in order to coun-
teract the detraining effect.
Fig. 17.1: Three-phase mesocycle
17.3.4 Neutral week
In weeks (microcycles) with midweek competitive matches, it is important to incor-
porate a neutral week and defer the mesocycle by one week.
[email protected] 06 Aug 2018
FITNESS IN SOCCER
Macrocycle: in-season
310
17.4 THREE PHASES OF THE
“IN-SEASON” MESOCYCLE
17.4.1 Volume phase
• Objective: The objective of the volume phase is to improve aerobic fitness, and
especially the central component. At intensities close to the lactate threshold
(~70–80% VO
2max , physiological adaptations occur primarily in the peripheral
component. Significant peripheral adaptation occurs, with substantial changes
in muscle capillarization, oxidative enzyme activity, mitochondrial volume and
density, myoglobin, and the preferential use of free fatty acids as an energy sub-
strate. It is therefore important to use exercises where the players are constantly
moving (e.g., passing drills or tactical exercises where the players are forced
to cover long distances). Other exercises include possession games where the
players are given certain tasks, meaning there are few or no breaks.
• Periodization: The emphasis is placed on volume during this week. The PAs of
speed and strength are maintained. Strength endurance is trained as well while
trying to avoid interference with endurance.
• Physical ability: Aerobic capacity
• Methods (See chapter 5): Continuous extensive, continuous intensive,
• Training parameters:
- volume: 100%
- intensity: 70%
- frequency: 100%
• Strength: Strength endurance
17.4.2 Intensity phase
• Objective: The objective of the intensity week is to improve aerobic power,
repeated sprint ability, and SAQ (speed, agility, quickness). This is done
using High-intensity intermittent training (HIIT). These adaptations include
an improvement in the heart’s capacity to pump blood, primarily through
increased stroke volume, which occurs because of an increase in end-diastolic
volume and an increase in left ventricular mass. Subsequently, these adaptati-
ons result in an increased cardiac output, which, according to the Fick equation,
will increase VO
2max (Stone and Kilding, 2009).
• Periodization: The emphasis is on intensity during this week. The PAs of aerobic
fitness, repeated sprint ability, speed, agility, quickness, and acceleration are
trained.
• PAs: Speed, agility, quickness, aerobic power
• Methods: (See chapter 6) Interval, repetition, SAQ, RSA
• Training parameters:
- volume: 70%
- intensity: 90%
- frequency: 85%
• Strength: Speed strength and maximum strength
[email protected] 06 Aug 2018
FITNESS IN SOCCER
Macrocycle: in-season
311
17.4.3 Unloading phase
• Objective: The objective of the unloading phase is physical, neural and mental
recovery. This is mainly achieved by reducing the frequency and volume of
training. During this week, players are given the opportunity to recover from
the load they have experienced over the previous two weeks. Intensity is kept
fairly high to ensure that any loss of fitness (detraining) is minimized. It is
through reductions in the other training parameters (volume, frequency and
duration) that recovery should be realized.
• Periodization: All of the physical abilities are maintained during this week.
There is no aim to improve any particular PA.
• PAs: Maintenance with the emphasis on soccer-specific exercises and mental
and physical recovery
• Methods: Continuous and HIIT methods at max 90%.
• Training parameters:
- volume: 50%
- intensity: 80%
- frequency: 65%
17.5 REMARKS
17.5.1 Length of the different phases
The length of a microcycle can vary in every mesocycle. In soccer, a microcycle is
often equated to seven days, but this is not always necessary. A three-phase meso-
cycle can last two or five weeks, depending on the number and timing of matches.
As we have already explained before, a periodized plan should be adapted accor-
ding to the match schedule.
17.5.2 Periodization of speed
Within this periodization model, each ability related to speed, agility and quick-
ness (SAQ) (e.g., repeated sprint ability, speed, agility, etc.) should be trained every
week to avoid detraining.
Match
Recovery
Recovery
Loading
Loading
Tapering
Tapering
Match
G
+1
+2
-4
-3
-2
-1
G
No
No
Speed
endurance
Repeated
sprint
ability
SAQ
Short
maximal
sprints
with
sufficient
(1/10)
recovery
Table 17.1: Periodization of speed
[email protected] 06 Aug 2018
17.5.3 Use of small-sided games
Phase
Volume phase
Intensity phase
Unloading phase
Numbers
4><4 to 7><7
3><3 to 1><1
3><3 to 1><1
Duration
3 to 6 minutes
1 to 3 minutes
30 seconds to 2 minutes
Game 1
4 minutes and 2’ recovery
1&2 -
3&4 :
5&6 -
7&8 :
Game 2
4 minutes and 2’ recovery
1&5 -
2&6 :
3&7 -
4&8 :
Game 3
4 minutes and 2’ recovery
5&7 -
6&8 :
1&3 -
2&4 :
Game 4
4 minutes and 2’ recovery
2&7 -
3&6 :
1&4 -
5&8 :
Game 5
4 minutes and 2’ recovery
1&6 -
5&4 :
3&7 -
2&8 :
Game 6
4 minutes and 2’ recovery
1&7 -
2&3 :
4&6 -
5&8 :
Game 7
4 minutes an
d 2’ recovery
3&8 -
4&7 :
1&8 -
2&5 :
Table 17.2: Example of small-sided games in a competition format (Volume phase).
There are eight teams of three players each. In the first game, teams 1 and 2 play together against teams 3 and 4. Teams 1 and 2 start the game, while teams 3 and 4
wait behind the respective goal line. If the ball goes over the goal line of team 1, team 2 can immediately dribble with the ball and try to score. Team 1 then has to leave
the pitch immediately. If the ball crosses the goal line of team 3 (or a goal is scored), team 4 can dribble with the ball and try to score. At least one pass has to be made
each time. No corner kicks are awarded. This game exercise lasts for five minutes.
F
IT
N
E
SS
IN
S
O
C
C
E
R
M
a
cr
o
cy
cl
e:
in
-s
ea
so
n
31
2
[email protected] 06 Aug 2018
FITNESS IN SOCCER
Macrocycle: in-season
313
Player(s)
Players(s)
Result
Duration
1
-
1
30
”
2,3
-
2,3
60”
4.5.6
-
4.5.6
90”
1,2,3,4
-
1,2,3,4
120”
5
-
5
30”
6,1
-
6,1
60”
1,2,3
-
1,2,3
90”
4,5,6,1
-
4,5,6,1
120”
2
-
2
30”
3,4
-
3,4
60”
5,6,1
-
5,6,1
90”
2,3,4,5
-
2,3,4,5
120”
6
-
6
30”
1,2
-
1,2
60”
3,4,5
-
3,4,5
90”
6,1,2,3
-
6,1,2,3
120”
4
-
4
30”
5,6
-
5,6
60”
1,2,3
-
1,2,3
90”
4,5,6,1
-
4,5,6,1
120”
3
-
3
30”
4,5
-
4,5
60”
6,1,2
-
6,1,2
90”
3,4,5,6
-
3,4,5,6
120”
Table 17.3: Example of a competition format (intensity phase). There are two teams of six players.
Each player is given a number. Games of 1><1 to 4><4. The players with the number 1 play against
each other for 30 seconds, and players 2 and 3 then play 2><2 against players 2 and 3 from the
other team for 60 seconds, and so on.
Tips for organizing small-sided games (SSGs)
• Agree on a reward or punishment for the winning or losing team before the
practice. This will provide extra motivation for the players.
• Keep track of the individual scores throughout the season.
• Organize the teams so the competitive environment remains as wide as possi-
ble. In the 4v4 games, for example, teams of two players can be made to play
with another pair against two new pairs each time. This increases the intensity
of the games.
• Make sure enough balls are available.
• Organize pitch sizes with different dimensions and rules. This enables the
players to work in different training zones and makes it easier to set up diffe-
rent training plans for individual players.
[email protected] 06 Aug 2018
FITNESS IN SOCCER
Macrocycle: in-season
314
17.5.4 Pre-training routines
Pre-training routines comprise:
• Pre-activation exercises
• Injury prevention
• Core stability
• Core endurance (dynamic)
• Core strength (dynamic)
• Dynamic mobility
• Functional strength
• Dynamic stretching
• Neuromuscular control
Pre-training routines can be performed
before the start of each training session
and have the additional benefit that the
players are better prepared for the next
training session. These sessions last bet-
ween 20 and 30 minutes and are best
done indoors.
17.5.5 Flexibility training
Flexibility training is an element of injury prevention. Static stretching is best orga-
nized at the end of a training session. The temperatures of the muscles are still high,
so this is an ideal time to increase flexibility. Passive or active stretching should not
be used before the start of a training session (see the Chapter 19).
17.5.6 Freshness sprints
The duration of the training session should be reduced by around 50% on the day
before a match. Training should last at the most 45–60 minutes in order to pro-
vide the players with the freshness they need for the match. However, the intensity
should be kept sufficiently high (80%). This is done by playing small-sided games
for a maximum of two minutes with sufficient recovery and short maximal sprints.
17.5.7 Home programs
Soccer players are individual athletes who play together in a team on match day.
Every player is different, and each player needs a different load to make progress.
Training in soccer is too often adapted to the average player, meaning that physi-
cally weaker players are overloaded, while the physically stronger players are
subjected to an insufficient load (Hoff et al., 2002). Hence, there has to be a good
balance between tactical sessions, where the players train in a group, and indivi-
dual sessions to improve players.
One of the tools a soccer coach can use to individualize training is the use of home
programs. These home programs have many advantages. Players do not lose any
time, so they have more time to recover and can adjust their training to their family/
work/school situation. In addition, training can be easily adjusted to a player’s
individual needs. These training sessions can also be checked using HR monitors
or GPS devices. Thus, home programs are ideal for non-professional players, but
they can also be used for professional players, especially during recovery sessions.
[email protected] 06 Aug 2018
FITNESS IN SOCCER
Macrocycle: in-season
315
17.5.8 Use of shooting exercises
Shooting exercises are popular among soccer players. Although such drills are fun
to do, they can produce a local overload within the muscles that are involved. Addi-
tionally, these shooting exercises are often not used specifically in the context of the
game. For example, allowing central defenders, who rarely go forward during a
match, to shoot continuously at the goal is not only pointless; it also increases the
local load of the muscles. These shooting exercises often result in exercise-induced
muscle damage (EIMD), and this can lead to strain-type muscle injuries.
A few guidelines:
• No shooting exercises less than 48 hours after a match (recovery phase) or less
than 48 hours (tapering phase) before a match.
• Integrate shooting only if players are not fatigued and are fully warmed up.
17.6 INDIVIDUAL PERIODIZATION
Individual periodization involves the individual planning and adjustment of load
for each player. For example, older players may get an extra day off or be allo-
wed to skip the afternoon session. Alternatively, players may be given a different
role (neutral player or joker) during a game or possession drill. Improving players
and allowing them to reach their maximum genetic potential requires structured
planning.
17.6.1 Age
The rate at which physiological adaptation occurs is variable (Vollaard et al., 2009)
and seems to depend on the volume, intensity and frequency of training. Impor-
tantly, the development of physiological capacities seen in elite athletes does not
occur quickly, and it may take many years of high training loads before peak levels
are reached (Laursen, 2010). Young soccer players often struggle to cope with the
increased training load. Rapid increases in training frequency, and thus training
load (sometimes up to 100%), during the transition from youth to elite football can
be difficult for young players to process.
The body’s ability to recover after training and matches also changes with age. With
increased age, the muscles’ ability to repair and adapt is diminished. This could be
caused by a decrease in muscle capillarization and mitochondrial activity (Du et
al., 2005; Fell and Williams, 2008). Older players may recover more slowly from
training and matches, so they may need more time between successive sessions.
17.6.2 Weight/BMI
Players with a higher body weight experience a higher mechanical load on their
joints. When changing direction, the load can be five times the body weight (or
even up to ten times body weight for a vertical jump [Ortega et al., 2010]). This
mechanical load is consequently higher for heavier players than it is for lighter
ones. One match involves approximately 1,300 changes in activity (Chaouachi et
al., 2012). The mechanical impact on players is therefore higher compared to play-
ers who are not so heavy in relation to their height. In this regard, Bourne et al.
(2005) reported a decrease of cartilage cell viability when applying impact loading
to an animal knee at higher energy and increasing loading repetitions. However
it should be highlighted that only limited conclusions can be derived from these
[email protected] 06 Aug 2018
FITNESS IN SOCCER
Macrocycle: in-season
316
reports in regards to the human articular cartilage properties in vivo (Brüggemann,
2011). As discussed in previous chapters, data from accelerometers in GPS devices
may be used to quantify the body load placed on players to allow monitoring to
take place, especially for players more prone to injuries.
17.6.3 Players returning from injury
A player who has sustained a hamstring injury, for example, can skip a training
session to allow him to work on the functional strength of his or her hamstrings
and other muscle groups to improve functionality and reduce the reoccurrence of
injuries.
17.6.4 Fast and slow players
Fast players can often have a higher proportion of fast-twitch fibers, while slower
players frequently have a larger proportion of slow-twitch fibers. Both types of
players will therefore respond differently to training stimuli. Quick players (e.g.,
strikers, wide players) with less aerobic potential do not endure high loads as well
as players who are not as fast (e.g., central players in midfield and defense).
17.6.5 Players with a history of injury
A previous injury is an important risk factor for soccer injury (Hägglund et al.,
2006). Before the start of the season, it is important to get an idea of each play-
er’s injury history. In soccer, questionnaires have been used at various skill levels
to obtain information about the sports and medical histories of players, including
previous injuries (Steffen et al., 2008). Training content can then be adapted based
on the injury history.
Two examples:
• A player who has suffered a cartilage injury: The number of impact training
(mechanical load) sessions needs to be reduced for this player.
• A player with a history of muscle injury (e.g., hamstrings): This player needs
to follow a special program to restore muscle strength and balance.
17.6.6 Players with minor physical problems
The literature describes two types of injuries. A player able to train but with redu-
ced intensity or volume is classified as an “injured player.” These injuries are refer-
red to as “time loss injuries” (TL). In addition to this, Fuller et al. (2006) introduced
the concept of medical attention injuries (MA). These injuries specifically refer to
medically diagnosable complaints without a time loss from competition or training.
In this respect, it is different from, and complementary to, the time loss definition,
because it will not be recorded as an injury while the player fully participates in
team training and competition. A quarter of these injuries eventually lead to a time
loss injury. In an unpublished study of Helsen et al. (2010), MA injuries as a pre-
dictor of subsequent injury was investigated. The researchers concluded that more
than a quarter (26%) of MA injuries resulted in a TL injury within a year. MA inju-
ries should be considered a valuable predictor of reinjury. Their monitoring and
follow-up are key factors within a multidisciplinary injury-prevention approach.
A specially adapted training schedule can be incorporated into the weekly plan to
eliminate a possible maladaptation.
[email protected] 06 Aug 2018
FITNESS IN SOCCER
Macrocycle: in-season
317
17.6.7 Player role
Midfield players, full backs and wingers often experience a higher load during
training sessions compared to central defenders or strikers. Wingers and full backs
often have a higher physiological load because of the regular use of crosses in tacti-
cal exercises. In these exercises, wingers and full backs have to cover more distance
than other positions in the team. Midfield players on the other hand often experi-
ence a higher mechanical load due to the demands of their position. They cover
shorter distances but make more changes in direction.
17.7 HOW TO IMPLEMENT INDIVIDUAL PERIODIZATION
There are many ways to implement individual periodization, so it is therefore
necessary to differentiate as much as possible. Exercises must be specific and the-
refore directed toward the requirements of a specific position. This means that the
technical, tactical and individual physical periodization of this player should be
adjusted according to the player’s role and characteristics. A professional team
with a high number of coaches should therefore ensure they work with the players
as individually and specifically as possible. This approach has proved to be suc-
cessful in some studies. Andrzejewski et al. (2010), for example, demonstrated a
significant impact of the individualization of training loads on the development of
speed abilities in the examined players.
17.7.1 Adjustments in frequency
Players can skip training sessions or take part in additional training sessions.
17.7.2 Adjustments in volume/duration
Coaches can individualize training load by varying the duration of training for
individual players. A good example of this is the real-time monitoring of small-si-
ded games. Adjustments in load can be made directly after the small-sided games.
17.7.3 Adjustments during training sessions
Group training sessions can, and should, be specific. Consider a winger who con-
stantly has to run along the flank during a tactical exercise in order to deliver a
cross. Although the task of this player is specific, coaches do not always consider
the additional training load for that player. Another example is a player taking
dozens of corner kicks, leading to increased local fatigue of the leg muscles.
17.7.4
Adjustments during small-sided games
A coach can schedule small-sided game tournaments in order to assign more or less
load to individual players. Certain players can take part in a greater or fewer short
games. For example, one player may need to play a series of only eight 4-minute 4
vs. 4 games, while another player performs twelve. You can also choose to vary the
pitch dimensions to change the dynamic of the game. For instance certain players
could always play on a bigger pitch rather than take part in SSGs to reduce the
amount of mechanically intensive accelerations and decelerations performed.
[email protected] 06 Aug 2018
FITNESS IN SOCCER
Macrocycle: in-season
318
SUMMARY
Planning during the in-season period is mainly focused on performance stabi-
lization. The weekly program usually comprises four phases in each microcy-
cle: recovery from the last match, loading, tapering, and the match. The aims of
the training week are to maintain the players’ fitness (or indeed improve fitness
where possible) while performing technical and tactical drills and ensuring that
the players go into the next match as fresh and as free from fatigue as possi-
ble, as well as being technically and tactically prepared. Each player’s training
program should be individualized as much as possible. Technical, tactical and
fitness work periodization of this player should be adjusted according to the
player’s role, characteristics, and fitness/fatigue levels.
Physical
ability
Methodical
Training
Training
Methods
Abbreviation
Volume
(min)
Repititions
Intensity
(Hfmax) %
Aerobic
endurance
Continuous
principle
(without
recoveries)
Long slow
distance
LSD
60 - 100
1
60
Continuous
extensive
ConE
15 - 30
1-4
70
Variable
endurance
method
CV
30 - 45
1-3
60-100
Fartlek variable
method
Fa
30 - 45
1-3
60-100
Continuous
intensive
ConI
8-15
3-5
75
Anaerobic
endurance
Interval
principle
(incomplete
recoveries)
Interval method (Medium to intensity, medium to high volumes)
VO
interval
2max
VO Int
2
5-8
6-12
85-90
Long interval
loads
Lint
3-5
5-8
90-95
Medium interval
loads
Mint
1-3
8-15
90-95
Short interval
loads
Sint
30-60sec
10-20
90-95
Repetition method (High intensity, limited to low to medium volumes)
VO
repetition
2max
VO Rep
2
4
6-12
90-100
Long repetition
load
LRep
2-3
3-5
95-100
Medium repetition MRep
1-2
8-12
95-100
Short repetition
loads
Srep
15-60sec
8 tot 10
95-100
Repeated
sprint
Repetition
principle
(incomplete
recoveries)
Repeated sprint
exercises
RSE
3-7s
3-8
-
Resistance
Interval
principle
(against
resistance)
Sets of explosive
sport-specific
movements
Res
Various
depending
on
exercises
5-15
-
Speed
Repetition
principle
(complete
recoveries)
Maximal
contraction speed
method
Sp
3-7s
10-20
-
Table 17.4: Overview of the physical abilities and their abbreviations used in the following
microcycles
[email protected] 06 Aug 2018
Volume phase elite level
Match day
(e.g. Saturday)
+1 (Sunday)
+2 (Monday)
-4 AM
(Tuesday)
-4 PM
(Tuesday)
-3 AM
(Wednesday)
-3 PM
(Wednesday)
-2
(Thursday)
-1
(Friday)
Match
(Saturday)
Total
Fatigue
management
Recovery
strategies
Recovery
strategies
Loading
strategies
Loading
strategies
Loading
strategies
Loading
strategies
Tapering
strategies
Tapering
strategies
Frequency (#)
1
Free
2
2
1
1
# training
sessions: 7
Volume (min)
45
70
100
70
(40) VO2 max
individual
65
50
# Minutes: 440
min
Intensity (%)
50%
60%
>75%
65%
80
65
75%
Average
intensity: 67%
SAQ
None
Long sprint
(80%)
Repeated
sprint ability
Coordination
and agility
None
Speed
Freshness
sprints
Strength
endurance:
Strength/Core/
Stretch
None
Strength
endurance /
Core circuit
None
Dumbbell
and barbell
upperbody
None
Core
stability
and
flexibility
Preactivation
# training
sessions: 4
Training
methods
ConE
ConI
Vo2Int, LoInt,
MeInt,
ConI, VO2
Int, LoInt
ConE, ConI,
Fa, VO2Int
ConI,
VO2Int,
LoInt
LoInt, MeInt
Training forms
Cross-
country
running /
cycling /
aquajogging
/ deep water
running
Possession
games /
passing and
shooting drills
/ tactical drills
Small sided
games 7v7
to 4v4
Possession
games /
passing and
shooting drills
/ tactical drills
Non-impact
training /
physiological
load
Tactical
drills / Set
pieces
Short small
sided games
(max. 2’)
Individual
periodization
Free / Home
work
Free / Less
or more small
sided games
Free /
Differentiation
in intensity
and volume
Table 17.5: Volume microcycle during in-season (elite level)
F
IT
N
E
SS
IN
S
O
C
C
E
R
M
a
cr
o
cy
cl
e:
in
-s
ea
so
n
31
9
[email protected] 06 Aug 2018
Volume phase semi-professional level
Match day
(e.g. Sunday)
+1 (Monday)
+2 (Tuesday)
-4 (Wednesday)
-3 Thursday)
-2 (Friday)
-1 (Saturday)
Match
(Sunday)
Total
Fatigue
managment
Recovery
strategies
Recovery
strategies
Loading
strategies
Loading
strategies
Tapering
strategies
Tapering
strategies
Frequency (#)
1
Free
1
1
1
# training
sessions: 4
Volume (min)
45
100
90
50
# Minutes: 285
min
Intensity (%)
50%
>75%
70%
75%
Average
intensity: 67%
SAQ
None
Repeated sprint
ability
Coordination
and agility
Freshness
sprints
Strength
endurance:
Strength/Core/
Stretch
None
Strength
endurance /
Core circuit
Dumbbell
and barbell
upperbody
Preactivation
# training
sessions: 3
Training
methods
ConE
Vo2Int, LoInt,
MeInt,
ConI, VO2 Int,
LoInt
LoInt, MeInt
Training forms
Cross-country
running / cycling
/ aquajogging
/ deep water
running
Small sided
games 7v7 to
4v4
Possession
games /passing
and shooting
drills / tactical
drills
Short small
sided games
(max. 2’)
Individual
periodization
Free / Home
work
Less or more
small sided
games
Table 17.6: Volume microcycle during in-season (semi-professional level)
F
IT
N
E
SS
IN
S
O
C
C
E
R
M
a
cr
o
cy
cl
e:
in
-s
ea
so
n
32
0
[email protected] 06 Aug 2018
Volume phase amateur level
Match day (e.g.
Sunday)
+1 (Monday)
+2 (Tuesday)
-4 (Wednesday)
-3 Thursday)
-2 (Friday)
-1 (Saturday)
Match
(Sunday)
Total
Fatigue
managment
Recovery
strategies
Recovery
strategies
Loading
strategies
Loading
strategies
Tapering
strategies
Tapering
strategies
Frequency (#)
1
Free
1
1
1
# training
sessions: 3
Volume (min)
45
90
70
20
60
# Minutes: 220
min
Intensity (%)
50%
>75%
65%
85
60%
Average
intensity: 67%
SAQ
None
Repeated sprint
ability
Coordination
and agility
Freshness
sprints
Strength
endurance:
Strength/Core/
Stretch
None
Core circuit
# training
sessions: 1
Training
methods
ConE
Vo2Int, LoInt,
MeInt,
ConI, VO2 Int,
LoInt
LoInt
LoInt, MeInt
Training forms
Cross-country
running / cycling
/ aquajogging
/ deep water
running
Small sided
games 7v7 to
4v4
Possession
games /passing
and shooting
drills / tactical
drills
Cross-country
running (5 x 2’
at 85% with 2’
rec.)
Short small
sided games
(max. 2’)
Individual
periodization
Free / Home
work
Free /
Differentiation
in intensity and
volume
Gray: Possible home program
Table 17.7: Volume microcycle during in-season (amateur level)
F
IT
N
E
SS
IN
S
O
C
C
E
R
M
a
cr
o
cy
cl
e:
in
-s
ea
so
n
32
1
[email protected] 06 Aug 2018
Intensity phase elite level
Match
day (e.g.
Saturday)
+1
(Sunday)
+2
(Monday)
-4 AM
(Tuesday)
-4 PM
(Tuesday)
-3 AM
(Wednesday)
-3 PM
(Wednesday)
-2
(Thursday)
-1
(Friday)
Match
(Saturday)
Total
Fatigue
management
Recovery
strategies
Recovery
strategies
Loading
strategies
Loading
strategies
Loading
strategies
Loading
strategies
Tapering
strategies
Tapering
strategies
Frequency (#)
1
Free
2
2
1
1
# training
sessions: 7
Volume (min)
45
55
65
55
20
55
40
# Minutes:
335
Intensity (%)
50%
75%
>90%
75%
90%
60%
80%
Average
intensity:
74%
SAQ
None
Long sprint
(80%)
Repeated
sprint ability
Coordination
and agility
None
Speed
Freshness
sprints
Strength
endurance:
Strength/Core/
Stretch
None
Core circuit
Dumbbell
and barbell
upperbody
None
Core stability
and flexibility
Preactivation
# training
sessions: 4
Training
methods
ConE
ConI
Vo2Rep,
LoRep,
MeRep,
VO2int
ConI, VO2 Int,
LoInt
ConE, ConI,
Fa, VO2Int
ConI, VO2Int,
LoInt
MeRep,
MeInt
Training forms
Cross-country
running /
cycling /
aquajogging
/ deep water
running
Possession
games /
passing and
shooting drills
/ tactical drills
Small sided
games 3v3
to 1v1
Possession
games /
passing and
shooting drills
/ tactical drills
Non-impact
training /
physiological
load
Tactical drills /
Set pieces
Short small
sided games
(max. 90”)
Individual
periodization
Free / Home
work
Free / Less
or more
small sided
games
Free /
Differentiation
in intensity
and volume
Table 17.8: Intensity microcycle during in-season (elite level)
F
IT
N
E
SS
IN
S
O
C
C
E
R
M
a
cr
o
cy
cl
e:
in
-s
ea
so
n
32
2
[email protected] 06 Aug 2018
Intensity phase semi-professional level
Match day
(e.g. Sunday)
+1 (Monday)
+2 (Tuesday)
-4 (Wednesday)
-3 Thursday)
-2 (Friday)
-1 (Saturday)
Match
(Sunday)
Totaal
Fatigue
managment
Recovery
strategies
Recovery
strategies
Loading
strategies
Loading
strategies
Tapering
strategies
Tapering
strategies
Frequency (#)
1
Free
1
1
1
# training
sessions: 4
Volume (min)
45
70
60
40
# Minutes: 215
min
Intensity (%)
50
>90%
75%
80%
Average
intensity: 74%
SAQ
None
Repeated sprint
ability
Coordination
and agility
Freshness
sprints
Strength
endurance:
Strength/Core/
Stretch
None
Core circuit
Dumbbell
and barbell
upperbody
Preactivation
# training
sessions: 3
Training
methods
ConE
Vo2Rep, LoRep,
MeRep, VO2int
ConI, VO2 Int,
LoInt
MeRep, MeInt
Training forms
Cross-country
running / cycling
/ aquajogging
/ deep water
running
Small sided
games 3v3 to
1v1
Possession
games /passing
and shooting
drills / tactical
drills
Short small
sided games
(max. 90”)
Individual
periodization
Free / Home
work
Less or more
small sided
games
Table 17.9: Intensity microcycle during in-season (semi-professional level)
F
IT
N
E
SS
IN
S
O
C
C
E
R
M
a
cr
o
cy
cl
e:
in
-s
ea
so
n
32
3
[email protected] 06 Aug 2018
Intensity phase amateur level
Match day (e.g.
Sunday)
+1 (Monday)
+2 (Tuesday)
-4 (Wednesday)
-3 Thursday)
-2 (Friday)
-1 (Saturday)
Match
(Sunday)
Totaal
Fatigue
managment
Recovery
strategies
Recovery
strategies
Loading
strategies
Loading
strategies
Tapering
strategies
Tapering
strategies
Frequency (#)
1
Free
1
1
# training
sessions: 2
Volume (min)
45
80
30 (8 x 3’))
60
20
# Minutes: 140
min
Intensity (%)
30%
>90%
90%
80%
85%
Average
intensity: 85%
SAQ
None
Repeated sprint
ability
Coordination
and agility
Freshness
sprints
Strength
endurance:
Strength/Core/
Stretch
None
Core circuit
# training
sessions: 1
Training
methods
ConE
Vo2Rep, LoRep,
MeRep, VO2int
ConI, VO2Int
ConI, VO2 Int,
LoInt
MeRep, MeInt
Training forms
Cross-country
running / cycling
/ aquajogging
/ deep water
running
Small sided
games 3v3 to
1v1
Cross-country
runn
ing (8 x 3’
at 90% with 2’
rec.)
Possession
games /passing
and shooting
drills / tactical
drills
Cross-country
running (7 x 1’
at 90% with 2’
rec.)
Individual
periodization
Free / Home
work
Free /
Differentiation
in intensity and
volume
Gray: Possible home program
Table 17.10: Intensity microcycle during in-season (amateur level)
F
IT
N
E
SS
IN
S
O
C
C
E
R
M
a
cr
o
cy
cl
e:
in
-s
ea
so
n
32
4
[email protected] 06 Aug 2018
Unloading phase elite level
Match day
(e.g. Saturday)
+1 (Sunday)
+2 (Monday)
-4 AM (Tuesday)
-3 PM (Wednesday)
-2 (Thursday)
-1 (Friday)
Match
(Saturday)
Total
Fatigue
management
Recovery
strategies
Recovery
strategies
Loading
strategies
Tapering strategies
Tapering
strategies
Tapering
strategies
Frequency (#)
1
Free
1
1
1
1
# training
sessions: 5
Volume (min)
45
70
70
55
40
# Minutes: 280
Intensity (%)
50%
>80%
70%
70%
75%
Average
intensity: 69%
SAQ
None
Repeated sprint
ability
Coordination and
agility
Speed
Freshness
sprints
Strength
endurance:
Strength/Core/
Stretch
None
Dumbbell
and barbell
upperbody
Core stability
and flexibility
Preactivation
# training
sessions: 3
Training
methods
ConE
Vo2Int, LoInt,
MeInt,
ConI,
ConE
LoInt, MeInt
Training forms
Cross-country
running / cycling
/ aquajogging
/ deep water
running
Small sided
games 3v3 to
1v1
Possession games
/passing and
shooting drills /
tactical drills
Tactical drills /
Set pieces
Small sided
games (max.
90”)
Individual
periodization
Free / Home
work
Free / Less or
more small sided
games
Table 17.11: Unloading microcycle during in-season (elite level)
F
IT
N
E
SS
IN
S
O
C
C
E
R
M
a
cr
o
cy
cl
e:
in
-s
ea
so
n
32
5
[email protected] 06 Aug 2018
Unloading Unloading phase semi-professional level
Match day
(e.g. Sunday)
+1 (Monday)
+2 (Tuesday)
-4 (Wednesday)
-3 Thursday)
-2 (Friday)
-1 (Saturday)
Match
(Sunday)
Totaal
Fatigue
managment
Recovery
strategies
Recovery
strategies
Loading
strategies
Loading
strategies
Tapering
strategies
Tapering
strategies
Frequency (#)
1
Free
1
1
1
# training
sessions: 4
Volume (min)
45
70
50
40
# Minutes: 205
Intensity (%)
50
>80%
70%
75%
Average
intensity: 69%
SAQ
None
Repeated sprint
ability
Coordination
and agility
Freshness
sprints
Strength
endurance:
Strength/Core/
Stretch
None
Core circuit
Preactivation
# training
sessions: 2
Training
methods
ConE
Vo2Int, LoInt,
MeInt,
ConI,
LoInt, MeInt
Training forms
Cross-country
running / cycling
/ aquajogging
/ deep water
running
Small sided
games 3v3 to
1v1
Possession
games /passing
and shooting
drills / tactical
drills
Small sided
games (max.
90”)
Individual
periodization
Free / Home
work
Less or more
small sided
games
Table 17.12: Unloading microcycle during in-season (semi-professional level)
F
IT
N
E
SS
IN
S
O
C
C
E
R
M
a
cr
o
cy
cl
e:
in
-s
ea
so
n
32
6
[email protected] 06 Aug 2018
Unloading phase amateur level
Match day
(e.g. Sunday)
+1 (Monday)
+2 (Tuesday)
-4 (Wednesday)
-3 Thursday)
-2 (Friday)
-1 (Saturday)
Match
(Sunday)
Totaal
Fatigue
managment
Recovery
strategies
Recovery
strategies
Loading
strategies
Loading
strategies
Tapering
strategies
Tapering
strategies
Frequency (#)
1
Free
1
# training
sessions: 2
Volume (min)
45
70
20
60
20
# Minutes: 130
min
Intensity (%)
50
>80%
90%
60%
85
Average
intensity: 70%
SAQ
None
Repeated sprint
ability
Coordination
and agility
Freshness
sprints
Strength
endurance:
Strength/Core/
Stretch
None
Core circuit
# training
sessions: 1
Training
methods
ConE
Vo2Int, LoInt,
MeInt,
MeInt, ShInt
ConI,
LoInt, MeInt
Training forms
Cross-country
running / cycling
/ aquajogging
/ deep water
running
Small side
games 7v7 - 4v4
Cross-country
running (7 x 90”
at 90% with 90”
rec.)
Possession
games /passing
and shooting
drills / tactical
drills
Cross-country
running (7 x 60”
at 90% with 2
min.)
Individual
periodization
Free / Home
work
Less or more
small sided
games
Gray: Possible home program
Table 17.13: Unloading microcycle during in-season (amateur level)
F
IT
N
E
SS
IN
S
O
C
C
E
R
M
a
cr
o
cy
cl
e:
in
-s
ea
so
n
32
7
[email protected] 06 Aug 2018
Frequency
Volume
8
6
4
2
0
Volume
Intensity
Unloading
500
400
300
200
100
0
Volume
Intensity
Unloading
72%
71%
70%
69%
68%
67%
66%
65%
Intensity
Volume
Intensity
Unloading
35000
30000
25000
20000
15000
10000
5000
0
Load
Volume
Intensity
Unloading
Fig. 17.2: Distribution of frequency, volume, intensity and load (elite level) in a mesocycle.
F
IT
N
E
SS
IN
S
O
C
C
E
R
M
a
cr
o
cy
cl
e:
in
-s
ea
so
n
32
8
Elite level
Volume
phase
Intensity
phase
Unloading
phase
Frequency
7
7
5
Volume
440
380
280
Intensity
67%
71%
69%
Load
29480
26980
19320
[email protected] 06 Aug 2018
Frequency
5
4
3
2
1
0
Volume
Intensity
Unloading
300
250
200
150
100
50
0
Volume
Volume
Intensity
Unloading
70%
69%
68%
67%
66%
Intensity
Volume
Intensity
Unloading
25000
20000
15000
10000
5000
0
Load
Volume
Intensity
Unloading
Fig. 17.3: Distribution of frequency, volume, intensity and load (semi-professional level) in a mesocycle.
F
IT
N
E
SS
IN
S
O
C
C
E
R
M
a
cr
o
cy
cl
e:
in
-s
ea
so
n
32
9
Semi-professional level
Volume
phase
Intensity
phase
Unloading
phase
Frequency
4
4
4
Volume
285
235
205
Intensity
67%
69%
69%
Load
19095
16215
14145
[email protected] 06 Aug 2018
Frequency
Volume
3,5
3
2,5
2
1,5
1
0,5
0
Volume
Intensity
Unloading
250
200
150
100
50
0
Volume
Intensity
Unloading
80%
75%
Intensity
20000
15000
Load
70%
10000
65%
60%
Volume
Intensity
Unloading
5000
0
Volume
Intensity
Unloading
Fig. 17.4: Distribution of frequency, volume, intensity and load (amateur level) in a mesocycle.
F
IT
N
E
SS
IN
S
O
C
C
E
R
M
a
cr
o
cy
cl
e:
in
-s
ea
so
n
33
0
Amateur level
Volume
phase
Intensity
phase
Unloading
phase
Frequency
3
2
2
Volume
220
160
130
Intensity
67%
77%
70%
Load
14740
12320
9100
[email protected] 06 Aug 2018
FITNESS IN SOCCER
Macrocycle: in-season
331
REFERENCES
•
Alexander, D., Kennedy, M. and Kennedy, J., 1980. Rugby league football injuries over two competition seasons. Med J Aust, 2,
pp.334–5.
•
Andrzejewski, M., Chmura, J., Strzelczyk, R. and Konarski, J., 2012 Individualization of Physical Loads and Speed Abilities of Young
Soccer Players in a Six-Month Training Macrocycle. Journal of Human Kinetics, 22(1), pp.35–41.
•
Arciero, P.J., Smith, D.L. and Calles-Escandon, J., 1998. Effects of short-term inactivity on glucose tolerance, energy expenditure, and
blood flow in trained subjects. J Appl Physiol, 84, pp.1365–1373.
•
Bangsbo, J., Mohr, M. and Krustrup, P., 2006. Physical and metabolic demands of training and match-play in the elite football player.
J Sports Sci, 24 (7), pp.665-74.
•
Bell, G., Syrotuik, D. and Socha, T., 1997. Effects of strength training or concurrent strength and endurance training on strength,
testosterone, and cortisol. J Strength Cond Res, 11 (1), pp.57-64.
•
Bourne, D., Muldrew, K. and Herzog, W., 2005. Cartilage cell viability after in vivo impact loading. ISB XXth Congress, p.68.
•
Brüggemann, G.P., Brüggemann, L., Heinrich, K., Müller, M., Niehoff, A., 2011. Biological tissue response to impact like mechanical
loading. Footwear Science, 3, pp.13-22.
•
Chaouachi, A., Manzi, V., Chaalali, A., Wong, D.P., Chamari, K. and Castagna, C., 2012. Determinants analysis of change-of-direction
ability in elite soccer players. J Strength Cond Res, 26(10), pp.2667–2676.
•
Dohmen, T., 2008. The influence of social forces: Evidence from the behavior of football referees. Economic Inquiry, 46, pp.411-424.
•
Du, N., Bai, S., Oguri, K., Kato, Y., Matsumoto, I., Kawase, H. and Matsuoka, T., 2005. Heart rate recovery after exercise and neural
regulation of heart rate variability in 30-40 year old female marathon runners. Journal of Sports Science and Medicine, 4, pp.9-17.
•
Fell, J. and Williams, A.D., 2008. The effect of aging on skeletal muscle recovery from exercise: possible implications for the aging
athlete. Journal of Aging and Physical Activity, 16(1), pp.97-115.
•
Fuller, C., Ekstrand, J., Junge, A., Andersen, T., Bahr, R., Dvorak, J., Hägglund, M., McCrory, P. and Meeuwisse, W., 2006. Consensus
statement on injury definitions and data collection procedures in studies of football (soccer) injuries. Br J Sports Med, 40, pp.193-201.
•
Gabbett, T.J., 2003. Incidence of injury in semi-professional rugby league players. Br J Sports Med, 37, pp.36-44.
•
Garicano, L., Palacios-Huerta, I., and Prendergast, C., 2005. Favouristism under social pressure. Review of Economics and Statistics,
87(2), pp.208–216.
•
Gorkin, M.J., 1962. Big loads and basics of sport training. Theory Pract Phys Cult, 6, pp.45–9.
•
Gram, Mathieu, 2010. A ménage à trois: Injury prevention, Medical attention and Time loss injuries. Leuven: K.U.Leuven. Faculteit
Bewegings- en Revalidatiewetenschappen.
•
Hägglund, M., Waldén, M. and Ekstrand, J., 2006. Previous injury as a risk factor for injury in elite football: a prospective study over
two consecutive seasons. Br J Sports Med, 40, pp.767-772.
•
Hoff, J., Wisloff, U., Engen, L.C., Kemi, O.J., Helgerud J., 2002. Soccer-specific aerobic endurance training. Br J Sports Med, 36, pp.218–
221. Laursen, P.B., 2010. Training for intense exercise performance: high-intensity or high-volume training? Scand J Med Sci Sports,
20(2), pp.1–10.
•
Nádori, L. and Granek, I., 1989. Theoretical and methodological basis of training planning with special considerations within a
microcycle. Lincoln, NE: National Strength and Conditioning Association.
•
Ortega, D.R., Bíes, E.C.R. and Berral de la, F.J., 2010. Analysis of the vertical ground reaction forces and temporal factors in the lan-
ding phase of a countermovement jump. Rosa Journal of Sports Science and Medicine, 9, pp.282-287.
•
Platonov, V.N., 1997. General theory of athletes’ preparation in the Olympic sports. Kiev: Olympic Literature.
•
Pollard, R. and Pollard, G., 2005. Long-term trends in home advantage in profes¬sional team sports in North America and England
(1876–2003). Journal of Sports Sciences, 23, pp.337-350.
•
Pollard, R., 2006. Home advantage in soccer: Variations in its magnitude and a literature review of the inter-related factors associated
with its existence. Journal of Sport Behavior, 29, pp.169–189.
•
Pollard, R., 2008. Home advantage in football: A current review of an unsolved puzzle. Open Sports Sciences Journal, 1, pp.12–14.
•
Rickman, N. and Witt, R., 2008. Favouritism and financial incentives: A natural experiment. Economica, 75, pp.269-309.
•
Saltin, B. and Essen, B., 1971. Muscle glycogen, lactate, ATP, and CP in intermittent exercise. In: B. Pernov and B. Salin, eds. Muscle
metabolism during exercise. New York: Plenum Press. pp.419–27.
•
Scoppa, V., 2008. Are subjective evaluations biased by social factors or connections? An econometric analysis of soccer referee deci-
sions. Empirical Economics, 35, pp.123-140.
•
Sporer, B., 2000. A Proposed Model for Examining the Interference Phenomenon between Concurrent Aerobic and Strength Training.
Sports Medicine, 30(6), pp.385-394.
•
Steffen, K., Myklebust, G., Andersen, T.E., Holme, I. and Bahr, R., 2008. Self-Reported Injury History and Lower Limb Function as
Risk Factors for Injuries in Female Youth Soccer. The American Journal of Sports Medicine, 36(4), pp.700-708.
•
Stone, N.M. and Kilding, A.E., 2009. Aerobic conditioning for team sport athletes. Sports Medicine, 39(8), pp.615-642.
•
Terjung, R.L., Baldwin, K.M. and Winder, W.W., 1974. Glycogen repletion in different type of muscle and liver after exhausting
exercise. Am Physiol, 226, pp.1387–95.
•
Vollaard, N.B., Constantin-Teodosiu, D., Fredriksson, K., Rooyackers, O., Jansson, E., Greenhaff, P.L., Timmons, J.A. and Sundberg,
C.J., 2009. Systematic analysis of adaptations in aerobic capacity and submaximal energy metabolism provides a unique insight into
determinants of human aerobic performance. J Appl Physiol, 106, pp.1479–1486.
•
Wilson, J.M., Marin, P.J., Rhea, M.R., Wilson, S.M.C., Loenneke, J.P. and Anderson, J.C., 2012. Concurrent training: A meta-analysis
examining interference of aerobic and resistance exercise. J Strength Cond Res, 26(8), pp.2293–2307. Zatsiorsky, V.M., 1995. Science
and Practice of Strength Training. Champaign, IL: Human Kinetics.
[email protected] 06 Aug 2018
332
1
FITNESS IN SOCCER
Macrocycle: in-season
[email protected] 06 Aug 2018
FITNESS IN SOCCER
Microcycle: Week planning
333
18
MICROCYCLE: WEEK PLANNING
Werner Helsen, Jan Van Winckel, Paul Bradley, Kenny McMillan
18.1 INTRODUCTION
As was already mentioned in the previous chapters, weekly planning in soccer is
entirely focused on preparing for the forthcoming match. At the beginning of each
week, the emphasis is placed on recovering from the fatigue accrued during the
previous match, while at the end of the microcycle, different tapering strategies are
applied in order to optimally prepare players for their next match. Only training
sessions at least 48 hours prior to, or after, a match can be used to physically over-
load the players.
18.2 STRUCTURE OF A TRAINING SESSION
A training session consists of the following parts:
1. Pre-activation or functional strength training
2. Warm up:
• cardiovascular stimulus:
- increase oxygen uptake
- increase heart rate
- activate the transportation of oxygen to the active muscles
• dynamic stretching
• speed: ATP-CP system and activate lactate removal (longer exertion with suf-
ficient rest)
3. Technical/tactical training
4. Small-sided games (SSGs)
5. Progression phase: In this phase, work is done for each player individually
based on a strength-weakness analysis; this can be technical (e.g., shooting, pas-
sing, receiving, etc.), tactical (e.g., line defense), mental, and physical (e.g., repe-
ated sprint ability, speed, etc.)
6. Recovery phase:
• cooling down
• restoration of fluid balance
• replenishment of energy substrates
[email protected] 06 Aug 2018
FITNESS IN SOCCER
Microcycle: Week planning
334
7. Prevention phase:
Prevention exercises are done in close collaboration with the sports science and
medical staff:
• increase active and dynamic flexibility (e.g., static, active, PNF method)
• eliminate muscular maladaptations
• restore muscular balances
• increase proprioception
• increase core strength
• increase core balance
• increase core endurance
• other forms of injury prevention
18.3 PRE-ACTIVATION
The warm up of all the different muscle groups (pre-activation) can be initiated in
the dressing room or a specially designated room, such as a gym or fitness room if
available, and it should focus particularly on the deep musculature. It is not always
easy to properly warm up these muscle groups in cold-weather conditions. The
deep musculature serves as anchor points for the other muscle groups, so they
must be well prepared.
18.4 WARM UP
According to Bishop (2003), warm-up techniques can be broadly classified into two
major categories: (i) passive warm up or (ii) active warm up. Passive warm up
involves raising muscle temperature (Tm) or core temperature (Tc) by some exter-
nal means (e.g., hot showers or baths, saunas, diathermy, and heating pads). Active
warm up involves exercise and is likely to induce greater metabolic and cardiovas-
cular changes than passive warm up. Active warm up is probably the most widely
used warm-up technique. During the warm up, a player prepares various systems
(cardiovascular, neural, pulmonary and muscular) for the load they will be sub-
jected to in the game. An active warm up increases the total oxygen uptake and
guarantees faster lactate elimination during training or a match. A passive warm
up, such as a hot bath, does not generate these effects. It is insufficient to merely
warm the muscles to the right temperature. All the systems that are linked to oxy-
gen transportation and consumption need to be activated before starting a match
or training session. Burnley et al. (2002) concluded that the VO
2 response to heavy
exercise can be significantly altered by both sustained high-intensity submaximal
exercise and short-duration sprint exercise. In contrast, passive warming elevated
muscle temperature but had no effect on the VO
2 response.
Referring to the beneficial effects of increased temperatures on muscle extensibility,
two studies by Shellock and Prentice (1985) and Strickler et al. (1990) both suggest
that a warm-up phase and dynamic stretching should always precede training to
prevent stretching-induced injury. According to Shellock and Prentice (1985), most
of the physiological effects of a warm up are temperature dependent. Mechanical
efficiency of the muscle contraction is close to 20%, while most of the energy produ-
ced (70-80%) is thermal energy. Heat production by contracting muscles increases
[email protected] 06 Aug 2018
FITNESS IN SOCCER
Microcycle: Week planning
335
in the first minutes of the exercise (Krustrup et al., 2001). Most of the heat produced
during the first seconds of exercise seems to accumulate in the contracting muscle,
but after those first minutes, most of the produced heat is transported to the inner
core by the blood or lymph drainage (Gonzales-Alonso et al., 2000). An increased
body temperature increases the amount of oxygen available in the working tis-
sues, therefore helping oxygen to dissociate from hemoglobin and myoglobin.
Moreover, an increase in muscle temperature reduces the time needed to reach the
peak torque and the half-relaxation time of an electrically evoked twitch (Davies
and Young, 1985; Segal et al., 1986).
The main aim of a warm up is to prepare the body for optimal performance.
Warm-up strategies are planned by coaching staff who rely on previous trial-and-er-
ror experiences (Bishop, 2003). A typical warm up in soccer consists of 30–40 minu-
tes of moderate- to high-intensity activities (Mohr et al., 2004). This contrasts with
research suggesting that 5–10 minutes at 40-70% of VO
2max is sufficient to improve
performance (Bishop, 2003). However, coaches should take care and ensure that
performance itself is not jeopardized by increasing pre-competition fatigue, decre-
asing blood glucose levels and muscle glycogen stores, and prematurely elevating
core temperature (Gregson et al., 2005). During the transition from rest to exercise,
the body increases the oxygen supply to the muscles through the complex orches-
tration of pulmonary, cardiovascular and muscular processes.
[email protected] 06 Aug 2018
FITNESS IN SOCCER
Microcycle: Week planning
336
18.4.1 Effects of warming up
A thorough warm-up has the following effects:
• The muscle temperature increases (39°C).
• Depending on the intensity and duration of the warm up, short-term perfor-
mance is likely to be improved if the recovery interval allows phosphocreatine
(PCr) stores to be significantly restored (Bishop, 2003).
• The stroke volume of the heart, and the cardiac output increases.
• Local vasodilation redistributes blood from the viscera to the working mus-
cles. This redistribution of blood flow allows increased nutrient and oxygen
delivery and improves the efficiency of waste product removal.
• The rise in temperature triggers enzyme activity, which increases the meta-
bolism in the body, resulting in more energy being available for the muscles.
• The quantity of oxygen-rich blood to the muscles increases, improving the
metabolism in the muscles.
• A warm up longer than ten minutes can impair long-term performance by
decreasing muscle glycogen content (Gollnick et al., 1973) and/or decreasing
heat-storage capacity (Gregson et al., 2002).
• It is thought that the compliant muscle can be stretched further after warming
up (Safran et al., 1988).
• Nerve conduction velocity increases, with the impulses reaching the muscles,
tendons and ligaments faster.
• Improved coordination.
• Positive influence on the contraction and reflex times of the muscles.
• The range of movement of the joints increases.
• The muscles are better prepared for extreme movements with a high range of
motion.
• The risk of injury is reduced (Olsen et al., 2005). Grooms et al. (2013) inves-
tigated the effects of a soccer-specific warm-up program (F-MARC 11+) on
lower extremity injury incidence in male collegiate soccer players. They con-
cluded that the F-MARC 11+ program reduced overall risk and severity of
lower extremity injury when compared with controls in collegiate-aged male
soccer athletes.
• Higher rate of force development and therefore a decrease in time to peak
torque.
• Higher half-relaxation time.
However, a warm up can also have negative effects, such as:
• The glycogen reserves diminish:
The substrates (muscle glycogen, blood glucose) will be used during the warm
up. An excessively long warm up can therefore have a negative influence on
performance. A warm up of 15-20 minutes is sufficient (depending on the out-
side temperature).
• The body temperature could rise to dangerous levels (hyperthermia):
In hot weather conditions, the body temperature can rise too high and affect
performance. At a body temperature above the critical temperature of approxi-
mately 40°C, the body will limit performance in an attempt to prevent over-
[email protected] 06 Aug 2018
FITNESS IN SOCCER
Microcycle: Week planning
337
heating. Research has demonstrated that a hot and humid climate reduced
short-sprint performance (Maxwell et al., 1999) and sprint time in a 90-minute
soccer-specific protocol (Morris et al., 1998, 2000), as well as during an inter-
mittent-sprint protocol on a bike (Noakes et al., 2001).
• Muscular performance diminishes through extended static stretching. For
example, the 20m-sprint performance of rugby union players decreased after
static stretching (Fletcher and Jones, 2004).
18.4.2 Post-activation potentiation phenomenon
Another physiological mechanism that helps clarify the increase in performance
following a dynamic warm up is a phenomenon called post-activation potentia-
tion (PAP). Following a short bout of high-intensity exercise (preload stimulus),
the muscle is in both a fatigued and a potentiated state (referred to as post-activa-
tion potentiation). Consequently, subsequent muscle performance depends on the
balance between these two factors (Kilduff et al., 2007). PAP refers to an increased
power output following a specific stimulus (Robbings, 2005). For example, follo-
wing a bout of dynamic exercise, the muscles show a clear enhancement in the rate
of force development, such as jumping height. This period of improvement has
been demonstrated to last between 5 and 20 minutes (Chiu et al., 2003). It seems
that the majority of the enhancement is achieved in fast-twitch fibers (French et
al., 2003). Kilduff et al. (2007) concluded that muscle performance in rugby (e.g.,
power) can be enhanced following a bout of heavy exercise (preload stimulus)
in both the upper and the lower body in cases where adequate recovery (of 8–12
minutes) is given between the preload stimulus and performance. Till and Cooke
(2009) found no significant group PAP effect on sprint and jump performance after
both dynamic and isometric maximum voluntary contractions (MVCs) when com-
pared with a control warm-up protocol. However, the large variation in individual
responses (-7.1% to +8.2%) may suggest that PAP should be considered on an indi-
vidual basis.
[email protected] 06 Aug 2018
FITNESS IN SOCCER
Microcycle: Week planning
338
2
18.4.3 Structure of the warm up
A warm up comprises four elements: cardio-vascular stimulus, dynamic stretching,
speed, and initiation of VO
2 kinetics.
18.4.3.1 Cardiovascular stimulus (5 minutes)
This first phase entails light running with the aim of activating the cardiovascular
(heart and blood vessels) and the pulmonary (oxygen) systems for intense exercise.
This phase lasts five minutes and involves light running only. Light passing and
kicking exercises can also be used, with the emphasis on warming up rather than
the speed and precision of the pass.
18.4.3.2 Dynamic stretching (5-10 minutes)
Soccer is played in an open-air environment. When passive stretching is used, the
muscles cool down again. It is therefore better to use dynamic stretching to prepare
for a match or training session, particularly because soccer is a dynamic sport. Tra-
ditionally, many soccer players prepare for a match by performing extensive static
stretching. However, static stretching only increases static flexibility and impairs
performance. Although this does have a place in weekly training planning (as part
of injury-prevention programs), it is better to use it at the end of a training session
(see the following chapter). On a different note, some players still prefer to perform
static stretching before a match, because that is how they have always done it, so
they need it to mentally prepare before the game.
Dynamic stretching is better for preparing the body for the movements needed
during a match, although some players need time to do their own thing. Coa-
ches will need to change the mind-set of these players by explaining the pros and
cons of static versus dynamic stretching, but this will take some time—you cannot
change it overnight. Mandengue et al. (2005) examined whether athletes were able
to self-select their optimal warm up. They concluded that while most athletes could
self-determine the intensity of their optimal warm up, some still needed guidance
from others.
18.4.3.3 Speed
The improvement of speed, agility and quickness is planned at the end of a warm
up. The player is not fatigued yet, guaranteeing the quality of the speed training.
A high-intensity exercise is carried out (for more than 15 seconds) after the speed
training, followed by a few minutes of recovery.
18.4.3.4 Starting VO kinetics
VO
2 kinetics has to be initiated during the warm up. This enables players to start
the match without losing too much energy.
[email protected] 06 Aug 2018
FITNESS IN SOCCER
Microcycle: Week planning
339
18.5 CENTRAL SECTION
18.5.1 Technical/tactical training.
The first phase of the main section of training comprises technical/tactical training.
These exercises are kept as match specific as possible, of course, with the empha-
sis placed on correct execution of the technique. Each exercise must be properly
incorporated into the periodization schedule. Both technical/tactical training and
match training have to be adapted accordingly. This can be done by increasing or
reducing field sizes, incorporating additional running exercises, or adjusting the
rotation system.
18.5.2 Match-specific exercises
In the second phase of the central section, technical and tactical exercises are carried
out in a match situation. Depending on the schedule for the season, these match
exercises are modified in order to obtain the right intensity of physical exertion.
Virtually every exercise can be adapted to the periodization requirements by adjus-
ting distance, the number of players, or technical changes (e.g., the number of tou-
ches on the ball).
18.6 PROGRESSION PHASE
Finally, in the progression phase, all players work on their weaknesses. Each player
is given an individual program, which can be technical, physical, mental and/or
tactical.
18.7 RECOVERY PHASE
18.7.1 Cool down
There is a lack of scientific research on the physiological effects of a cool down.
Exercise leads to an increase in body temperature, heart rate and blood pressure.
There is also a buildup of waste and byproducts (e.g., lactate, creatine kinase) in the
muscles. Furthermore, hormones, such as adrenaline and endorphins, are released
into the circulatory system during exercise. If a player stops after training without
executing a cool down, his levels of circulating adrenaline and endorphins remain
high. This can cause an aroused state or even a sleepless night. Players may not feel
like doing a cool down after a strenuous game or training session, but they must
understand that it is worth doing for the potential benefits, although scientific evi-
dence is lacking for this.
18.7.2 Restoring the fluid balance
Most players are already dehydrated before they start the morning training ses-
sion. Fluid lost while sleeping is not restored because players often do not drink
enough liquid with their breakfasts. In a study by Shirreffs and Maughan (1998),
almost one-third (6/17) of the soccer players studied provided a pre-training urine
sample with an osmolality above 900 mosmol/kg. These values may be indicative
of a state of mild hypohydration before training began (Shirreffs and Maughan,
1998). Measuring body weight can give a good indication of hydration. The diffe-
[email protected] 06 Aug 2018
FITNESS IN SOCCER
Microcycle: Week planning
340
rence between the typical body weight in the afternoon and the typical weight in
the morning indicates how much extra water a player needs to drink. Fluid lost
during the training session can be measured in the same way. It is assumed that a
1 kg loss of body mass is equal to a liter of sweat loss (Shirreffs et al., 2006). Mau-
ghan and colleagues (2005) investigated fluid and electrolyte balance in elite male
soccer players training in a cool environment. The mean sweat loss during training
was 1.69+0.45 L (a range of 1.06–2.65 L). The mean fluid intake during training was
423+215 ml (a range of 44–951 ml). The results of this study suggest that sweat loss
may be substantial in soccer players training in a cool environment. The resear-
chers speculate that because of adjustments in clothing, and perhaps also in activity
levels, the total sweat and electrolyte losses may be similar to those experienced
when training in hotter climates. Furthermore, fluid intake appears to be lower in
teams training in the cold than it is in teams training in the heat.
Training in a rain jacket, or other clothing, to deliberately cause weight loss during
a training session is useless and potentially dangerous. This weight loss is simply a
loss of fluid that should be restored immediately anyway. A player perspires to cool
down the body. If this is hindered by wearing a rain jacket, the body temperature
may rise to a dangerous level.
18.7.3 Replenishment of energy substrates
There is an increase in the insulin level immediately after training. This insulin is
important because it stimulates protein synthesis. Therefore, this is an ideal moment
to replenish the energy stores. The body absorbs carbohydrates and proteins more
rapidly after physical exertion than in normal circumstances. According to Burke
et al. (2006), each soccer player needs to equate daily carbohydrate intake to the
fuel needs of the training and competition schedule. A reasonable target range for
the carbohydrate intake of high-level players in less mobile roles, or teams or indi-
viduals with a less demanding training and competition schedules, is 5–7 g / kg/
day. For mobile players who want to maximize muscle glycogen refueling, such as
in preparation for matches or for recovery during an intensive training schedule,
a target of 7–10 g /kg/ day may be required. While there are some strategies to
promote fuel availability for match play and prolonged training sessions by using
nutritional practices on the day (Williams and Serratosa, 2006), tactics to restore
(after intensive training) or even supercompensate muscle glycogen content must
start 24–48 hours before a game. The importance of “fuelling up” before a match
has been demonstrated in some publications. Balsom et al. (1999) examined the
effect of a high-carbohydrate diet on performance. Participants followed 48 hours
of either a high- or low-carbohydrate diet before short-term (<10 min) and prolon-
ged (>30 min) protocols of intermittent exercise (6s bouts at 30s intervals). Muscle
glycogen concentrations were reduced by at least 50% in the low-carbohydrate trial
compared with the high-carbohydrate trial, and there was an associated dramatic
reduction in the work performed in both exercise protocols.
[email protected] 06 Aug 2018
FITNESS IN SOCCER
Microcycle: Week planning
341
18.8 PREVENTION PHASE
The prevention phase is executed on the pitch or in the fitness room. Players work
to restore maladaptations and strengthen or improve deficiencies. For example,
some players can strengthen their hamstrings (Nordic hamstrings), while others
strengthen their abdominal muscles or do proprioception exercises (balancing exer-
cises to train the neuromuscular system). The Nordic Hamstring exercise was deve-
loped by Mjølsnes et al. (2004). This exercise, which can be done on the field, has
been demonstrated to increase the eccentric strength in the hamstring muscles of
professional male soccer players.
SUMMARY
A typical training session consists of several different components. Before any
technical/tactical training commences, pre-activation drills and warm-up exerci-
ses prepare the soccer player both physically and mentally for the forthcoming
session. Thereafter, the main component of the training session usually consists
of small-sided game play, technical and tactical drills, and individualized trai-
ning programs. If possible, fitness improvement or maintenance should be a part
of technical and tactical drills. The training session should end with a recovery
phase to help the player prepare for the next training session. If time permits,
individualized injury-prevention programs may then be carried out, as well as
individualized strength training and flexibility programs. Strength training,
flexibility training and injury-prevention strategies will be discussed in the fol-
lowing chapters.
[email protected] 06 Aug 2018
FITNESS IN SOCCER
342
Microcycle: Week planning
REFERENCES
•
Balsom, P.D., Wood, K., Olsson, P. and Ekblom, B., 1999b. Carbohydrate intake and multiple sprint sports: With special reference to foot-
ball (soccer). International Journal of Sports Medicine, 20, pp.48–52.
•
Bishop, D., 2003. Warm Up II: Performance Changes Following Active Warm Up and How to Structure the Warm Up. Sports Medicine,
33(7), pp.483-498.
•
Burke L.M., Loucks, A.B. and Broad, N., 2006. Energy and carbohydrate for training and recovery. Journal of Sports Sciences, 24(7).
•
Burnley, M., Doust, J.H. and Jones, A.M., 2002. Effects of prior heavy exercise, prior sprint exercise and passive warming on oxygen
uptake kinetics during heavy exercise in humans. Eur J Appl Physiol., 87(4-5), pp.424-32.
•
Chiu, L.Z., Fry, A.C., Weiss, L.W., Schilling, B.K., Brown, L.E. and Smith, S.L., 2003. Postactivation potentiation response in athletic and
recreationally trained individuals. Journal of Strength and Conditioning Research, 17(4), pp.671-677.
•
Davies, C.T. and Young, K., 1985. Effect of heating on the contractile properties of triceps surae and maximal power output during jum-
ping in elderly men. Gerontology 31(1), pp.1-5.
•
Ekstrand, J., Gillquist, J., Möller, M., Oberg, B. and Liljedahl, S.O., 1983. Incidence of soccer injuries and their relation to training and team
success. The American journal of sports medicine, 11(2), pp.63-7.
•
Fletcher, I.M. and Jones, B., 2004. The Effect of Different Warm-Up Stretch Protocols on 20-Meter Sprint Performance in Trained Rugby
Union Players. Journal of Strength and Conditioning Research, 18(4), pp.885–888.
•
French, D.N., Kraemer, W.J. and Cooke, C.B., 2003. Changes in dynamic exercise performance following a sequence of preconditioning
isometric muscle actions. Journal of Strength and Conditioning Research, 17(4), pp.678-685.
•
Gollnick, P.D., Armstrong, R.B. and Sembrowich, W.L., 1973. Glycogen depletion pattern in human skeletal muscle fibres after heavy
exercise. J Appl Physiol, 34(5), pp.615–8.
•
Gonzalez-Alonso, J., Quistorff, B., Krustrup, P., Bangsbo, J. and Saltin, B., 2000. Heat production in human skeletal muscle at the onset of
intense dynamic exercise. J Physiol, 524, pp.603-615.
•
Gregson, W., Batterham, A., Drust, B. and Cable, N.T., 2002. The effects of pre-warming on the metabolic and thermoregulatory responses
to prolonged intermittent exercise in moderate ambient temperatures. J Sports Sci, 20(1), pp.49–50.
•
Grodjinovsky, A. and Magel, J., 1970. Effect of warming up on running performance. Res Quart., 41, pp.116-19.
•
Grooms, D.R., Palmer, T., Onate, J.A., Myer, G.D. and Grindstaff, T., 2013. Soccer-specific warm-up and lower extremity injury rates in
collegiate male soccer players. J Athl Train, 48(6), pp.782-9.
•
Hajoglou, A., Foster, C., DeKofiing, J.J., LllCia ,A., Kernozek, T.W. and Porcari, J.P., 2005. Effect of warm up on cycle time trial perfor-
mance. Med Sci Sports Exerc., 37(9), pp.1608-14.
•
Jones, A.M. and Koppo, K., 2005. Effect of Training on VO2 Kinetics and performance. In: A.M. Jones and D.C. Poole, eds. Oxygen Uptake
Kinetics in Sport, Exercise and Medicine. Abingdon: Taylor and Francis. p.385.
•
Kilduff, L.P., Bevan, H.R., Kingsley, M.I., Owen, N.J., Bennett, M.A., Bunce, P.J., Hore, A.M., Maw, J.R. and Cunningham D.J., 2007.
Postactivation potentiation in professional rugby players: optimal recovery. J Strength Cond Res, 21(4), pp.1134-8.
•
Krustrup, P., Gonzalez-Alonso, J., Quistorff, B. and Bangsbo, J., 2001. Muscle heat production and anaerobic energy turnover during
repeated intense dynamic exercise in humans. J Physiol, 536, pp.947-956.
•
Mandengue, S.H., Seck, D., Bishop, D., Cissé, F., Tsala-Mbala, P. and Ahmaidi, S., 2005. Are athletes able to self-select their optimal warm
up? Journal of Science and Medicine in Sport, 8(1), pp.26-34.
•
Maughan, R.J., Shirreffs, S.M., Merson, S.J. and Horswill, C.A., 2005. Fluid and electrolyte balance in elite male football (soccer) players
training in a cool environment. J Sports Sci., 23(1), pp.73-9.
•
Maxwell, N.S., et al., 1999. Intermittent running: muscle metabolism in the heat and effect of hypohydration. Med. Sci. Sports Exer.,
231, pp.675-683.
•
McCutcheon, L.J., Geor, R.J. and Hinchcliff, K.W., 1999. Effects of prior exercise on muscle metabolism during sprint exercise in humans.
J Appl Physiol, 87(5), pp.1914–22.
•
Mjolsnes, R., Arnason, A., Østhagen, T., Raastad, T. and Bahr, R., 2004. A 10-week randomized trial comparing eccentric vs. concentric
hamstring strength training in well-trained soccer players. Scandinavian Journal Of Medicine & Science In Sports, 14(5), pp.311–317.
•
Mohr, M., Krustrup, P., Nybo, L., Nielsen, J.J. and Bangsbo, J., 2004. Muscle temperature and sprint performance during soccer mat-
ches--beneficial effect of re-warm-up at half-time. Scand J Med Sci Sports, 14, pp.156–162.
•
Morris, J.G., Nevill, M.E., Lakomy, H.K.A., Nicholas, C. and Williams, C., 1998. Effect of a hot environment on performance of prolonged,
intermittent, high-intensity shuttle running. Journal of Sports Sciences, 16, pp.677-686
•
Olsen, O.E., Myklebust, G., Engebretsen, L., Holme, I. and Bahr, R. 2005. Exercises to prevent lower limb injuries in youth sports: cluster
randomised controlled trial. BMJ, 330(7489), p.449.
•
Robbins, D.W., 2005. Postactivation potentiation and its practical applicability: a brief review. Journal of Strength and Conditioning
Research, 19(2), pp.453-458.
•
Safran, M.R., Seaber, A.V. and Garrett, W.E., 1989. Warm-up and muscular injury prevention: An update. Sports Medicine, 8, pp.239–249.
•
Saltin, B., Gagge, A.P. and Stolwijk, J.A.J., 1968. Muscle temperature during submaximal exercise in man. J Appl Physiol, 25, pp.679-688.
•
Shellock, F.G. and Prentice, W.E., 1985. Warming-up and stretching for improved physical performance and prevention of sports-related
injuries. Sports Med., 2(4), pp.267-78.
•
Shirreffs, S.M. and Maughan, R.J., 1998. Urine osmolality and conductivity as markers of hydration status. Medicine and Science in
Sports and Exercise, 30, pp.1598–1602.
•
Shirreffs, S.M., Sawka, M.N. and Stone, M., 2006. Water and electrolyte needs for football training and match-play. Journal of Sports
Sciences, 24(07), pp.699-707.
•
Strickler, T., Malone, T. and Garrett, W.E., 1990. The effects of passive warming on muscle injury. American Journal of Sports Medicine,
18(2), pp.141–145.
•
Till, K.A. and Cooke C., 2009. The effects of postactivation potentiation on sprint and jump performance of male academy soccer players.
J Strength Cond Res., 23(7), pp.1960-7.
•
Williams, C. and Serratosa, L., 2006. Nutrition on match day. Journal of Sports Sciences, 24, pp.687–697.
[email protected] 06 Aug 2018
FITNESS IN SOCCER
Stretching
343
19
STRETCHING
Jan Van Winckel, Kenny McMillan, Werner Helsen, Paul Bradley, David Tenney
19.1 INTRODUCTION
Stretching is a routine part of the training regime of soccer players. However, there
is a great deal of controversy in relation to stretching. For a soccer coach, it is not
easy to draw the right conclusions from the often-conflicting information available.
Despite this problem, stretching has a long tradition of use, and it will likely conti-
nue to be a part of training and rehabilitation programs (Covert et al., 2010). Stret-
ching can be beneficial to some extent, but we must try to emphasize a pragmatic
perspective and use any scientific evidence to inform our judgments. It seems that
the parameters of the stretch, such as the time to stretch and the holding duration,
are almost as important as the stretching technique used. This chapter provides an
overview of different stretching techniques and sets out how and when these tech-
niques can be used.
19.2 TYPES OF STRETCHING
19.2.1 Ballistic or elastic stretching
Ballistic stretching is a form of stretching performed in a bouncing motion, using
the momentum of a moving body or limb to attempt to force it beyond its nor-
mal range of motion. This type of stretching is likely to increase flexibility through
a neurological mechanism. It involves fast “bouncing” movements where a dou-
ble bounce is performed at the end range of movement. Ballistic stretching should
only be used by athletes who know their limitations and who are supervised by
staff. Some studies have expressed concerns over the risk of muscle-strain injuries
(Vujnovic and Dawson, 2004), because ballistic stretching could potentially cause
microtrauma to the muscle (Taylor et al., 2004). These hypotheses are not supported
by current scientific literature, but nevertheless, coaches should be careful about
using ballistic stretching after soccer activities that could cause EIMD (e.g., exces-
sive eccentric loading, match play, etc.). Soccer players need time to recover from
these activities, and they should not attempt to improve flexibility while in this
state.
[email protected] 06 Aug 2018
FITNESS IN SOCCER
Stretching
344
19.2.2 Dynamic stretching
This type of stretching is not to be confused with ballistic stretching. Although the
manual of the American College of Sports Medicine puts dynamic stretching on
a par with ballistic stretching, there is a distinct difference between the two. In
contrast to ballistic stretching, dynamic stretching steadily develops the move-
ment sequence, guaranteeing a gradual buildup in the warm-up process. Research
shows that dynamic stretching is most effective when the emphasis is on the gre-
atest amplitude or range of motion rather than the greatest movement velocity.
Dynamic stretching improves flexibility to the same degree as static stretching
(Beedle and Mann, 2007), although O’Sullivan and co-workers postulate that dyna-
mic stretching is less efficient at increasing static flexibility than static stretching is
(O’Sullivan et al., 2009).
Dynamic stretching is a useful protocol for increasing flexibility and increasing per-
formance. However, it is unclear whether this effect is brought about by the stret-
ching or the warming up associated with it. Regardless, it is advisable to carry out
dynamic stretching before a match and/or training session.
19.2.3 Active stretching
Active stretching is also referred to as static-active stretching. In this type of stret-
ching, a part of the body is moved into a particular position using agonist mus-
cle strength. The antagonist is then stretched. This increases active flexibility and
strengthens the antagonist at the same time. It is considered to have a lower risk
because players control the stretch force with their own strength rather than an
external force.
.
[email protected] 06 Aug 2018
FITNESS IN SOCCER
Stretching
345
19.2.4 Passive stretching or static stretching
Passive stretching is also referred to as relaxing or static-passive stretching. In this
technique, stretching is carried out with the help of another part of the body, a part-
ner, or an auxiliary aid. In some books, passive and static stretching are separated.
The difference is that in static stretching, the muscle is moved to a particular posi-
tion and held, while in passive stretching, a particular position is achieved with the
help of an auxiliary aid or another person. Static stretching increases static flexibi-
lity (Power et al., 2004) but does not affect dynamic flexibility (Halbertsma et al.,
1996; McNair et al., 2000). Various studies have demonstrated that static stretching
has a negative effect on performance (Behm and Kibele, 2007), as well as a nega-
tive effect on reaction time,
movement time and balance
(Behm et al., 2004). Bandy et
al. (1997) demonstrated that
performing static stretching
three times a day did not
induce significantly different
gains in flexibility when com-
pared to stretching only once
a day.
A great deal of research has been conducted into the effects of static stretching on
performance. It can generally be said that static stretching prior to a match has no
effect, or possibly even a negative effect, on performance. Two highly cited reviews
(Behm and Chaouachi, 2011; Kay and Blazevitch, 2012) both suggest there is a dura-
tion effect on the impairments associated
with stretching. If more than 60–90s of static
stretching is performed on a single muscle
group, it seems likely the player will suffer
performance impairments. Less than 30s of
stretching per muscle group can still result
in deficits, but the research is conflicting
about this, so a player is less likely to suffer
deficits with short durations of static stret-
ching. It is not yet clear whether a warm
up after this static stretching can reduce the
negative effects. Overall, static stretching
should be avoided prior to the start of a
match or training session.
[email protected] 06 Aug 2018
FITNESS IN SOCCER
Stretching
346
19.2.5 PNF method (proprioceptive neuromuscular facilitation)
There are various forms of the PNF method (reversal-hold, contract-relax, hold-re-
lax, slow-reversal-hold). These techniques all consist of the combination of alterna-
ting the contraction and relaxation of agonist and antagonist muscles (Shellock and
Prentice, 1985; Burke et al., 2000). PNF methods are complicated stretching tech-
niques, and they need experience to be performed. The use of the PNF technique
prior to match play or training is still questioned, and although PNF stretching has
been reported to result in an increased range of motion when compared to static
stretching (Magnusson et al., 1996), it remains a question as to whether this also
involves dynamic flexibility.
[email protected] 06 Aug 2018
FITNESS IN SOCCER
Stretching
347
Example of the PNF method. The player works his quadriceps by bending his leg,
after which the leg is allowed to relax for 10 seconds. The muscle is then finally
stretched for 10 seconds.
19.3 INCREASING FLEXIBILITY OR PREPARING THE BODY
When using stretching techniques, it is important to know in what context and in
what way these techniques should be used. For example, prolonged static stret-
ching is detrimental to performance if applied before a match. However, if the tech-
nique were used in a flexibility session to increase suppleness, it could lead to fewer
injuries in soccer. Dynamic stretching is optimal for warming up before a soccer
game. In order to increase the range of movement, however, the use of static stret-
ching is preferred (Little and Williams, 2003).
19.3.1 Flexibility
In a large number of sports, flexible muscles are needed to enable optimal perfor-
mance and prevent injuries. Sports that require flexible muscles include basketball,
volleyball and soccer. These are sports in which an SSC (stretch-shortening cycle)
is used. This means that a muscle is first used eccentrically in order to then be used
concentrically. A good example of an SSC is a jump in which the knees are first bent
in order to then be able to jump higher. Flexible muscles are needed in these sports
to convert the energy stored in the muscle during the eccentric action (bending
the knees) into concentric action (the jump itself). In a study of Walshe and Wilson
(1997), athletes had to perform a jump after they jumped from a bench of 80–100
cm. The results demonstrate that flexible players jump significantly higher than
less flexible players do. On the other hand, Walshe and Wilson (1997) found that the
most flexible athletes experience more injuries than moderately flexible athletes.
Depending on the action, certain sports need less flexibility than others. Increased
flexibility can even hinder performance in some cases. Sprinters, for example, need
[email protected] 06 Aug 2018
FITNESS IN SOCCER
Stretching
348
to transfer the SSC very rapidly (within 200ms), so a more taut muscle is better able
to transfer this energy quickly. When the running distance and the contact time
on the ground is two to three times longer than in sprinting, a more flexible mus-
culo-tendinous unit is needed to store the elastic energy over a longer period and
return it to the action at the appropriate time.
To make the situation even more complex, very flexible athletes (hyperlaxity or
hypermobility) are more prone to sprain-type injuries.
19.3.2 Preparing the body for a match or training
The body must be prepared to perform before the start of a match or training session.
Players therefore have to call on the different systems (i.e., cardiovascular, respira-
tory, neural, muscular) to ensure they are ready to perform. The body needs time
to fully initiate oxygen uptake (VO
2 kinetics). In addition, the temperature of the
muscles needs to increase by 1–2 degrees. Finally, the muscles also need to be prepa-
red for extreme movements, such as stretching to control a bar in the air. However,
coaches should use a different technique in this regard rather than that applied for
increasing the flexibility of the muscles. It is therefore recommended to use dynamic
stretching before the start of a match. This technique increases the temperature of
the muscles and prepares the body for optimal performance at a high level.
19.3.3 What techniques do we use and why?
There is a great deal of literature available in scientific journals. Although they
sometimes give conflicting information, we can nevertheless draw the following
conclusions:
• Static stretching may be detrimental to performance. In a study of Gelen, sta-
tic stretching before a slalom ball dribbling test reduced performance by 8.5%
(Gelen, 2010).
• Static stretching increases the flexibility of the muscle.
• Brief static stretching (< 30s) is less detrimental to performance. Research
demonstrated that 36” (6 repetitions of 6”) of static stretching increases the
ROM significantly (Murphy et al., 2010). Another study showed that a minute
of static stretching caused less performance degradation than two or four
minutes of stretching (Young et al., 2006).
• The muscle cools down again during static or passive stretching, and the car-
diovascular and respiratory systems return to rest status.
• Dynamic stretching either has no detrimental effect or improves performance.
• Intensive dynamic stretching is better than less intensive stretching.
• Static stretching to the POD (i.e., Point Of Discomfort: the point at which the
athlete indicates that the stretching feels uncomfortable) has negative effects
on strength performance (Behm et al., 2006). Static stretching up to 90% of
POD reduces the adverse effects of static stretching on performance (Manoel
et al., 2008).
Based on existing literature, it is clear that static stretching should not be used
before the start of a match. Instead, (intensive) dynamic stretching should be used
to prepare the players. To increase the flexibility of the muscles, it is therefore
recommended to incorporate flexibility training after the end of a training session
or in a specific session.
[email protected] 06 Aug 2018
FITNESS IN SOCCER
Stretching
349
19.4 USE DURING THE TRAINING WEEK
19.4.1 Warm up before a match or training session
The aim of the warm up is to prepare the body for physical activity. The players
must therefore activate the various systems (i.e., cardiovascular, pulmonary, neu-
ral, and muscular) to ensure they can use these efficiently during the match or trai-
ning session. On the other hand, the muscles also have to be prepared for extreme
movements during a match or training session. This could be a sliding tackle, for
example, where the adductors (groin) are stretched to the extreme. For this reason,
dynamic stretching is used at the beginning of a training session or match. These
types of exercises stretch the muscles sufficiently, thus preparing them for extreme
movements. Torres et al. (2008) suggest that dynamic stretching in a warm up is
better than static stretching because the movements are specific to sport.
Examples:
• Skipping
• Carioca
- Knee pull-ups
- Sidesteps
- Swinging the arms
19.4.2 Injury prevention
Long-term development of flexibility is important for injury prevention, so flexi-
bility practices must be carried out through the season. Witvrouw et al. (2003) and
Bradley and Portas (2007) also found that hamstring muscle-strain injuries in elite
players correlated significantly with low hamstring flexibility in preseason. Wit-
vrouw et al. (2003) also reported that the decreased flexibility of the quadriceps
muscles should be considered an intrinsic risk factor for injury. Screening of flexi-
bility for players should be conducted during preseason, and flexibility training
should be prescribed to players with reduced flexibility to lower the risk of deve-
loping a muscle-strain injury. That said, one must be pragmatic about this and rea-
lize that many other factors contribute to injuries in complex sports like soccer.
19.4.3 Important stretching guidelines for static stretching
• Never stretch without first getting the muscles to the right temperature, such
as by spending a few minutes jogging (a minimum of five minutes).
• Ensure the correct starting position and correct execution.
• Ensure a stable starting position.
• Find as many support points as possible.
• Stretch the muscle (group) slowly.
• Stretch until you feel some tension in the muscle (no pain).
• Hold this position for 10–20 seconds.
• Take care to continue breathing calmly and rhythmically.
• Concentrate on the muscle being stretched and check the tension.
• Return from the stretching position slowly.
• Repeat each exercise several times.
• All exercises should be done for both the left and the right side.
• Perform stretching techniques in a sufficiently warm room.
[email protected] 06 Aug 2018
FITNESS IN SOCCER
350
Stretching
SUMMARY
Stretching has a long tradition of use in soccer training programs, and this trend
will likely continue in modern soccer training. There is some evidence that pro-
longed static stretching before explosive power movements may be counter-pro-
ductive. Therefore, it is advocated that intense dynamic stretching should be
preferably performed before a match or training session. In addition to enhan-
cing performance, the long-term development of flexibility may also be impor-
tant for injury-prevention purposes. Physiotherapists should routinely perform
flexibility screening, so that tight, inflexible muscles can be identified and appro-
priate stretching exercises advocated. Static stretching performed after soccer
training seems the most suitable form of stretching for improving the long-term
flexibility of a soccer player’s musculature.
REFERENCES
•
Alter, M.J., 1996. Science of flexibility. Champaign, IL: Human Kinetics Publishers.
•
Bandy, W.D., Irion, J.M and Briggler M., 1997. The effect of time and frequency of static stretching on flexibility of the hamstring muscles.
Physical Therapy, 77, pp.1090-1096.
•
Beedle, B.B. and Mann, C.L., 2007. A comparison of two warm ups on joint range of motion. J Strength Cond Res, 21, pp.776–779.
•
Behm, D.G., Bambury, A., Cahill, F. and Power, K., 2004. Effect of acute static stretching on force, balance, reaction time, and movement
time. Med Sci Sports Exerc, 36, pp.1397–1402.
•
Behm, D.G., Bradbury, E.E., Haynes, A.T., Hodder, J.N., Leonard, A.M. and Paddock, N.R., 2006. Flexibility is not related to stretch-indu-
ced deficits in force or power. J Sports Sci Med, 5, pp.33–42.
•
Behm, D.G. and Kibele, A., 2007. Effects of differing intensities of static stretching on jump performance. Eur J Appl Physiol, 101,
pp.587–594.
•
Behm, D.G. and Chaouachi, A., 2011. A review of the acute effects of static and dynamic stretching on performance. Eur J Appl Physiol,
111(11), pp.2633–2651.
•
Bradley, P. and Portas, M.D., 2007. The relationship between preseason range of motion and muscle strain injury in elite soccer players.
Journal of Strength & Conditioning Research, 21(4), pp. 1155-1159.
•
Cowan, D., Jones, B., Tomlinson, P., Robinson, J. and Polly, D., 1988. The epidemiology of physical training injuries in US infantry
trainees: methodology, population, and risk factors. US Army Research Institute of Environmental Medicine Technology, NO:T4-89.
•
Covert, C.A., Alexander, M.P., Petronis, J.J. and Davis, D.S., 2010. Comparison of ballistic and static stretching on hamstring muscle
length using an equal stretching dose. J Strength Cond Res, 24(11), pp.3008-3014.
•
Gelen, E., 2010. Acute effects of different warm-up methods on sprint, slalom dribbling, and penalty kick performance in soccer players.
J Strength Cond Res, 24, pp.950–956.
•
Halbertsma, J.P., van Bolhuis, A.I. and Goeken, L.N., 1996. Sport stretching: effect on passive muscle stiffness in short hamstrings of
healthy subjects. Archives of Physical Medicine and Rehabilitation 77(7), pp.688-692.
•
Kay, A. and Blazevich, T., 2012. Effect of acute static stretch on maximal muscle performance: A systematic review. Medicine and Science
in Sports and Exercise, 44(1), pp.154–164,
•
Little, T. and Williams, A. 2003. Specificity of acceleration, maximum speed and agility in professional soccer players. J Strength Cond
Res., 19(1), pp.76-8.
•
Magnusson, S.P., Simonsen, E.B., Aagaard, P., Dyhre-Poulsen, P., McHugh, M.P. and Kjaer, M., 1996. Mechanical and physical responses
to stretching with and without preisometric contraction in human skeletal muscle. Archives of Physical Medicine and Rehabilitation,
77, pp.373-378.
•
Manoel, M.E., Harris-Love, M.O., Danoff, J.V. and Miller, T.A., 2008. Acute effects of static, dynamic, and proprioceptive neuromuscular
facilitation stretching on muscle power in women. J Strength Cond Res, 22, pp.1528–1534.
•
McNair, P.J., Dombroski, E.W., Hewson, D.J and Stanley, S.N., 2000. Stretching at the ankle joint: viscoelastic responses to holds and con-
tinuous passive motion. Medicine and Science in Sports and Exercise, 33, pp.354-358.
•
Murphy, J.R., Di Santo, M.C., Alkanani, T. and Behm, D.G., 2010. Activity before and following short duration static stretching improves
range of motion vs. a traditional warm-up. Appl Physiol Nutr Metab, 35, pp.1–12.
•
O’Sullivan, K., Murray, E. and Sainsbury, D., 2009. The effect of warm-up, static stretching and dynamic stretching on hamstring flexibi-
lity in previously injured subjects. BMC Musculoskelet Disord, 10, pp.37–42
•
Power, K., Behm, D., Cahill, F., Carroll, M. and Young, W. 2004. An acute bout of static stretching: effects on force and jumping perfor-
mance. Med Sci Sports Exerc, 36, pp.1389–1396.
•
Shellock, F.G. & Prentice, WX. 1985. Warm up and stretching for Improved physical performance and prevention of sports-related inju-
ries. Spts. Med., 2, pp.267–278. Taylor, W., Heller, M., Bergmann, G. and Duda, G., 2004. Tibio-Femoral Loading During Human Gait and
Stair Climbing. Journal of Orthopaedic Research, 22, pp.625–632.
•
Torres, E.M., Kraemer, W.J., Vingren, J.L., Volek, J.S., Hatfield, D.L., Spiering, B.A., Ho, J.Y., Fragala, M.S., Thomas, G.A., Anderson, J.M.,
Hakkinen, K. and Maresh, C.M., 2008. Effects of stretching on upper body muscular performance. J Strength Cond Res, 22, pp.1279–1285.
•
Walshe, A.D. and Wilson, G.J., 1997. The influence of musculotendinous stiffness on drop jump performance. Can J Appl Physiol, 22,
pp.117–132.
•
Witvrouw, E., Danneels, L., Asselman, P., D’Have, T. and Cambier, D., 2003. Muscle flexibility as a risk factor for developing muscle inju-
ries in male professional soccer players: A prospective study. American Journal of Sports Medicine, 31(1), pp.41-46.
•
Young, W., Clothier, P., Otago, L., Bruce, L., and Liddell, D. 2004. Acute effects of static stretching on hip flexor and quadriceps flexibility,
range of motion and foot speed in kicking a soccer. J Sci Med Sport, 7(1), pp.23–31.
•
Young, W., Elias, G. and Power, J., 2006. Effects of static stretching volume and intensity on plantar flexor explosive force production and
range of motion. J Sport Med Phys Fitness, 46, pp.403–411.
[email protected] 06 Aug 2018
FITNESS IN SOCCER
Strength training and functional training
351
20
STRENGTH TRAINING AND
FUNCTIONAL TRAINING
Lieven De Veirman, Glen Reed, Pieter Jacobs, Jan Van Winckel
20.1 INTRODUCTION
Strength training has evolved tremendously over the last decennia, with a great
deal of research trying to establish the fundamental principles of strength training.
Speed-strength (power) is often a decisive factor in modern soccer. Concurrently,
the somatotype of soccer players has also changed over the last few decades from
ectomorphic (e.g., Cruyff, van Basten, Platini) to more mesomorphic athletes (e.g.,
Ibrahimovic, Ronaldo, Kompany, Rooney).
In this chapter, we discuss the physiology of muscle strength and the various
strength training programs.
20.2 PHYSIOLOGY OF MUSCLE STRENGTH
20.2.1 Muscle fibers
The human body has different types of muscle fiber. The ratio of these muscle fibers
is certainly not identical in all muscles.
sport discipline
% ST-fibers
% FT-fibers
Distance runners
70-75
25-30
Swimmers
55-65
35-45
100 m sprinters
25-30
70-75
Weight lifters
45-55
45-55
Non-athletes
47-53
47-53
Soccer players
40-55
45-60
Table 20.1: Muscle fiber composition in different sports.
[email protected] 06 Aug 2018
FITNESS IN SOCCER
Strength training and functional training
352
Muscle fibers can be generally classified in two ways. On the one hand, they can be
classified based on the mATPase, but they can also be classified based on the myo-
sin heavy chain (MyHC) isoform identification. Based on the activity of myosine
ATPase, muscle fibers are classified as slow oxidative (or type I fibers), fast glycoly-
tic (or type IIb fibers), and fast oxidative (or type IIa fibers).
Myosin, more specifically the MyHC, is composed of three different forms or iso-
forms. Based on the identification of the MyHC isoforms present in the muscle
fibers, the MyHC forms (MyHC I, MyHC IIA, and MyHC IIX [often referred to as
IIB in older literature]) can be identified. However, there are muscle fibers in which
more than one form of MyHC occurs, and these hybrids contain two different
MyHC forms in different proportions. Based on MyHC, we can distinguish six dif-
ferent muscle fibers in a continuum from slow to fast: I, IC , IIC , IIA , IIax and IIX.
20.2.2 Muscle architecture
Muscle strength is dependent on the cross-sectional surface area of a muscle. When
muscle strength is expressed in strength per cm2, it does not differ all that much
between untrained athletes and those who have undergone extensive strength trai-
ning. It amounts to around 6.3 kg/cm2 in both cases. The difference in strength can
be predominantly attributed to a larger cross-sectional surface area.
Muscle strength also depends on the architecture of the muscle fibers. This is the
arrangement of muscle fibers, and it determines a muscle’s mechanical function.
Several different muscle architectures are described in the scientific literature, such
as triangular (m. pectoralis major), (uni)pennate (m. semimembranosus) and fusi-
form (m. sartorius). Force production and gearing vary depending on the different
geometries of the muscle (Moreau et al., 2010). In the rectus femoris (part of the
quadriceps) and the gastrocnemius muscle (part of the calf)—both of which are
unipennate, and bipennate muscles respectively—the muscle fibers have a feather-
like structure that almost doubles the muscular strength.
[email protected] 06 Aug 2018
FITNESS IN SOCCER
Strength training and functional training
353
20.2.3 Stretch-shortening cycle
The strength of a muscle increases (by 15%) if it is pre-stretched (Cavagna and Cit-
tero, 1974; Bobbert et al., 1996, Bobbert and Casius, 2005). This can be seen when
jumping, for example, in a counter-movement jump (CMJ) where the muscles are
first extended (bending the knees) and then stretched again (knees straightened).
If a muscle isn’t pre-stretched, such as in a squat jump (SJ), the movement is more
strength based.
Fig. 20.2: Difference between a CMJ and SJ. An SJ starts in an already loaded position, and there
is no stretch-shortening ability to provide power.
20.3 STRENGTH TRAINING AND THE NERVOUS SYSTEM
It is often wrongly believed that muscular adaptations from training take place
solely within the muscle itself. However, strength is generated by muscles that are,
in turn, governed by the central nervous system. The central nervous system deci-
des how many muscle units are recruited and whether synergist muscles might
be involved. It can also disable the antagonists or reduce their effects. The central
nervous system thus activates, synergizes and inhibits the muscles responsible for
a movement. Short stimulations of a few milliseconds provide for subdued move-
ment, while constant stimulation of the muscles can facilitate longer movement.
Fig. 20.3: Adaptations through strength training: Influence of training on strength, hypertrophy and
neural adaptation.
[email protected] 06 Aug 2018
FITNESS IN SOCCER
Strength training and functional training
354
Results will be achieved quickly at the start of the training program. It is there-
fore also in this period that new reference values need to be determined at regular
intervals in order to fine tune the strength training program. Strength training also
makes the muscles thicker (hypertrophy) over the course of time because of more
sarcomeres coming together.
The nervous system not only provides for the movement itself; it can also learn
to engage motor units faster during a particular movement. Finally, the nervous
system ensures maximum efficiency during a particular movement. It activates the
right motor units and makes them respond at just the right moment.
The good news is that these activities performed by the central nervous system can
be trained, but the training of isolated movements only teaches the nervous system
to perform the movement in question at the same angle and at the same speed.
For this reason, muscles need to be trained in a natural movement pattern during
training sessions. To increase kicking speed, for example, it would be insufficient
to simply train the strength of the quadriceps muscle. Although the strength of the
quadriceps may well increase, it will not result in greater kicking speed, because
the movement was not trained in an synergized way where all the muscles (e.g.,
quadriceps, hamstrings, etc.) produce the movement together.
However, some strength exercises do provide a crossover to sporting activities.
Many authors (Balsom et al., 1992; Wisloff, Helgerud and Hoff, 1998; Hoff, Berdahl
and Barten, 2001; Hoff, Gran and Helgerud, 2002; Wisloff et al., 2004; Deane et al.,
2005; Stone et al., 2006) have found evidence of increased strength levels correlating
to improved performance parameters.
20.4 TYPES OF STRENGTH
Fig. 20.4: The Force-Velocity Curve, which highlights the difference between the different training
modalities
[email protected] 06 Aug 2018
FITNESS IN SOCCER
Strength training and functional training
355
Four types of strength can be distinguished:
• maximal strength: The capacity of a muscle or muscle group to execute maxi-
mum strength against a resistance in one contraction
• explosive strength (power): The capacity of a muscle to overcome a relatively
high resistance as quickly as possible (e.g., In the first phase of a sprint, the
quadriceps need to use explosive strength to start the sprint.)
• strength endurance: The capacity of a muscle or muscle group to exert maxi-
mum strength over a certain period (e.g., consider running, where the muscles
of the body perform one and the same action)
• speed strength: The capacity of a muscle to overcome a relatively small
resistance as quickly as possible
These parameters can be easily interpreted via the Force-Velocity curve (Seen in
Figure 20.4).
Table 20.2: Exercise examples of the force-velocity curve, taken from Turner (2009).
20.5 TYPES OF STRENGTH TRAINING
These four types of strength can be used in different strength training sessions,
with each having a different objective:
• general strength training: These are the normal weight-training exercises that
strengthen the muscles and connective tissues.
• specific or functional strength training: This type of strength training is as
close as possible to the biomechanical requirements of the activity.
• preventive strength training: This type of strength training places an addi-
tional load on particular muscle groups in order to reduce the risk of injury.
20.6 PLYOMETRICS
Plyometrics is a special form of strength training. Plyometrics has its roots in the
former Eastern Bloc, where it was known as shock training. The term “plyometric”
comes from Latin, with the words “ply” representing progress and “metric” sig-
nifying a measuring rod.
Plyometrics is a training form that uses fast, explosive exercises to improve power
output and the neural (nerve) activation of the muscles. Plyometrics is based on the
physiological phenomenon of the stretch-shortening cycle (SSC), which, as mentio-
ned above, is based on the principle that when a muscle stretches quickly and then
contracts, the power the muscle can produce increases. The receptors located in a
muscle respond to the information that a muscle is getting longer. In the eccentric
phase, the muscle stretches, and the elastic energy is stored in the “series elastic
[email protected] 06 Aug 2018
FITNESS IN SOCCER
Strength training and functional training
356
component” (SEC) and the muscle spindles become activated. The amortization
phase is the time between the eccentric and concentric motions, and during this
phase, the type 1a afferent nerves synapse with the alpha motor neurons. These
alpha motor neurons then transmit signals to the agonist muscle group. Once the
amortization phase is complete, the concentric action occurs, which is the shor-
tening of the agonist muscle fibers. This causes the elastic energy to be released
from the SEC while the alpha motor neurons stimulate the agonist muscle group.
Wilson, Elliot and Wood (1991) found that the SSC had a half-life of 0.85 seconds
and that a contact time of over 1 second dissipated the effect of the SSC by over
55%. This finding is further supported by Cronin, McNair and Marshall (2002),
who found that the SSC has to be utilized within 0.2 seconds to prevent the effect
from being lost. This is why a short amortization phase is essential.
The mechanical model for musclotendinous behavior has a contractile element
(CE), which exerts active force during shortening; a series elastic component (SEC),
which serves to store the energy and later release it; and finally a parallel elastic
component (PEC), which stores the elastic energy in parallel to the contractile com-
ponent of the muscle (Bosco et al., 1982).
Fig. 20.5: Hills (1938) three-component model highlighting the interaction between Contractile (CE),
Parallel (PEC) and Series elastic components (SEC).
Schmidtbleicher (1994) divided the SSC into two types: short and long SSC. Short
SSC includes a ground contact time (GCT) of <250ms, involves small angles, and
is represented by exercises such as the drop jump or sprinting. A longer GCT
(>250ms) represents long SSC, where greater body angles are seen, such as is evi-
dent in exercises like jump shots.
There is plenty of evidence to support the use of plyometrics to increase perfor-
mance characteristics like running economy, sprint speed, and jump height, to
name but a few (Myer et al., 2006; Potteiger et al., 1999; Rimmer and Sleivert, 2000;
Spurs, Murphy and Watsford, 2003; Turner, Owings and Schwane, 2003, Paavolai-
nen et al., 1999; Vossen et al., 2000). Nevertheless, plyometrics is not applied that
often. This is not only due to a lack of knowledge but also to the fact that plyome-
tric exercises need to be prescribed with the necessary scientific background. The
normal method is to work with the body weight, which means that more than 70
kg of weight is used as the load for an adult man. Correct execution and the right
feedback are therefore very important.
[email protected] 06 Aug 2018
FITNESS IN SOCCER
Strength training and functional training
357
The quantification of plyometric exercise has recently been assessed via the measure
of the reactive strength index (RSI). The RSI is derived from the height jumped in
a depth jump and the time spent on the ground developing the forces required
for the jump (McClymont, 2008). A low RSI score essentially means an individual
can quickly change between an eccentric and concentric contraction (Flanagan and
Comyns, 2008). An athlete with a good SSC ability will be able to tolerate a higher
load in the form of a higher drop jump.
Fig. 20.6: Formula for calculating the RSI. An RSI can be increased by increasing jump height and/
or decreasing contact time
Flanningan and Comyns (2008), proposed that strength and conditioning coa-
ches can determine the optimum height for depth-jump activity by using RSI
over a range of jump heights (e.g., 15, 30, 45cm). If the RSI is either maintained or
improved by increasing depth-jump drop height, then it can be assumed that the
individual’s reactive strength capabilities are sufficient for that jump height. If the
RSI decreases at a certain drop height, it will be beyond the fast SSC threshold, and
this may indicate a heightened risk of injury.
Flanagan and Comyns (2008) designed a four-phase model for the progression
of fast SSC exercise. A progressive program is required to ensure all movements
are performed using a correct technique because of the fatiguing and high-impact
nature of the exercise. The reader is advised to read Flanagan and Comyns (2008)
for more information on the breakdown of each phase.
Fig. 20.7: Flanagan and Comyns (2008) four-phase model for developing fast SSC properties.
[email protected] 06 Aug 2018
FITNESS IN SOCCER
Strength training and functional training
358
20.7 SETTING UP GENERAL STRENGTH TRAINING PROGRAMS
20.7.1 Determining the maximum
The measuring of 1 RM (repetition maximum) is important for determining the
number of repetitions. It is the weight that can be repeated just once. Make sure the
player can perform the exercise with proper technique when measuring 1 RM. If
the player shows insufficient training experience, a 3–5 RM measuring can be used
and 1 RM can be “calculated.” Set out below is a description of how the 1 RM value
can be determined:
• Warm up by performing 5–10 repetitions at around 40%.
• Rest for 1–2 minutes.
• Stretch the muscle group.
• Carry out 3–5 repetitions at 70%.
• Try the weight you think you will be able to repeat once.
• Wait for 3 minutes.
• Try again with more weight if it was too easy or less if the weight felt like too
much.
20.7.2 Organizational forms of strength training
• Equal load and repetition: This form is ideal for getting used to the various
exercises. It is also used to realize a specific objective. For example, the training
of speed-strength can be achieved with a constantly high number of repetiti-
ons at low resistance. This organizational form should be used to get the play-
ers used to strength training.
Example: Three sets of eight repetitions at 70% of 1 RM.
• Equal load and varying repetition: This form is used to mix speed-strength
and explosive strength. The load is set at 60–70%, with the number of repetiti-
ons varying between 6 and 15.
Example: One set of eight repetitions plus one set of 12 repetitions plus one set
of eight repetitions at 65 % of 1 RM.
• Equal repetitions and varying load: The objective of this form is to familiarize
the muscle with different types of loads.
Example: Three sets of ten repetitions at 60, 70, and 80% of 1 RM.
• High pyramid: This form will improve maximal and explosive strength. The
number of repetitions is low, but the load is high.
Example: Seven sets: Eight repetitions at 80% of 1 RM, six repetitions at 85%,
four repetitions at 90%, one repetition at 100%, four repetitions at 90%, and six
repetitions at 85%.
• Low pyramid: This form is used to train muscle endurance as well as speed-
strength. The load is lower, but the number of repetitions is higher.
Example: Seven sets: 20 repetitions at 50% of 1 RM, 15 repetitions at 60%, ten
repetitions at 70%, six repetitions at 80%, ten repetitions at 70%, 15 repetitions
at 60%, and 20 repetitions at 50%.
[email protected] 06 Aug 2018
FITNESS IN SOCCER
Strength training and functional training
359
• Complex Training: This alternates biomechanically similar high-load
weight-training exercise with plyometric exercise, set for set, in the same wor-
kout (Ebben, 2002). This creates a post-activation potentiation of the muscle
and allows the use of multiple training types.
Example: Five sets of 3–5 repetitions at 80% of 1 RM followed by five sets of 3–5
counter-movement jumps. Rest is much higher due to the nature of complex
training.
• Cluster Training: This comprises an intra-rep rest of anywhere between 15–30
seconds. There are generally two types of cluster-training methodology: 1)
undulating, where the resistance is increased in a typical pyramid fashion
(Haff et al., 2003) and 2) ascending, where the resistance is increased after each
successive repetition.
Example: One to three sets of 10x1 repetitions at 85% of 1 RM with 15 seconds
rest between each rep (i.e., 1 repetition completed 10 times with 15 seconds
rest between repetitions).
20.7.3 Effects
• Single versus multiple sets:
The greatest training effect is achieved in the first set of repetitions. Although
the following sets also generate an additional effect, this is far less than in the
first set. If there is not much time available, it can be beneficial to do just a sin-
gle set of each exercise.
• Frequency (number of training sessions per week):
Recent research shows that two or three strength workouts per week are ideal.
Further training sessions do not provide for much further improvement in
performance. Different forms of strength training can be organized, of course,
enabling the frequency to be increased.
• Number of repetitions:
Three to five repetitions are best for devolving strength biomotors (Turner,
2009).
• Intensity:
It is best to keep the intensity of training between 85–100% of 1 RM. This inten-
sity range will generate the greatest effect.
[email protected] 06 Aug 2018
FITNESS IN SOCCER
Strength training and functional training
360
20.8 GENERAL STRENGTH TRAINING EXERCISES
We give a number of examples of general strength training exercises below. Toward
the end of this section, we will discuss other training modalities (e.g., stability ball,
TRX, medicine ball, etc.).
✓ Bent-over Row
• Muscles: Trapezius, Rhombiods, Latisimus Dorsi, Teres Major, Teres Minor,
Deltoid (Posterior), Biceps Brachii
• Execution: Player stands in an athletic stance, bending the torso to an angle of
approximately 45 degrees. Keeping the back straight, the player “rows” the
bar to his chest with an overhand grip.
A
B
Fig. 20.8: A) Start Position of the Bent-Over Row: Back stays flat, not rounded, so lumbar spine
stays strong. B) Finish position: Elbows tucked in, and bar being pulled into chest.
✓ Split Squat
Fig. 20.9: Split Squat
Fig. 20.10: Rear Foot Elevated Split Squat
[email protected] 06 Aug 2018
FITNESS IN SOCCER
Strength training and functional training
361
• Muscles: Quadriceps, Hamstrings, Glutes
• Execution: Stand with feet in a staggered stance. The idea is to then lower the
body, keeping your back straight so the back leg is bent. Continue the descent
until the knee is just above the floor and then drive back up. If working with
women, you should ensure the Q angle is at a minimum. This can also be
done with the rear foot elevated.
✓ One-legged squat
The player positions himself in a similar position
to the goblet squat, but in this case, one foot is in
the air, placing all the movement on the standing
leg. Ensuring the same coaching points noted
above (i.e., chest up and out, core engaged, weight
coming through heel, back straight), we squat
down as low as possible before requiring an ascent
to finish the movement. Players can in turn perfect
this by adding in load or doing it from a bench to
get greater depth.
Fig. 20.11: One-legged squat
✓ One-legged hopping on the spot
This uses the same basic position as the one-legged squat. The player hops quickly
on his left leg at a rate of three jumps per second for 40 seconds. The right foot
remains in the same position and the hips are fixed. The player ensures that he
lands on the mid-foot. The same procedure is then repeated with the right leg.
✓ One-legged squat with a lateral hop
This also uses the same starting position as the one-legged squat. The player bends
his right knee at an angle of 90° and hops on his left leg 10cm to the outside and
then back to the center. The player then hops laterally and returns to the center.
Fig. 20.12: Shoulder rehabilitation circuit
– W, T and Y.
[email protected] 06 Aug 2018
FITNESS IN SOCCER
Strength training and functional training
362
Fig. 20.13: Player holds a plank position while rolling the
ball out in front of the body, keeping the hips, back and head
inline. By rolling the ball away, it places stress on the core.
Fig. 20.14: Stir the
Pot: The player
holds similar position
as above, but this
time he rolls the ball
around in a circle
using the forearms,
placing stress on the
obliques.
20.9 TRX/SUSPENSION TRAINING.
Many clubs now also incorporate suspension training into their strength program-
ming for players, and this adds a great deal of variety to a program. The advantage
of the TRX is that it is compatible with most places (most come with a door hinge),
so even when travelling, strength training can still be completed. It allows you to
train the entire body, and you can combine movements for greater complexity (e.g.,
train in all planes of motion). When using a suspension training system, it is impor-
tant to remember the following:
• Ensure the suspension trainer is used under supervision at all times in order
to guarantee correct execution.
• It is imperative that the body stays in line (e.g., not breaking at the hips and
the back is not hollow).
• The head should always be kept in a neutral position.
• Vary the angle of the trainer, because the steeper the angle is, the easier the
movement will be.
Some examples of exercises using the TRX/suspension trainer are highlighted
below:
[email protected] 06 Aug 2018
FITNESS IN SOCCER
Strength training and functional training
363
✓ Single-Arm, Single-Leg, Straight-Leg Deadlifts.
• Muscles: Hamstrings (Semitendinouis,
Semimembranouis and Bicep Femoris).
Gluteus Maximus, Glutes Medius, Erector
Spinea.
• Execution: Just put one foot in a TRX set
to approximately knee height, so the leg
is bent at around 90 degrees. Any higher
may be uncomfortable. From there, hinge
at the hips and reach the leg in the TRX
straight back behind you, making sure to
keep a flat back.
Fig. 20.15: Single-Leg, Single-Arm Deadlift.
Dumbbell is held in the opposite arm to the leg.
During descent, push the leg in the suspension kit away
while maintaining a flat back.
✓ Single-Leg Squat (Pistol Squat).
• Muscles: Hamstrings (Semitendinouis,
Semimembranouis and Bicep Femoris),
Gluteus Maximus, Glutes Medius, Qua-
driceps (Vastus Lateralisal, Vastis mee-
diatialis, Vastus intermediasis & rectus
femoris).
• Execution: Stand on one leg. Slowly lower
yourself down—keeping your back flat,
chest up and proud, and core engaged.
Ensure the weight is moving onto the heel
as the descent continues. As you reach the
bottom, drive up using the heel and hips
(but not the back) to starting position.
Fig. 20.16: Pistol Squat
✓ Chest flies
• Muscles: pectoralis major, deltoi-
deus, triceps brachii, anconeus
• Execution: Start off in the position
above, but instead of lowering
yourself into a press-up position,
the arms come out to the side,
forcing you to lower down. The
movement is similar to a pec fly.
Fig. 20.17: Pec Fly
[email protected] 06 Aug 2018
FITNESS IN SOCCER
Strength training and functional training
364
✓ Leg Raises
• Muscles: Rectus Abdominis, Ten-
sor Fascia Latae, Obliqus exter-
nus abdominis, rectus femoris
• Execution: Holding yourself up
with elbows soft (not locked
out), keep your posture upright,
inhale, and bring your knees to
your chest.
Fig. 20.18: Leg Raises
✓ Plank
• Muscles: Transverse Abdominus,
rectus abdominus and erector
spinae.
• Execution: This is an isometric
exercise that requires you to hold
a position (bridge) between your
forearms and toes. Ensure that
your hips, back and head stay in
line, drawing the abdomen in and
contracting the glutes as well.
Fig. 20.19: Plank
20.10 MEDICINE BALL
The medicine ball can be incorporated
into training to help develop the for-
ce-velocity curve. Medicine balls are a
great tool in helping to develop explo-
sive power and rotational strength, and
they add variation to programs. You
can use different weights of medicine
balls for repetition ranges, different
sizes (e.g., Slam Balls, etc.) and different
surfaces to deliver a training stimulus.
As a power exercise, the medicine ball
is great because it can help with triple
extension of the ankle, knee and hip (all
required in sprinting mechanics, jumps,
etc.). You can also use these in normal
training, such as press-ups on a medi-
cine ball. A few uses of medicine ball
exercises are highlighted below.
✓ Medicine Ball Slam
Fig. 20.20: Medicine Ball Slam: Extend through
ankle, knee and hip, slamming the ball onto
the floor.
[email protected] 06 Aug 2018
FITNESS IN SOCCER
Strength training and functional training
365
✓ Behind-the-head throw
Fig. 20.21: Medicine ball behind-head throw:
The ball is thrown behind the head backwards
or up into the air. Once more, ensure that
triple extensions of the ankle, knee and hip are
prominent throughout the movement.
✓ Rotation throws
Fig. 20.22: Rotation Throws: The ball sits on
one side of the body. Rotate through so the ball
is thrown against the wall.
✓ Chest press
Fig. 20.23: Chest Press: This can be done
simply in an athletic position or add a jump
before throwing. Again ensure extensions of the
ankles, knees and hips.
✓ Back Twist Throw
Fig 20.24: Back Twist Throw: With your back
to the wall, turn and throw the ball side to side.
This helps to develop rotational power.
[email protected] 06 Aug 2018
FITNESS IN SOCCER
Strength training and functional training
366
20.11 FUNCTIONAL STRENGTH TRAINING FOR THE SOCCER PLAYER
20.11.1 Introduction: What actually is
“functional”?
“Functional” is a very broad term that may mean different things to different peo-
ple. Something that is “functional” for one person may not be for others. The ques-
tion is rather more like whether something is “functional for whom” or “functional
for what.” What is functional for you is determined by the person responsible for
you and your training. Functional training is much more than squatting, pulling,
pushing, and using all kinds of “functional” fitness equipment.
How many ways are there to squat and lunge? The answer is simple: an infinite
number of ways. A squat to lift a box from the floor is different to a squat you do
to get something from the bottom of the fridge. Look at how many different squat
and lunge positions a soccer player finds himself in during a match or training ses-
sion. Functional movement is very complex for soccer players because they get into
numerous different positions and situations during a match.
The aim of functional training is to prevent injuries from occurring in these various
situations and eventually also become stronger in these situations. To achieve this,
it is important to train movements and not muscles. We want to prevent injuries
when a striker shoots hard at the goal or when a defender blocks a shot. Also, we
want the goalkeeper to be able to punch away a high cross powerfully and explo-
sively. We can incorporate these specific movements of soccer into our strength
training. Does this mean that we cannot lift any heavy weights or that hypertrophy
training has to be functional? Of course not. There is nothing wrong with a soc-
cer player with a large muscle mass, nor is there anything wrong with lifting hea-
vier weights. However, when it comes to specific strength training for soccer and
wanting to make our players stronger in the various movements on the pitch, we
should perhaps apply a somewhat more functional thought process. We want to
take advantage of that muscle mass in a positive manner.
All exercises can be featured on a functional training continuum, such as the
following:
Least Functional
Most Functional
Leg Press
– Machine Squat – Barbell Squat – One-Leg Squat Airex Pad – One-Leg squat
Least Functional
Most Functional
Machine Bench Press
– Bench press – DB Bench press – Push-Up – Medicine Ball Chest Pass
These are just a few examples of exercises along the continuum, but other examples
include hop-dominant, vertical press, horizontal pull, and torso exercises.
[email protected] 06 Aug 2018
FITNESS IN SOCCER
Strength training and functional training
367
20.11.2 Specific strength training / Basic principles of functional training
It is easier to describe the notion of “functional” by introducing and explaining a
few basic principles related to functional training. Functional movement patterns
are individual and sport specific, yet they are based on a number of universal prin-
ciples that help to determine our analysis, testing and training.
20.11.2.1 Functional training is Three-dimensional
We constantly move in three dimensions (simultaneously) during functional acti-
vities. The three planes are forwards-backwards (sagittal plane), left-right (frontal
plane), and left-right rotations (transverse plane). This means that each joint can
move in six different directions, so we absolutely have to take account of this in our
training. We very often observe that only the sagittal plane is discussed in strength
training. Weight machines, in particular, are frequently limited to movements in
this plane, while we find that most injuries occur in the transverse plane through
extreme rotations (cruciate ligament injuries are a good example of this). It is impor-
tant to understand how each muscle and joint moves functionally in the three pla-
nes, and we certainly need to train them in these three planes. For example, when
the knee finds itself in the valgus position, only the muscles that are activated at
the right moment and respond properly can inhibit the movement and prevent the
knee from twisting too far and damaging the anterior cruciate ligament.
20.11.2.2 Integrated
It is also important to understand that any change in one plane has consequences
for the other planes. Each influence on a system has consequences for other subsys-
tems. The body is an integrated whole in which bones, muscles, joints, ligaments,
proprioceptors and the nervous system work together in order to function. It is not
functional to isolate one of these systems and train it separately, even if that were
even possible. There is no such thing as proprioceptive training. The proprioceptors
are trained all the time, and the nervous system is stimulated constantly. Whether
we are lying down, sitting or standing up, we are always giving signals through
the proprioceptors. In our strength training, we can ensure that we stimulate the
nervous system in a functional way so the muscles respond in the most appropriate
manner. By holding a static position during a “plank,” or by consciously driving
the knee above the second toe, but not past the toes, we give limited information to
the proprioceptors, causing them to perhaps not respond appropriately if our body
then unconsciously makes a potentially dangerous movement.
20.11.2.3 Taking account of gravity, mass and ground reaction forces
We are constantly subjected to gravity and ground reaction forces. When we stand
up straight and take a step forward and run, jump, and so on, there are movements
in our muscles and joints that are caused by gravity and other influences that result
from ground reaction forces. The front foot will pronate, the knees and hips will
bend, the body will stoop forward and bend laterally, and so on. We will therefore
not spend any time on the m. tibialis posterior, for example, to create eversion in
the foot. For the same reason, we will not focus on the hamstrings to bend the knee,
nor will we focus on the hip flexors (muscle group) to bend the hip. In an upright
position, rather than these movements being brought about by the muscles, they
merely slow down the opposite movements. For example, when we are standing
[email protected] 06 Aug 2018
FITNESS IN SOCCER
Strength training and functional training
368
up, the abdominal muscles do not bend the torso. The body does not have to exert
itself to lower the head to the knees when it is upright, because it is done by gravity.
For this reason, we train the muscles in a functional way in our coaching (by stret-
ching them) and, as a result, it’s clear that there is little point in doing exercises like
crunches. Ground reaction forces are everywhere on the soccer pitch, and they are
absorbed by the body upon landing from a jump or planting a foot to change direc-
tion or decelerate. It is therefore important that athletes are aware of these forces.
20.11.2.4 3D load
– 3D unload
Initially, gravity would appear to impede us in all our movements. It causes a stoo-
ped posture when we are older, prevents us from being able to jump high, makes
the ball drop faster from a throw-in, and makes us work harder if we want to pick
something up. In biomechanical terms, however, gravity is the greatest ally in all
our movements.
Without gravity, there would not be any load phase, and we would be unable to
unload in the opposite direction. Just try jumping without first bending your knees.
We want to go up, but the body first goes down in order to load the muscles before
jumping up. Likewise, a goalkeeper will first rotate backwards before throwing the
ball. In most situations the goalkeeper will be running forward and the arm and
ball will trail behind him due to momentum. This will create a lengthening (eccen-
tric load) of the anterior muscle chain and result in an unload (the throw). It is
therefore important to consider what gravity does to us in the three planes of move-
ment. How does it use the movements to activate the proprioceptors, and how do
these activate the muscles so we get the desired chain reaction in the body? They
have to be able to provide both mobility and stability in order to absorb or slow
down a movement. The energy stored by the muscles during stretching (eccentric
loading phase) is then used to create the opposite movement (concentric unloading
phase). It is therefore necessary to first analyze the movements made by a soccer
player during a match in order to then create a training environment and exercises
that include the same movements. The stronger and more flexible a soccer player is
in the loading phase, the more powerful the unloading phase will be.
[email protected] 06 Aug 2018
FITNESS IN SOCCER
Strength training and functional training
369
20.11.2.5 Controlled movements: Conscious intent and unconscious reaction
All our movements are influenced by where we are looking, what our hands are
doing, or what our intention of movement is. This means that a soccer player
consciously kicks a ball toward the goal, but it’s his body that decides the way in
which to execute the task. We cannot consciously activate muscles and move joints
or decide which movement comes from which part of the body. This all occurs
subconsciously. This also means the body will take the path of least resistance, so
muscles and joints with limited mobility or flexibility will be drawn on less, so
other joints and muscles have to compensate for this. This can unfortunately lead
to overload.
Movement occurs subconsciously. Proprioceptors respond subconsciously and
activate muscles without us having to think about the process. We could there-
fore question why we ask our players in a strength training session to keep their
knee over their foot during a lunge and not let it extend beyond the toes. We could
also question why we ask players to consciously tense their abdominal muscles
during the plank exercise. The conscious stimulation of muscles and controlled,
rigid movements are far removed from what actually happens on the soccer pitch.
It misleads the proprioceptors and prevents or impedes movements that then occur
on the pitch. In every training exercise, particularly in the context of injury protec-
tion and strength training, it is important to let these subconscious movements and
reactions take place. This way, the body also knows what it needs to do when it is
confronted with the same movements on the soccer pitch.
20.11.2.6 Kinetic Chain
It is unnecessary to explain that the body is a whole. The foot is attached to the
ankle, the shinbone, the knee, the hip, and so on up to the head and the arms. If
I stand upright with my right hand extended to the left, this influences the entire
body. My upper body rotates to the left, as does my pelvis. My right foot will turn
inwards and my left foot outwards. All the muscles and joints move in a chain reac-
tion, and this is often referred to as the kinetic chain. In addition, the most remar-
kable aspect is how this all occurs subconsciously. For a particular movement on
the pitch (e.g., a goal kick taken by the goalkeeper) it is important to know what
influence the hands, eyes, and kicking foot have on the rest of the body. This is the
only way we can prepare our players in an optimal manner during strength trai-
ning sessions for all the movements that can occur on the soccer pitch.
20.11.2.7 Growing Stronger and Reducing injuries
It is important that through functional training we are making our muscles stron-
ger and therefore more resilient to injury. The main thing we want as a medical
department is zero or minimal non-contact injuries. Many coaches use functional
training because it sounds good, but they fail to perfect a move before adding load.
This means that if an athlete can’t bodyweight squat with the correct technique, it
is then worked upon. We don’t take a shortcut to correct the imperfection so we
can add load, because this will create a problem elsewhere in the kinetic chain.
Growing stronger means we can tolerate more load through the body, so the body
will be able to handle more sprints, decelerations and changes in direction. It is
important that exercise selection is functional based, so instead of using leg-exten-
sion machines, we use a split squat. It is also important to note that not all exercises
[email protected] 06 Aug 2018
FITNESS IN SOCCER
Strength training and functional training
370
need to be functional to the sport. Olympic lifting movements like the clean, jerk
and snatch are explosive movements that will promote a greater rate of force deve-
lopment, teach hip extension, and load the hamstrings eccentrically in the catch
positions. Although the exercise movement is not a soccer action, it is functional
because of the benefits of the exercise.
20.11.3 Training soccer movements: Specific strength training for soccer
players must resemble soccer
The basic principles form the guideline and foundation for the creation of exercise
programs. We do not want to just haphazardly give the players some exercises to
do and then leave them to their fates. This is why it is important to have a certified
strength coach and have all sessions completed with supervision. When we set
up an exercise program, it is equally important to know how players move, both
as a player and as a coach, and this is often the only thing we do not learn in rela-
tion to strength training. Most information concerning strength training is based
on anatomical research carried out on bodies in a laying position. We learn a lot
about individual muscles in isolation, but the body only knows about movements
made by several muscles together. Each time a joint moves, a large number of mus-
cles play an important role. One muscle is stretched, another muscle shortens, and
other muscles stabilize, with all the muscles working together. Muscles respond
to movement by creating movement themselves, and, as already mentioned, they
are subject to various forces that they control and stabilize before themselves deve-
loping the desired power. A specific movement of a joint in a particular plane of
movement can be obtained in five different ways. Although it goes without saying
that the form of the joints, as well as the muscles and ligaments, can limit or prevent
a particular movement, the principle applies in every joint. An example of this is
given below.
The extension in the hip created before a player kicks a ball can be obtained by:
• leaning the body back without moving the leg
• bringing the leg back without moving the body
• raising the leg and leaning the body back, but letting the body move faster
than the leg
• leaning the body forward and bringing the leg back, but letting the leg move
faster than the body
• leaning the body back and also bringing the leg back
In soccer, the extension is mostly created by the final method above through the
momentum in the run-up to the ball. In this way, we can analyze each movement in
each joint at any moment and then incorporate this into the strength training sche-
dule. The better we can incorporate soccer movements into strength training, the
greater the transfer of strength training to the soccer pitch will be.
20.11.4 Stability and mobility
For soccer players, it is also paramount to not remain neutral but rather be able to
pass through a neutral position in the different planes of movement and control
these movements subconsciously, therefore being able to respond appropriately via
the proprioceptors and the muscles. In other words, can a player become destabi-
lized in a soccer-specific position or movement and still control it? Also, can the
[email protected] 06 Aug 2018
FITNESS IN SOCCER
Strength training and functional training
371
player carry out his movement more quickly, with a greater ROM, or a heavier
load? We will once again use the motor skills of a specific movement to make a
player better and stronger.
In recent times, the strength training continuum has shifted to a joint-by-joint
approach initially put forward by coaches such as Mike Boyle and Gray Cook. This
approach looks at the body from the ground up and determines which joints need
stability or mobility to maximize performance gains. It is important to add that all
joints require both mobility and stability, but they will be at different points on a
stability-mobility continuum. Stability is a part of mobility, and the body must be
able to move in a mobile and stable way. Stability without mobility is rigidity. This
breakdown ultimately helps us understand how many common injuries occur. An
example for this would be if the ankle lacks mobility (Range of Motion), there will
be implications further up the joint-by-joint approach, normally found in the next
joint up, the knee in this example. The Functional Movement Screen (FMS) created
by Gray Cook is one example of how mobility or stability issues within the joints
might be highlighted.
20.11.5 Transition zones
The transition zones are the extreme stretch zones of a movement when transfer-
ring from one movement to another. Most movements in soccer have two transition
zones. When kicking, there is a transition zone where the kicking leg transfers from
the rear-swinging phase to the forward-swinging phase. After the ball has been
kicked, the leg swings through and is slowed down in the second transition phase.
Both zones are equally important, and it is useful to train in both zones in order to
get stronger and avoid injuries. The aim is not to train directly and constantly in
one maximal eccentric position, but it is necessary to know how far a player can
go and how strong he is in this zone. It is usually in these zones that a player will
sustain injuries. The transition zones are individual and sport specific. As coaches,
we can set up and adapt strength training programs based on a player’s individual
potential.
20.11.6 Proprioceptors
The proprioceptors have already been mentioned a few times in the preceding sec-
tion. They are sensory organs located in the muscles, ligaments, joint capsules and
so on. They convert physical input and movement information into electrical sig-
nals that are sent through the body. This information is transmitted to the spinal
column and the brain, although bridging this distance would often take too long
for the information to be received by the muscles and allow them to respond. It
is highly likely that there is also a direct network between the muscles and the
joints in the fascia and the tissues in order for this information to get to the mus-
cles more quickly. There are various proprioceptors: the Pacinian corpuscles, the
Golgi-Mazzoni corpuscles, the Ruffini corpuscles, the Golgi ligament endings, free
nerve endings and muscle spindles. They all have a different sensitivity, adapting
quickly or slowly to a constant stimulus, and they are located in different places in
the muscles, joints, joint capsules, ligaments and fascia. This means that the pro-
prioceptors are difficult to see, and although we do not know exactly how they
work, it is clear that we have to take them into account. When we talk about move-
ments, muscles and joints, we know that although a proprioceptor gives certain
[email protected] 06 Aug 2018
FITNESS IN SOCCER
Strength training and functional training
372
information, we need all the information from all proprioceptors in order to have a
clear picture of what is happening in the body. It is for the proprioceptors, in par-
ticular, that we incorporate functional training and soccer-specific movements into
our coaching. The question we ask ourselves is how we can integrate the proprio-
ceptors into our training in an efficient as possible manner. Proprioceptive training
is often discussed in the area of rehabilitation or training. This creates a false picture
of what the proprioceptors exactly do. Proprioceptors are present everywhere in
the body, constantly emitting signals for movement. We cannot turn them off, and
non-proprioceptive training does not exist. We must therefore ensure that we train
in a functional way in order to stimulate the proprioceptors in the correct manner.
20.11.7 Practice
✓ Analyzing soccer movements
Now we have all this information, as well as some idea of what functional training
means for a soccer player, there perhaps remains the question of how to do this and
what exactly to do. For this reason, we will also analyze a soccer-specific movement
in this chapter and devise an exercise program for it. The most obvious movement
is shooting for goal.
We analyze the positions of the bones in the right hip joint during the load phase
before kicking and the swing phase after kicking:
• Before kicking: flexion, abduction, external rotation
• After kicking: flexion, abduction, internal rotation
The movement carried out in the right hip during the kicking motion is: flexion
(from a bent position to a more bent position), adduction (from abduction to adduc-
tion) and internal rotation (from externally rotated to internally rotated).
An additional factor is that all of the movement takes place on one leg. In our trai-
ning, we will start with what the player in question is most successful at. This could
be on two legs with the support of the hands, for example, depending on his or her
possibilities. Ultimately, we want to do everything possible to get to the stage of
single-leg training exercises.
Although the above examples are soccer-specific actions, soccer movements are
also short, sharp, dynamic movements that should never be forgotten. The ham-
strings need to be strong to handle the loads placed on them.
✓ Setting up exercises
The program for training the preceding movement can consist of three parts. We
want to make the player more flexible and stronger in the position prior to kicking,
in the position after kicking, and in his movement while kicking. Depending on
our objective (e.g., flexibility, mobility, strength, etc.), we can add weights or other
training equipment to the exercises. We can also vary each position and movement
in the three planes of movement. Depending on the player, we will begin with an
easy or more difficult exercise.
[email protected] 06 Aug 2018
FITNESS IN SOCCER
Strength training and functional training
373
Set out below is a series of exercises for the different components of the kicking
movement:
✓ Position before kicking (these exercises create extension, abduction and exter-
nal rotation in the kicking leg
Fig. 20.25: Forward lunge: Swing
the arms over the front leg.
Fig. 20.26: Forward lunge from a
raised position: Swing the arms
over the front leg.
Fig. 20.27: Jumping forwards
from a one-legged position:
Swing both arms over the front
leg.
[email protected] 06 Aug 2018
FITNESS IN SOCCER
Strength training and functional training
374
20.11.8 Drawing up a plan
The intensity and sequence of matches during a season require thorough plan-
ning of all aspects that are important to a soccer player. Modern-day soccer has
become very demanding on the physical capacities of the athletes. Players have
to be strong, fast and powerful, yet also able to sustain this for 90 minutes. At the
same time, a coach also wants his best players to be able to play in all matches by
avoiding injuries as much as possible. A player must therefore be as fresh as pos-
sible on the day of the match while also being able to train as hard as possible bet-
ween matches. For this reason, each aspect of strength training also has its place in
the plan for the season and the match. It goes without saying that we will not plan
any functional strength training with weights for the days before or after a match.
However, we can incorporate injury-prevention exercises or functional flexibility
training into the warm up for a training session or in a brief strength training ses-
sion on those days. If we assume that all our exercises are functional, we can then
propose the following weekly plan:
[email protected] 06 Aug 2018
Day after or
before match
day
1
2
-4
-3
-2
-1
Game (training
not selected
players)
Intensity match
rest/low
medium
high
high
low
low
high
Type of training
Preactivation
Preactivation
Preactivation
Preactivation
Preactivation
Preactivation
Upper body
Upper body
Whole
body
Whole
body
Upper body
Whole body
core
core
core
core
core
licha
flexibility
flexibility
flexibility
flexibility
Injury prevention
Injury prevention
Injury prevention
Injury prevention
Injury prevention
Table 20.2: Weekly Plan
F
IT
N
E
SS
IN
S
O
C
C
E
R
Str
en
g
th
tr
a
in
in
g
a
n
d
fu
n
ct
io
n
a
l tr
a
in
in
g
37
5
[email protected] 06 Aug 2018
FITNESS IN SOCCER
Strength training and functional training
376
Preactivation is the dynamic preparation of the muscles for what they will be doing
on the pitch. This can be done in a very functional way, with body weight and with
movements that also occur on the pitch. We want to make the proprioceptors and
muscles alert with light eccentric movements without causing fatigue or muscle
damage. This is done, in principle, for each training session and match.
Pure strength training with additional weight has to be structured very carefully.
The upper body can be stimulated almost every day without affecting physical
readiness later on the pitch. However, we even try to do upper-body training in an
upright position as much as possible and with movements similar to those used
on the pitch. Hypertrophy training can also be carried out in a functional way and
with transfer to soccer.
Full-body training or inclusion of the lower body in strength training requires a
very controlled and cautious approach. This also applies to functional flexibility
training. Players who have not had any experience of this can suffer from muscle
stiffness in the first few training sessions. As coaches, we have to take this into
account because it can have a direct impact on pitch training. Professional soccer
[email protected] 06 Aug 2018
FITNESS IN SOCCER
Strength training and functional training
377
players often train at their limits, and any additional stimulus on the legs can push
them over the limit. Although this has to be taken into account, this type of training
certainly has its place in the players’ weekly training schedule in the context of
injury prevention and flexibility.
Finally, core training has also been included in the schedule. The muscles in the
hip and abdominal regions are often consciously tightened during these training
sessions.
We explained earlier that muscles function in a different way, and this is why we
will also work as dynamically as possible in these training sessions. The “core” is
an important link in all the movements made on the pitch, so it is important to train
it in these movements. This can also be very functional and upright. The explosive
throwing of medicine balls from different positions is a very interesting option here.
[email protected] 06 Aug 2018
FITNESS IN SOCCER
Strength training and functional training
378
This weekly plan is of course only an example, and we do not for a moment claim
that this is the best plan for all of the players all of the time. For example, a player
may need more focus on prevention because of recurring injuries. In the case of a
less athletic or younger player who is not selected so much, greater attention can be
paid to full-body training. The content of strength training sessions is different in
the preparation stage than it is in the middle of the season, when there is a succes-
sion of weekend and midweek matches.
In a broader plan (e.g., over four weeks), we can ensure we vary the exercises and
alter the intensity and weight lifted. For example, we can spend one week impro-
ving the movements needed for jumping and heading, as well as preventive work
on ankle injuries and calf flexibility. Then the following week, we can pay more
attention to the kicking movement and avoiding injuries in the hip region. We can
vary this with repetitions, work-rest ratios, planes of movement, and so on.
SUMMARY
In this chapter, the physiology of muscle strength and various strength training
programs were discussed. Strength training in soccer is now an essential com-
ponent of the training week and should be incorporated in the weekly training
program when possible. Strength training should be periodized into the annual
training program in order to enhance performance and to reduce the risk of inju-
ries. Stronger players can sprint quicker, jump higher, and change direction more
efficiently, and they may also be more resilient to injury than weaker players.
Heavy two-legged strength exercises such as the squat can be used to improve
maximal strength, while one-legged exercises such as the pistol squat can be
performed to improve functional strength. Improving upper body strength can
help a player to push opponents off the ball and win aerial duels. Core stability
exercises should be performed as often as possible to improve pelvic stability
and control in order to reduce the risk of groin and pelvic injuries.
[email protected] 06 Aug 2018
FITNESS IN SOCCER
Strength training and functional training
379
REFERENCES
•
Balsom, P.D., Seger, J.Y, Sjödin, B. and Ekblom, B., 1992. Physiological Responses to Maximal Intensity Intermittent exercise. European
Journal of Applied Physiology, 65(2), pp.144-149
•
Bobbert, M.F., Gerritsen, K.G., Litjens, M.C. and Van Soest, A.J., 1996. Why is countermovement jump height greater than squat jump
height? Med. Sci. Sports Exerc., 28, pp.1402–1412.
•
Bobbert, M.F and Casius, R.L.J., 2005. Is the effect of a countermovement on jump height die to active state development? Med Sci Sports
Exerc., 37(3), pp.440–446.
•
Bosco, C., Ito, A., Komi, P.V., Luhtanen, P., Rahkila, P., Rusko, H. and Vitasalo, J.T., 1982. Neuromuscular function and mechanical effici-
ency of human leg extensor muscles during jumping exercises. Acta. Physiol. Scand., 114(4), pp.543–50.
•
Cavagna, G.A and Citterio, G.G., 1974. Effect of stretching on the elastic characteristics and the contractile components striated Muscle.
J. Physiol., 239, pp.1–14.
•
Cronin, J.B., McNair, P.J and Marshall, R.N., 2001. Magnitude and decay of Stretch-Induced enhancement of Power Output. Eur J Applied
Physiol., 84(6), pp.575–581.
•
Deane, R.S., Chow, J.W., Tillman, M.D. and Fournier, K.A., 2005. Effects of Hip flexor training on sprint, shuttle run, and vertical jump
performance. Journal of Strength & Conditioning Research, 19(3), pp.615–621.
•
Ebben, W.P., 2002. Complex Training: A Brief Review. Journal of Sports Sci and Medcine, 1, pp.42–46.
•
Flanagan, E.P. and Comyns, T.M., 2008. The Use of Contact Time and the Reactive Strength Index to Optimize fast Stretch-Shortening
Cycle Training. Strength & Conditioning Journal, 30(5), pp.32–38.
•
Haff, G.C., Hobbs, R.T., Haff, E.E., Sands. W.A., Pierce, K.C. and Stone, M.H., 2008. Cluster Training: A Novel Method for Introducing
Training Programme Variation. Strength & Conditioning Journal, 30(1), pp.67–76.
•
Hoff, J. Berdahl, G.O. and Braten, S., 2001. Jumping height development and body weight considerations in ski jumping. In: Muller, E.,
Schwameder, H., Raschner, C., Lindinger, S. and Kornexl, E., 2001. Science and Skiing. Hamburg: Verlag Dr Kovac. Pp.403–412.
•
Hoff, J., Gran, A. and Helgerud, J., 2002. Maximal Strength Training improves aerobic endurance performance. Scand j Med Sci Sports,
12, pp.288–295.
•
Hill, A.V., 1970. First and Last experiments in muscle mechanics. New York: Cambridge University Press.
•
McClymont, D., 2003. The use of the reactive strength index as an indicator of plyometric training conditions. In: Reilly, T., Cabri, J. and
Arau ́ jo, D., eds. Science and Football V: The Proceedings of the Fifth World Congress on Sports Science and Football. Lisbon, Portugal,
11–15 April. New York: Routledge; 2008. pp.408–416.
•
Moreau, N.G., Simpson, K.N., Teefey, S.A., Damiano, D.L., 2010. Muscle architecture predicts maximum strength and is related to activity
levels in cerebral palsy. Physical therapy, 90(11), pp.1619–30.
•
Myer, G.D., Ford, K.R., McLean, S.G. and Hewett, T.E., 2006. The Effects of Plyometric versus dynamic stabilization and balance training
on lower extremity biomechanics. American Journal of Sports Medicine, 34(3), pp.445–455.
•
Paavolainen, L., Hakkinen, K. Hamalanen, I., Nummela, A. and Rusko, H., 1999. Explosive strength training improves 5km running time
by improving running economy and muscle power. J Appl Physiol, 86(5), pp.1527–1533.
•
Potteiger, J.A., Lockwood, R.H., Haub, M.D., Dolezal, B.A., Alumzaini, K.S., Schroeder, J.M. and Zebas, C.J., 1999. Muscle power and fiber
characteristic following 8 weeks of plyometric training. Journal of strength and Conditioning Research, 13, pp.275–279.
•
Rimmer, E. and Sleivert, G., 2000. Effects of a plyometric intervention program on Sprint performance. Journal of Strength and Condi-
tioning Journal, 14(3), pp.295–301.
•
Spurrs, R.W., Murphy, A.J. and Watsford, M.L., 2003. The Effect of Plyometric training on distance running. Eur J Appl Physiol, 89(1),
pp.1–7.
•
Stone, M.H., Stone, M.E., Sands, W.A., Pierce, K.C., Newton, R.U., Haff, G.G. and Carlock, J., 2006. Maximum Strength and Strength
training – A relationship to endurance? Strength & Conditioning Journal, 28(3), pp.44–53.
•
Turner, A., Owings, M. and Schwane, J., 2003. Improvement in running economy after 6 weeks of plyometric training. Journal of Strength
and conditioning research, 17(1), pp.60–67.
•
Turner, A., 2009. The Science and practice of Periodization: A Brief Review. Strength & Conditioning Journal, 33(1), pp.34–46.
•
Wilson, G.J., Wood, G.A. and Elliott, B.C., 1991. Optimal stiffness of series elastic component in a stretch-shorten cycle activity. J Appl
Physiol, 70, pp.825–833.
•
Wisløff, U., Helgerud, J. and Hoff, J., 1998. Strength and Endurance of Elite Soccer Players. Medicine and Science in Sports and Exercise,
30(3), pp.462–467.
•
Wisløff, U., Castagna, C., Helgerud, J., Jones, R. and Hoff, J., 2004. Strong Correlation of Maximal Squat Strength with Sprint Performance
and Vertical Jump Height in Elite Soccer Players. British Journal of Sports Medicine, 38, pp.285–288.
•
Vossen, J.F., Kramer, J.F., Burke, D.G. and Vossen, D.P., 2000. Comparison of dynamic push-up training and plyometric push-up training
on upper-body power and strength. Journal of Strength and Conditioning Research, 14(3), pp.248–253.
[email protected] 06 Aug 2018
380
I FITNESS IN SOCCER
Strength training and functional training
[email protected] 06 Aug 2018
FITNESS IN SOCCER
Injury prevention
381
21
INJURY PREVENTION
Jan Van Winckel, Steven Probst, Balder Berckmans, Pieter Jacobs, Mathieu Gram
21.1 INTRODUCTION
Due to the specific physical demands of soccer, the incidence of injuries is signifi-
cantly higher than in other team sports such as field hockey, volleyball and basket-
ball. The risks of acute injury in professional soccer are threefold greater than in
the construction, manufacturing, and service sectors of industry (Drawer and Ful-
ler, 2002). Large-scale epidemiological studies indicate that the injury prevalence
rate in professional soccer is approximately 15%. This means that for a squad of 25
players, approximately four players will be unavailable at any given time due to
injuries. Hägglund (2007) reported that 65–95% of players had at least one injury
every year. In a recent study in European professional soccer, Ekstrand et al. (2011)
demonstrated that a team with a 25-player squad can expect 15 muscle injuries
every season, with muscle injuries accounting for more than a quarter of the total
layoff time.
Contact injuries are responsible for just over a half of all injuries, and these are often
linked to external factors and therefore not completely avoidable. Non-contact inju-
ries, however, can be largely avoided, and these are divided into acute non-contact
injuries and overload injuries. Muscle injuries, such as strains, are generally regar-
ded as the largest group of avoidable injuries. Extensive epidemiological studies by
Professor Ekstrand et al. (2011), conducted over a ten-year period with 51 different
professional clubs, have shown that muscle injuries account for 35% of the total
number of injuries. Up to 80% of these muscle injuries are non-contact injuries that
could be avoided to a large extent through individual injury-prevention programs
and workload management. This substantial number of muscle injuries is respon-
sible for more than 25% of the overall absence of players from match-play and
therefore has a major impact on the success of the team. This is especially signifi-
cant when considering that muscle injuries alone (in a squad of 25 players at pro-
fessional level) are responsible for 223 days of unavailability per season, including
37 match days and 148 training days. Injuries to the hamstring muscle group are
the most common injuries, accounting for 37% of all muscle injuries. The average
unavailability per muscle injury lasts 14 days before the player can return to squad
training.
[email protected] 06 Aug 2018
FITNESS IN SOCCER
Injury prevention
382
21.2 CONSEQUENCES OF INJURIES
Injuries and the associated unavailability of players have substantial consequences
for the players as well as the coach and the club. The development of youth players
and the careers of professional players can in some cases be severely interrupted.
In both cases, it can take a long period of rehabilitation before they are able to per-
form at the top level again. This means the coach cannot field his strongest team,
resulting in diminished performance. Poor match performances and results also
have economic consequences for the club. Injuries therefore have a greater impact
than just the players’ physical complaints. In 2003, for example, Scandinavian rese-
archers conducted a study of more than 300 players in Iceland’s two highest pro-
fessional soccer divisions (Arnason, 2003). The aim of the study was to examine
what part individual fitness and proneness to injury played in a team’s success. The
conclusion was that teams with fewer injuries finished the season in a significantly
higher place in the league than teams with more injuries. Similar to this, Hägglund
et al. (2013) reported that injuries have a significant influence on performance in
the league and European competitions in male professional soccer. The findings
stress the importance of injury prevention strategies to increase a team’s chances
of success.
In economic terms, the main effect of a large number of injuries is the high cost
incurred by the club. The medical costs related to injuries are substantial. Recent
research demonstrated that these costs can be reduced through injury-prevention
strategies (Verhagen, 2013). Moreover, clubs continue to pay salaries while injured
players (the club’s assets) cannot perform. Their market value also drops, resulting
in the transfer possibilities for such players falling as well. The greatest source of
income for most clubs comes from training and guiding players to a higher level,
with the result that they can be sold to other clubs for substantial amounts of
money. Given the average wages of players in Europe (e.g., €150,000 per annum in
Belgium, €250,000 in the Netherlands and €350,000 in England), the average pay for
players in the USA ($150,000 per year in MLS), and the high incidence of injuries,
it is obvious that even a 5% reduction in the number of injuries would have a huge
financial benefit. A recent study showed that 2% of all professional players in the
Premier League ended their careers because of injury (Windsor insurance, 1997).
This is in stark contrast to another study in which the researchers asked players
why they had stopped playing soccer. Of those questioned, 50% said they had been
forced to end their careers prematurely because of injury (Drawer and Fuller, 2011).
21.3 CONCEPTUAL MODEL: INJURY PREVENTION
Injury prevention is an organized strategy in which all sections of the club have to
work closely together. In 1992, van Mechelen and co-workers argued that measures
to prevent sports injuries do not stand alone. They presented a model of preven-
tion based on the surveillance of injury, identification of risk factors, and imple-
mentation of prevention strategies. Two years later in 1994, Meeuwisse put forth a
multifactorial model of causation. This model attempted to account for the inter-
action of multiple risk factors, both intrinsic (internal) and extrinsic (external). It
shows clearly the importance of identifying intrinsic predisposing factors, as well
as recognizing those extrinsic factors that interact to make an athlete susceptible to
injury, before an injury-inciting event occurs (Figure 21.1).
[email protected] 06 Aug 2018
FITNESS IN SOCCER
Injury prevention
383
Fig. 21.1: Four-step sequence of injury-prevention research (Meeuwisse et al., 1992).
In 2005, Bahr and Krosshaug designed a conceptual model that elaborated on the
characteristics of the inciting event as a component of the causal pathway. This
model suggests that an injury is the result of a complex interaction between intrin-
sic and extrinsic risk factors rather than being exclusively caused by the injury
mechanism that is generally associated with the onset of injury. Each player has
their own particular set of intrinsic factors or risks. Intrinsic risk factors can be
further subdivided into modifiable or non-modifiable factors. Modifiable risk fac-
tors can potentially be altered to reduce injury rates through the implementation of
injury-prevention strategies (Meeuwisse, 1991).
Intrinsic risk factors—such as physical fitness, technical level, muscle strength and
flexibility, and joint mobility—can be manipulated by targeted training and physio-
therapy sessions. If intrinsic strength improves, the player may be less predisposed
to injury. The combination of these individually determined intrinsic risk factors
gives the player a certain predisposition to injury. This predisposed player is then
exposed to extrinsic risk factors, making him even more susceptible to injury.
Examples of extrinsic risk factors include weather conditions and the playing sur-
face. For example, a field in poor condition can have a negative influence on the
player’s intrinsic predisposition, and this makes him more susceptible to injury. A
good soccer field, ideal weather conditions, and a referee who has the match under
control all have favorable influences on the player’s predisposition. Although these
extrinsic risk factors are outside our professional domain, they do need to be inclu-
ded in order to draw up an accurate profile for each player.
[email protected] 06 Aug 2018
FITNESS IN SOCCER
Injury prevention
384
Although high-risk players are susceptible to injury, they may not have been inju-
red yet. It is the presence of both intrinsic and extrinsic risk factors that renders a
player susceptible to injury. The simple presence of these risk factors is, however,
insufficient to produce injury. The sum of these risk factors and the interaction bet-
ween them ‘‘prepares’’ the athlete for an injury to occur in a given situation (Bahr
and Krosshaug, 2005). The final link in the chain that actually causes the injury is
the inciting event (Meeuwisse, 1992).
Fig. 21.2: Injury mechanism (adapted form Bahr and Krosshaug, 2005).
This final link will tell us, within the conceptual model, something about “the
moment” when a player will sustain an injury. It is only when a player is actually
on the pitch taking part in a training session or match that he can sustain an injury.
A very injury-prone (susceptible) player can undergo a training session perfectly
well with a good warm up, good training conditions, and a specially adapted trai-
ning load.
An injury is therefore effectively sustained by the interaction between intrinsic
and extrinsic risk factors during the “inciting event.” This can also be altered by
applying particular periodization, adapting the training load, or manipulating
other underlying mechanisms. Excessively heavy workouts or excessively short
intervals between training sessions can be factors in provoking an injury. Each
player has, figuratively speaking, his own “Achilles heel,” a certain area of the
body that is more susceptible to injury. For one player, it might be his right knee, for
another, it might be his left hamstring. The vast majority of injuries are sustained
in the area of this figurative “Achilles heel” when the load imposed by the coach is
higher than the player’s load tolerance.
[email protected] 06 Aug 2018
FITNESS IN SOCCER
Injury prevention
385
21.4 INTRINSIC RISK FACTORS
Intrinsic risk factors can be subdivided into modifiable and non-modifiable factors.
21.4.1 Non-modifiable factors
Despite that these factors cannot be altered, coaches have to take them into account
in order to avoid injuries and develop individual programs. This differentiation is
referred to as individual periodization.
21.4.1.1 Age
The chronological age of peak performance varies between sports and depends
on the player’s attained technical skill, developed power, endurance capacity, and
experience. The majority of players are at their most successful after they have rea-
ched athletic maturation. Athletes participating in rugby, soccer, volleyball, speed
skating, distance running, and cross-country skiing achieve success in their late
twenties or early thirties (Bompa, 1999).
Adolescents are more injury prone
than children. Injury rates increase
with age through a diverse range
of sports (Yde and Nielsen, 1990;
Emery, 2003).
The research supports age as a
significant risk factor for injury
(Freckleton and Pizzari, 2013).
Several studies have shown clearly
that older players are more prone
to muscle injury, particularly to the hamstrings (Verrall et al., 2011; Henderson et
al., 2010; Freckleton and Pizzari, 2013). Hägglund et al. (2013) demonstrated that
older players (above mean age) had an almost twofold increase in the rate of calf
injury, but the researchers didn’t find any association in other muscle groups.
The reason why older players are more susceptible to muscle injury is unclear,
but it has been suggested that age-related changes in older athletes, such as incre-
ased body weight and a loss of flexibility, may partially explain the increased risk
(Gabbe et al., 2006). In another interesting study by Orchard et al. (2002), increasing
age and sporting experience were identified as intrinsic risk factors for groin injury.
These results could be partially explained by the fact that the body’s collagen tissue
changes in nature with progressing age, so it may not be as able to respond to rapid
changes of directions or recover from fatigue (Mays et al., 1991; Wang et al., 2003).
Moreover, it has been demonstrated that peak hip adductor and abductor torques
significantly decrease with advancing age (Johnson et al., 2004).
In a meta-analysis conducted by Fousekis et al. (2013), a trend where younger play-
ers were at greater risk of ankle sprain was also apparent to the limit of statistical
significance (.05 < P < .10). This was confirmed in a study by McKay et al. (2001) in
basketball players. They reported that younger athletes were at an increased risk of
sustaining ankle injuries when compared with older athletes.
[email protected] 06 Aug 2018
FITNESS IN SOCCER
Injury prevention
386
21.4.1.2 Gender
It is well documented that female athletes sustain significantly more knee injuries
than male athletes, specifically anterior cruciate ligament (ACL) sprains. Female
athletes are three times more likely to incur ACL ruptures (Sutton and Bullock,
2012). In a study of ACL injuries in elite Norwegian handball players, Myklebust et
al. (2000) found that women had a fivefold increased risk of sustaining ACL injuries
when compared with men. This may be due to female athletes having, genetically
speaking, less strength and the knee often being too flexible (hyperlaxity). Addi-
tionally, many explanations have been suggested in the literature for why female
athletes incur more serious knee injuries than male athletes, including anatomical,
hormonal, and neuromuscular factors (Hewitt, 2000). Unique anatomical features
of female athletes, such as a larger quadriceps angle (i.e., the Q angle or the angle
at which the femur meets the tibia), could possibly cause a larger relative inward
rotation of the knee and a greater pull on the knee muscles during physical activity,
therefore contributing to more ACL injuries among females.
21.4.1.3 Height
Meta-analysis suggested that height did not differ between groups of injured and
uninjured players (Freckleton and Pizzari, 2013).
21.4.1.4 Ethnicity
Woods et al. (2004) found an association with a significantly increased risk in play-
ers of black origin.
21.4.1.5 Anatomical characteristics
Anatomical characteristics, such as increased foot width, have been linked with an
increased risk of ankle sprains (Barker et al. 1997; Baumhauer et al., 1995).
[email protected] 06 Aug 2018
FITNESS IN SOCCER
Injury prevention
387
21.4.2 Modifiable factors
21.4.2.1 Body fat percentage (overweight)
Being overweight causes the body to waste a great deal of energy on inefficient
movement. A body fat percentage under 10% is recommended for a soccer player.
An increase in fat percentage produces an exponential increase in the mechanical
load, forces that articular, ligamentous, and muscular structures must resist. Care
should be taken when determining body fat percentages via skinfold measure-
ments, because these involve a margin of error. Skinfold measurements are, howe-
ver, very useful in practice for measuring a player’s development over time. These
measurements are quick and practical, making them very useful for large numbers
of players. Current trends in body composition research include compartmental
assessment using dual-energy x-ray absorptiometry (DEXA). The advantage of
DEXA over other laboratory methods is the ability to assess regional, in addition to
total body, composition and analyze separate compartments of the body (i.e., fat,
soft tissue and bone) (Wagner, 1999).
21.4.2.2 Weight
Freckleton and Pizzari (2013) included seven studies in their meta-analysis. They
did not demonstrate a difference in weight between the injured and uninjured
groups, although there was a trend toward heavier athletes being more susceptible
to hamstring injury. Fousekis et al. (2013) found that players with increased body
weight had a significantly higher risk of non-contact ankle sprains.
21.4.2.3 Joint position sense
Joint position sense has been identified as an intrinsic risk factor for ankle sprains
in numerous publications (Willems et al., 2005; de Noronha et al., 2006; Tropp et al.,
1984). Tropp et al. (2006) investigated postural equilibrium through stabilometry in
soccer players. They demonstrated that in players with a history of previous ankle
joint injury, no increased postural sway was found. On the other hand, players sho-
wing abnormal stabilometric values ran a significantly higher risk of sustaining an
ankle injury during the following season when compared to players with normal
values. Trojian and McKeag (2006) investigated the ability of the single-leg balance
(SLB) test, carried out during preseason examinations, to predict an ankle sprain
during the autumn sports season. The researchers found a significant association
between a positive SLB test and future ankle sprains.
21.4.2.4 Hamstring to opposite hamstring ratio (H:H )
opp
The risk of sustaining a hamstring strain-type injury was shown to increase with a
lowered hamstring to opposite hamstring concentric ratio at 60°/s in an Australian
football population (Orchard et al., 1997).
21.4.2.5 MRI (magnetic resonance imaging) data
Research carried out by Verrall et al. (2001) assessed hamstring muscle injuries
(strains) with MRI to identify risk factors for reinjury. Athletes from three professi-
onal Australian Rules football teams with an injury volume greater than 21.8 cm3
were 2.3 times more likely to be reinjured. Furthermore, an MRI-measured injury
[email protected] 06 Aug 2018
FITNESS IN SOCCER
Injury prevention
388
transverse size greater than 55% indicated athletes were 2.2 times more likely to be
reinjured.
21.4.2.6 Preseason fitness
Players failing to maintain their fitness during the off-season, and therefore starting
the preseason in poor physical fitness, are more prone to injury during preseason.
These players train with other fitter players and consequently suffer from accumu-
lation of fatigue more quickly. These injuries then put them even further behind the
other players, leading to a vicious cycle. Leetun et al. (2004) found that decreased
levels of preseason sport-specific training (i.e., less than 18 sessions during presea-
son) were risk factors for groin strain injury.
21.4.2.7 Flexibility
Intuition tells us there is a relationship between increased flexibility and decreased
incidence of injury in soccer.
✓ Ankle and knee joint laxity
The association between ankle laxity and ankle injury is unclear. Several studies,
however, have shown a relation between knee laxity and knee injury. Ramesh et al.
(2005) found that anterior cruciate ligament injury is more common in those with
joint laxity, particularly those with hyperextension of the knee. Myer et al. (2008)
confirmed these findings when they found that a positive measure of knee hyper-
extension increased fivefold the odds of anterior cruciate ligament injury in female
athletes.
✓ Muscle tightness
Poor flexibility has been identified as an intrinsic risk factor for lower extremity
muscle injury (Ibrahim et al., 2007; Bradley et al., 2007; Witvrouw et al., 2003).
A meta-analysis by Freckleton and Pizzato (2013) did not find a significant rela-
tionship between AKE (active knee extension) test results and hamstring injury,
although the relationship was approaching significance. The PKE (passive knee
extension) test was not related to hamstring injuries. Watsford et al. (2010) demon-
strated that mean hamstring musculotendinous stiffness and mean leg stiffness
were greater in AFL players who subsequently incurred a hamstring muscle strain-
type injury.
✓ Range of motion (ROM)
Reduced hip extension ROM (or reduced hip flexor length) is associated with ham-
string injury (Gabbe et al., 2006a,). This research showed that for each 1 degree
increase on the modified Thomas test (i.e., decreasing hip flexor flexibility), the
likelihood of hamstring muscle strain-type injury increased by 15% in players aged
25 or more.
Excessive mobility in the joints—such as the ankle, knee and hip—can give rise
to an excessive range of movement in the joint, possibly causing injury. Limited
mobility (e.g., in the hip or ankle joint) can also increase a player’s susceptibility
to injury (Fong et al., 2011). Due to the asymmetric load in soccer, the mobility of
the joints can be limited by muscle tension on one particular side of the body. This
[email protected] 06 Aug 2018
FITNESS IN SOCCER
Injury prevention
389
affects the quality of movement, resulting in a need for other structures to com-
pensate. This can in return result in overload and injury. Similar to this, Fong et al.
(2011) found that dorsiflexion ROM restrictions may be associated with a greater
risk of ACL injury.
21.4.2.8 Previous injury
One of the most cited intrinsic risk factors for lower extremity muscle injury in soc-
cer is a previous injury (Hägglund et al., 2006; Engebretsen et al., 2010). Players who
experienced a muscle injury in the previous season had increased injury rates of up
to three times when compared with previously uninjured players (Hägglund et al.,
2013). Bennell et al. (1998) also found that Australian soccer players with a previ-
ous history of hamstring muscle strain-type injuries were 2.1 times more likely to
sustain another hamstring injury. Hägglund and colleagues demonstrated in 2013
that hamstring injury was associated with past calf injury, calf injury with past
quadriceps injury, and quadriceps injury with past hamstring injury. The author
suggested that altered running biomechanics caused by the first injury might be an
influencing factor. Previous injury has also been related to ankle sprains (Kofotolis
et al., 2007) and groin injury (Arnason et al., 2004).
An increased risk of incurring the same type of injury in subjects with a history
of injury can be due to several reasons. These include inadequate rehabilitation,
muscle strength impairment, muscle imbalance, diminished muscle flexibility, the
presence of scar tissue, and functional instability (Engstrom, 1998). Several studies
identified a premature return to play as an injury risk factor. Ekstrand and Gillquis
(1983) found that players who were inadequately rehabilitated, or who returned
prematurely to a pre-injury level of competition, were at increased risk of suffering
an identical injury. Finally, a previous injury is a good predictor for identifying a
weak zone. The fact that a player frequently sustains an injury in the same zone
shows that the zone in question could be a weak link. Extensive screening can
expose the various risk factors.
21.4.2.9 H:Q ratio
In general, the evidence for the isokinetic H:Q ratio being an intrinsic risk factor for
hamstring muscle strain-type injuries is scarce and unclear. Although the H:Q ratio
has been identified as a risk factor, the speeds (60, 90, 180 degree/sec) at which sig-
nificance levels are found are contradictory. Bennell et al. (1998) found H:Q ratios
could not predict hamstring muscle strain-type injuries, despite measuring ratios at
varying speeds. In conflict to these findings, Yeung et al. (2009) demonstrated that
the likelihood of hamstring muscle strain-type injuries increased with a decrease
in the concentric H:Q ratio at 180 degree/sec. A ratio of less than 0.6 was found
to increase injury risk by 17 times. In another interesting study by Croisier et al.
(2008), an imbalance profile (a player who has a deficit on two or more isokinetic
tests) was an effective method of identifying injury-prone players.
[email protected] 06 Aug 2018
FITNESS IN SOCCER
Injury prevention
390
21.4.2.10 Quadriceps and hamstring peak torque
A meta-analysis (Freckleton et al., 2013) demonstrated that an increase in quadri-
ceps peak torque is an intrinsic risk factor for hamstring muscle strain-type inju-
ries. On the other hand, the study did not support hamstring peak torque as a risk
factor for hamstring muscle strain-type injuries. Bennell et al. (1998) also studied
eccentric hamstring peak torque, but they did not find any significant difference
between groups.
21.4.2.11 Eccentric strength
Engebretsen et al. (2010) found that a simple eccentric strength test was unrelated
to an increased risk of hamstring muscle strain-type injuries.
21.4.2.12 Body mass index
The body mass index (BMI), or Quetelet index, is a measure for human body shape
based on an individual’s mass and height. It is defined as the individual’s body
mass divided by the square of the individual’s height, with the value being univer-
sally given in units of kg/m2.
mass (kg)
BMI =
(height (m))2
Gabbe et al. (2006) showed that a BMI of more than 25 was associated with ham-
string muscle strain-type injuries. BMI is inaccurate as a measure of body compo-
sition in soccer. For example, tall and muscular players may score high BMI levels,
incorrectly rating them as being too fat. For example, a player with a BMI of 26
may have a body fat percentage of just 8%. This player then has a very high muscle
mass, so a high BMI is not necessarily a problem. However, a high BMI does give
rise to a greater mechanical load on the joints. A change of direction can cause a
load equal to five times the body weight.
Fousekis et al. (2013) found that players with higher BMIs had a significantly higher
risk of non-contact ankle sprain. This might be because the ankle joint absorbs the
mechanical loads produced through the constant interaction of the player with the
ground and their opponents (Ekstrand and Tropp, 1990). This could make the joint
susceptible to injuries. Similarly, Tyler et al. (2006) identified increased weight and
BMI as intrinsic risk factors for ankle sprains. Players with a high BMI might also
have shorter playing careers than those with a lower BMI due to the mechanical load
accumulated during their careers, which can lead to chronic injuries such as oste-
oarthritis. Even after their careers end, these players often have to contend with the
consequences of years of high mechanical loads.
21.4.2.13 Functional asymmetry
A difference between the left and right side of the body is an indication of asymme-
try. This is often sport-specific because of a one-sided load, or it may be the result
of an incomplete rehabilitation or a persisting injury. A difference of more than
10-15% represents an increased risk. Correction of muscle imbalances at preseason
has been found to decrease the likelihood of hamstring injury in soccer players
(Croisier et al., 2008).
[email protected] 06 Aug 2018
FITNESS IN SOCCER
Injury prevention
391
21.4.2.14 Limb dominance
In soccer, the dominant kicking leg may be at increased risk of injury because it is
preferentially used for kicking. Quadriceps and groin injuries were more frequent
in the dominant leg, probably because of a greater volume of shooting and pas-
sing/crossing actions by the dominant leg, resulting in injury (Hägglund et al.,
2013). Moreover, limb dominance may result in lingering muscle imbalances in soc-
cer players. This could lead to an increased likelihood of injury, and unbalanced
strength between the dominant and non-dominant legs has been found in soccer
players (Rahnama et al., 2005). Ekstrand and Gillquist (1983) found that the domi-
nant leg sustained significantly more ankle injuries (92.3%) than the non-dominant
leg in male soccer players. This was also reflected in a study of Barker et al. (1997)
that found limb dominance to be a risk factor for ankle sprains. No significant dif-
ferences were detected in the number of hamstring injuries between the dominant
and non-dominant legs in various publications (Verrall et al., 2006; Henderson et
al., 2010).
21.4.2.15 Fatigue
Fatigue has been identified in the literature as a component in the occurrence of
muscle injury (Worrell, 1994; Garrett, 1996), especially since muscle injuries occur
more frequently toward the end of matches (Hawkins et al., 1993).
21.4.2.16 Aerobic fitness
Chomiak et al. (2000) clearly showed that diminished physical fitness is a risk fac-
tor for all injuries in a group of male soccer players. Poor aerobic fitness can induce
fatigue, leading to a reduction in the protective effects of the musculature on joints.
21.4.2.17 Psychological factors
Ivarsson and Johnson (2010) examined psychological factors as predictors of injury.
The researchers found that increased injury risk among junior soccer players was
predicted by ineffective coping skills, such as worry. Other ineffective coping skills
shown in the literature are self-blame, behavioral disengagement and denial (Ans-
hel and Sutarso, 2007; Lane et al., 2004).
Smith et al. (1993) identified a number of physical and psychosocial variables as
predictors of injury: level of participation, type of sport, age, previous injury, pre-in-
jury stress, mood state scales, and self-esteem. Moreover, they found significant
post-injury increases for depression and anger, whereas vigor was significantly less
after injury (Smith et al., 1993). Williams and Andersen (1998) have proposed inter-
ventions for reducing injury risk. They suggest an athlete can decrease the risk
of injury by lessening his susceptibility to the effects of different stressors. Recent
research by Ivarsson et al. (2013) demonstrated that injury occurrence was signifi-
cantly associated with both the initial level of daily hassle and the change in daily
hassle.
[email protected] 06 Aug 2018
FITNESS IN SOCCER
Injury prevention
392
21.4.3 Injury prevention and intrinsic risk factors
There are two ways of reducing the effects of intrinsic risk factors. The first approach
entails measuring these risk factors and setting up a specific program to eliminate
deficits or maladaptations. It does need to be considered that working on one iso-
lated risk factor is often not sufficient to avoid injury. Injuries occur through the
interaction between different risk factors. Working in an isolated way is therefore
less efficient than eliminating the deficiencies and imbalances through functional
exercise therapy that targets more than a local area or one single risk factor.
Another method at a lower level, which is particularly feasible for youth players,
is a general program based on the specific demands of the sport and the typical
maladaptation caused by playing soccer. Maladaptation is an adjustment of the
body caused by one-sided training. The advantage of this is that players can be
given a general program, thus freeing up time to work with the most injury-prone
players on an individual basis. An example of maladaptation in soccer players is
the relatively weak knee flexors (hamstrings) as opposed to the knee extensors
(quadriceps).
A good initiative in this context was introduced by FIFA under the FIFA 11 and
FIFA 11+. The intention was to offer 11 simple exercises (10 + fair play) to clubs
of all levels and players of all ages. This enables players to work on stability, pro-
prioception, core stability, eccentric hamstring strength, and so on. These exercises
are easy to do and require little equipment. Nevertheless, it has evidently proved
difficult to implement these exercises in practice. In this regard, the FIFA 11+ antici-
pated offering a standardized warm up incorporating all these exercises in a dyna-
mic manner. This means that all coaches can plan this into their training or match
warming up on a regular basis without negatively affecting training with the ball.
At the top international level, injury-prevention programs are, of course, set up on
the basis of individual player profiles. Based on thorough screening at the start of
the season, the individual injury-prone zones are set out together with the most
important intrinsic risk factors. After a certain time, the screening is repeated, so
it can be objectively evaluated whether a player has improved or not in relation to
particular physical parameters.
[email protected] 06 Aug 2018
FITNESS IN SOCCER
Injury prevention
393
21.4.4 Screening: Injury-prevention strategy
The importance of preventing injuries in sports is evident when considering the
disabling consequences, personal grief and high financial cost caused by these inju-
ries (Dallinga et al., 2012). Ultimately, a screening is set up to identify the risk of
injury within an athlete. In order to reduce this risk by means of correcting the
weak link, individualized injury-prevention strategies are mandatory. Thinking
outside the box, and thus beyond the local injury level, is imperative when for-
mulating an adequate injury-prevention program. This principle is supported by
various findings, such as the empirical findings of Dr. Müller-Wohlfahrt, the club
doctor at Bayern Munich, which showed the implication of the spine in 90% of
muscular problems (Vazel, 2013). The importance of assessing beyond the local
injury level is also in accordance with other research (Panayi et al., 2009; Fox et al.,
2006; Hoskins et al., 2005; Woods et al., 2004).
Ekstrand et al. (2011) found four major muscle groups to account for more than 90%
of all injuries in soccer, among which the hamstring muscle was the most affected.
Taking this into consideration, an appreciation of neuromuscular connections, as
well as an overall lumbar-pelvic structural assessment, is recommended as part
of the screening to help resolve chronic hamstring problems (Panayi et al., 2009;
Woods et al., 2004). A possible clarification is the significant role the biomechanics
of the sacroiliac joint and hip, along with lumbar-pelvic stability and alignment,
play in hamstring function and thus the injury mechanism (Hoskins et al., 2005;
Woods et al., 2004). Many other aspects can be assessed, providing significant inju-
ry-prevention information (Dallinga et al., 2012). The selection of tests, however,
will depend on multiple variables, such as the specific sports epidemiology, time,
and means at hand.
In order to implement a successful screening protocol, a frequent and equally timed
set of tests should be performed. These should ideally be rated by the same person
to enhance intra-rater and inter-rater reliability respectively. A frequent testing pro-
gram enables a baseline to be established. As such, new values can be compared
with the purpose of deciding whether an athlete is at risk of injury and requires an
additional individualized injury-prevention program.
21.5 EXTRINSIC RISK FACTORS
21.5.1 Away games
Hägglund et al. (2013) demonstrated that match play on away grounds was asso-
ciated with reduced rates of adductor and hamstring injuries.
21.5.2 Effect of changes in the score
Ryynänen et al. (2013) examined the effect of changes in the score on injury inci-
dence during the 2002, 2006 and 2010 FIFA World Cups. The researchers found an
extensive variation in incidence of injury related to changes in the score during mat-
ches of international men’s soccer. Injury incidence was lowest (54.8/1000 match-
hours [mh]) during the initial 0–0 score and highest (81.2/1000 mh) when the score
was even but goals had been scored. Players in a winning team run a higher risk of
suffering an injury than players in a drawing or losing team.
[email protected] 06 Aug 2018
FITNESS IN SOCCER
Injury prevention
394
21.5.3 Effect of PGDIs
Ryynänen et al. (2013) investigated the association between potentially game-dis-
rupting incidents (PGDIs)—such as red and yellow cards, goals, and injuries—and
the injury incidence in soccer during three FIFA World Cups in 2002, 2006 and 2010.
Official match statistics were obtained for all the matches played in the three tour-
naments. They concluded that the injury incidence was significantly higher during
match periods within a minute of, or during a five-minute period following, a yel-
low or red card, another injury, or a goal (PGDIs) than during other match periods.
21.5.4 Synthetic grass and floor surface
Some research into the impact of synthetic grass has been funded by its manu-
facturers. Additionally, the results in current literature are contradictory. For these
reasons, it is difficult to evaluate the effects of synthetic grass. What is certain,
however, is that the first and second generations of synthetic grass involved a gre-
ater risk of injury because of the lack of shock absorption and the larger impact on
joints caused by greater surface stiffness. Zanetti et al. (2013) found that in slalom,
artificial grounds produced higher horizontal peak accelerations compared to
natural ground. Orchard et al. (2003) proposed playing on artificial turf as one of
the primary extrinsic risk factors of ankle sprains.
Nowadays, we see more and more synthetic grass pitches in youth academies.
Hughes et al. (2013) found only small differences in the ability to perform certain
movements when comparing artificial and natural surfaces, concluding that fati-
gue and physiological responses to soccer activity do not differ markedly between
surface type when using the high-quality pitches of the present study.
Nevertheless, players must always take care when they switch from one surface to
another. The stiffness of a surface affects impact forces, and this may result in over-
load to the joints and tendons. Friction is necessary, however, for rapid starting,
accelerating, stopping, cutting, and pivoting, all of which are inherent to soccer.
This mechanical overload could affect injury incidence. A change of surface creates
a different load, and this change in load can partially be responsible for the discom-
fort experienced among players. Consider this at the start of the season, when the
pitches are hard, or during rainy or snowy weather. All of these circumstances and
conditions create a different load. Players often indicate after training sessions or
matches on synthetic pitches that they have problems in the area of the adductors,
calves and hamstrings. As always, the body must be given time to adapt to a diffe-
rent type of load. Given the friction that occurs between the shoes and the surface,
as well as the fact that synthetic grass allows fewer rotations, the knee joint and
ankle are more susceptible to injury on synthetic grass. Wearing specially adapted
footwear for playing on synthetic grass can reduce this friction.
21.5.5 Weather conditions
A temperature of 14–18°C is ideal for playing soccer. If it is warmer, dehydration
can then give rise to muscle injuries. If it is colder, the muscles can cool down,
making them more susceptible to injury. Insufficient hydration or a lack of glyco-
gen affects performance. Only 2% dehydration, possibly caused by hot weather,
can give rise to a 20% decrement in performance.
[email protected] 06 Aug 2018
FITNESS IN SOCCER
Injury prevention
395
21.5.6 Injuries caused by opponents (foul play)
Ryynänen et al. (2013) compared the incidence and characteristics of foul play inju-
ries and non-foul injuries. They demonstrated that the number of injuries was asso-
ciated with the number of fouls in a match. The length of absence resulting from
foul play injuries was significantly shorter than that of non-foul injuries.
Two mechanisms leading to ankle sprains have been found that are thought to be
specific to soccer.
• Player-to-player contact with impact by an opponent on the medial aspect of
the leg, just before or at foot strike, resulting in a laterally directed force cau-
sing the player to land with the ankle in a vulnerable, inverted position.
• Forced plantar flexion where the injured player hits the opponent’s foot when
attempting to shoot or clear the ball (Andersen et al., 2004).
It is said that 18–31% of all match injuries stem from fouls during a match. Depen-
ding on the study, 76–100% of these injuries are caused by opponents.
Astrid Junge indicated in one of her studies that almost all players were prepared
to commit a professional foul if they felt it was necessary. The majority of them said
this was all part of the game.
21.5.7 Protective equipment
Shin guards are compulsory during matches. However, shin guards are not worn
in training sessions at all clubs. Nevertheless, this preventive measure can help
reduce the number of contact injuries (contusions).
21.5.8 Appropriate footwear
When changing shoe brand, type or size, the feet will need time to adapt. Traditio-
nally, the old shoes are replaced at the end of the season. Preseason is then started
with new shoes on hard ground and a higher number of training sessions. This
results in players with foot problems and injuries every year.
It is often suggested that the man-shoe-surface interaction is a major problem in
soccer injuries, but until now, there is little evidence that using different commer-
cially available soccer shoes can influence the risk of injury. In this regard, Gehring
et al. (2007) compared soccer shoes with round and bladed studs. No significant
differences in externally applied knee joint loads during a complex injury-related
movement were found. The significant increased activation of quadriceps femoris
with round studs during the critical weight acceptance can be associated with an
additional internal load on the anterior cruciate ligament. The researchers conclude
that there is no higher risk of suffering non-contact knee joint injuries with bladed
soccer shoes. Galbusera et al. (2013) found that studded and bladed cleats did not
significantly differ in their interaction with the playing surface.
21.5.9 Ankle bracing and taping
There is a general consensus in the literature that ankle taping or bracing decrea-
ses the likelihood of ankle injury (Sitler et al., 1994; Tropp et al., 1985). Engstrom
(1998) suggests that the use of ankle braces could possibly increase the kinesthe-
tic awareness of the ankle and increase support to the joint by limiting hind foot
motion, specifically inversion. In recent years, scientific authors have highlighted
the importance of combining proprioception and stability exercises together with
preventive taping or bracing.
[email protected] 06 Aug 2018
FITNESS IN SOCCER
Injury prevention
396
21.5.10 Preseason
Hägglund et al. (2013) reported that quadriceps injuries were more frequent during
preseason, whereas adductor, hamstring, and calf injury rates increased during the
competitive season. In a study by Stevenson et al. (2000), the incidence of injury
was related to the time of season. In a study of recreational sports (Australian foot-
ball, field hockey, basketball, and netball), the researchers found that injury inci-
dence to the lower extremity was highest in the first four weeks of the season.
There are two possible reasons for this. Firstly, preseason is typically the time when
physical fitness needs to be rebuilt. Therefore, the workload imposed during these
first few weeks is higher than during the season. Players with poor physical fitness
are especially susceptible to injury. Another cause of this increased incidence of
injuries is the detrained state of some players. Even with a normal load, these play-
ers will sustain injuries more easily. In the mid-season break (off-season), it is the-
refore important for players to maintain their aerobic fitness and avoid detraining.
On the other hand, it is important in preseason to measure aerobic fitness and then
optimize and adjust/individualize the training program accordingly.
21.5.11 End of the season
A series of interesting studies by Tim Gabbett have shown that it is easier to sustain
an injury in the second half of the season when compared with the same load at the
start of the season. It is not entirely clear why this occurs. It could be due to (neural)
fatigue or a lack of concentration after a long season.
21.5.12 Skill level
Numerous studies have investigated
the association between skill level and
the likelihood of injury. The results
are contradictory, however, and need
further investigation. Petterson et al.
(2000) studied the association bet-
ween skill level and injury in male soc-
cer players. They demonstrated that
young players with low skill levels had
twice the incidence of all injuries as a
group when compared to more skilled
players.
21.5.13 Position on the field
In soccer, goalkeepers sustain signi-
ficantly fewer injuries than outfield
players, but they are more prone to
upper-limb injuries, particularly shoul-
der injuries (Woods et al., 2004).
[email protected] 06 Aug 2018
FITNESS IN SOCCER
Injury prevention
397
21.6 GENERAL INJURY PREVENTION FOR SOCCER PLAYERS
Every soccer player has, at some time, been sidelined for a short or long period
because of injury. It is an intrinsic element of contact sports that players have to
miss matches because of injuries caused by tackles and other contact. The coach can
never completely avoid this situation. On the other hand, many non-contact and
avoidable injuries also occur. These injuries are caused when players with particu-
lar intrinsic risk factors are lined up in training sessions and/or matches. Firstly,
more attention has to be paid to the real cause of injuries, especially where recur-
ring injuries are concerned. In the chapter on functional training, it was mentioned
that the body works like a chain and that any difference in mobility between joints
or muscles has an influence elsewhere in the chain. For this reason, injury-preven-
tion programs may be general, but they first need to be adapted to the player in
question.
The second point that needs attention in the prevention of injuries is training in
the transition zones. These are also described in the chapter on functional strength
training. These are the zones where most of the muscle injuries occur. The muscles
are stretched to the maximum, with rapid transitions from eccentric to concentric
contractions. The more flexible and stronger the muscles are, the less chance there
is of trauma being caused during eccentric movements. Injury-prevention exercises
should be part of the daily training program, either incorporated into the warm up
for pitch training or during a specific session in the fitness room.
Injuries to four major muscle groups of the lower extremity—adductors, ham-
strings, quadriceps, and calf muscles—account for more than 90% of all muscle
injuries in professional soccer (Ekstrand et al., 2011). Hamstring and groin muscle
strain-type injuries are common in sports that involve sprinting, acceleration, dece-
leration, rapid changes in direction, and jumping (Drezner, 2003; Estwanik et al.,
1990; Orchard et al., 1997; Smodlaka, 1980). Hamstring injuries are also recorded as
the most common of all injuries, resulting in an average of four missed games per
injury (Hawkins et al., 2001). To establish prevention programs, it is important to
identify risk factors associated with the occurrence of injury, preferably using ana-
lysis accounting for the multifactorial causes of injury (Meeuwisse, 1994). We will
focus now on the most important injuries—namely hamstring, quadriceps, calf and
groin strains, and ankle sprains—since these injuries account for the majority of all
injuries in soccer.
21.6.1 Hamstrings
The hamstrings are a bi-articular muscle group, consisting of the semitendinosus,
semimembranosus and biceps femoris muscles. Classic anatomy teaches us that
the principal functions of the hamstrings are hip extension and knee flexion. In
soccer and for movement in general, they are primarily called on for restraining
hip flexion and knee extension, like in the swinging out phase when kicking and/
or sprinting, often from an extended position. Muscles cannot, relatively speaking,
produce much from an extended position. This is often the case in soccer, however,
resulting in muscles such as the hamstrings being susceptible to injury.
Depending on the type of activity, a trauma can occur in the area of the biceps
femoris (resulting from a cyclical exercise, such as a max sprint) or the semi-mem-
branosus muscle (resulting from strain or hyperextension, such as when kicking).
[email protected] 06 Aug 2018
FITNESS IN SOCCER
Injury prevention
398
The gluteus maximus is the most important muscle group for restraining hip
flexion and the primary extensor of the hip. These actions are used in numerous
movements in soccer, such as taking off to jump, a powerful change of direction,
and restraining a kicking movement. Because of their location and attachment,
these muscles are called on in virtually every movement as a stabilizer. Power-
ful, well-developed glutei are the basis for a strong athlete. If this muscle group is
weakened or does not respond to movement in time, other muscle groups—such
as the hamstrings, which are mobilizers—compensate for this, and this can lead to
overload and injury. It is therefore important to train both the gluteus group and
the hamstrings eccentrically (eventually in a lengthened position) and in synergy,
so they are better able to cope with this load.
21.6.2 Adductors
Hamstring and adductor problems are among the most common injuries in soc-
cer players. Adductor injuries often occur because of the load around the hip joint
being high during a match, such as when a player shoots for goal or changes direc-
tion at high speed, as well as when playing on slippery ground when the adductors
are constantly adjusting in order to find stability. The adductors are subjected to a
repetitive high load due to the asymmetric movements in soccer and the typical
kicking motion. Good core stability and correct strength ratios between the diffe-
rent muscles of the lower limbs and eccentric tendon training will reduce the risk
of injury.
21.6.3 Pelvic girdle
The pelvis is the central point of the body where a large number of muscles have
their origin or points of attachment. The pelvic girdle is involved in just about
every movement in soccer. A soccer player therefore sustains many injuries in this
region. The risk of injuries is reduced if the muscles are well developed in this
region. We often see injuries in soccer players in the form of pubalgia, overloading
of the adductors or hip flexors, or tendonitis of the abdominal muscles.
We also often see injuries in the area of the lower central abdominal muscles and/
or at the common attachment point for the adductors. These can be caused by an
imbalance between the upward and oblique strength of the abdominal muscles
(on the pubis) and the downward and lateral pulling force of the adductors (on
the pubis inferior). Pain in this region can also result from biomechanical or arti-
cular imbalances in the rest of the body, causing more stress to be exerted on this
region and making these muscles work harder than expected. Examples of this
include differences in leg length and differences in mobility between the right and
left ankle. The performing of extreme abductions can also lead to chronic microt-
rauma and cause pain.
The lateral (internal and external) abdominal muscles and the transversus abdo-
minis ensure stabilization of the torso when running, as well as helping to create
the strength needed for kicking, throw-ins and heading. They are therefore of great
importance. Isokinetic tests show that when compared with the back muscles, the
abdominal muscles are weaker (ratio of 70%) in most soccer players than the expec-
ted average (ratio of 75%).
In addition, it is not sufficient to train the abdominal muscles with concentric
movements, such as classic crunches. In fact, research has shown the integration of
[email protected] 06 Aug 2018
FITNESS IN SOCCER
Injury prevention
399
core exercises to elicit greater muscle activation of, among others, the abdominal
muscles than isolated exercises such as crunches (Gottschall et al., 2013). Flexion
of the hip when upright or moving is generated automatically by gravity, with
the body playing more of an active role in restraining this movement. Soccer play-
ers have to be stable when moving, and they have to be able to return to a stable
position after being thrown off balance. The core muscles and the pelvic region are
essential in this regard. Training these muscles with dynamic core stability exerci-
ses and unconscious movements will make the soccer player better in this regard.
Given the asymmetric characteristics of soccer, the rotation component is of huge
importance. This must therefore be anticipated.
Soccer players also need to frequently deal with overload injuries and hypertonia
of the hip flexors. It is once again important to know that these muscles are mainly
activated in order to produce concentric movements (e.g., when kicking the ball,
taking throw-ins, heading and running). The same principles also apply here: Train
as much as possible in an upright, dynamic and functional manner. In addition, it
is important to keep in mind that tightness of the posterior pelvic muscle chain is
possibly restraining the concentric movement of the hip flexors.
21.6.4 Joint sense
Cruciate ligament injuries with or without contact with an opponent are also res-
ponsible for a large portion of player unavailability. A major risk factor in this
regard is the instability of the knee that can be induced through proximal instabi-
lity or ankle instability. The mechanism behind most cruciate ligament injuries is
often the torsion or twisting of the knee when landing after a heading duel or when
changing direction.
Joint sense provides the soccer player with information about his own body, such
as where, and in what state, various parts of the body are. It also indicates fatigue or
alertness of the connective tissue, such as the muscles and ligaments. As previously
stated, the proprioceptors are called on constantly when a player is in motion. Any
form of training is proprioceptive training. Functional injury-prevention exercises
help to train the proprioceptors with regard to activating the necessary muscles
quickly and correctly in order to control a particular movement or return from an
unstable position. This trains unconscious reactions and increases body awareness.
All of the above helps to prevent injuries. Exercises can be made more challenging
and more difficult by, for example, working on unstable surfaces, closing the eyes,
or distracting a player by throwing him a ball.
Hübscher and Refshauge (2013) published a review on the effectiveness of neuro-
muscular training for the prevention of sports injuries in athletes. Their pooled
analyses revealed that multi-intervention exercises (comprising balance and agility
training, stretching, plyometrics, running exercises, cutting and landing technique,
and strength training) significantly reduced the relative risk of lower-limb injuries,
acute knee injuries, and ankle sprain injuries.
[email protected] 06 Aug 2018
FITNESS IN SOCCER
Injury prevention
400
21.7 INJURY-PREVENTION PROGRAMS
Targeted, efficient injury prevention involves finding a balance between a player’s
load tolerance and the load imposed on the player. Injuries can be reduced by incre-
asing a player’s load tolerance and individualizing the training load to the needs
of the player. The player’s load tolerance can be divided into general load tolerance
and local load tolerance. General load tolerance comprises a player’s general physi-
cal fitness, determined from a variety of physical abilities. Basic fitness also inclu-
des the quantity and quality of sleep, as well as other psychosocial factors, such as
stress, personal situation and fatigue. The general load tolerance can be increased
by influencing these factors.
Local load tolerance relates to specific zones of the body. This local load tolerance is
built up from the interaction between the different intrinsic risk factors per zone. It
is a fact that one isolated intrinsic risk factor can be compensated for by other fac-
tors that have an influence on that particular zone. Intrinsic risk factors and imba-
lances can be eliminated via targeted, individual injury-prevention programs. The
scientific literature includes (limited) evidence of preventive programs that have an
effect on intrinsic risk factors. The influence of most interventions is on ankle and
knee stability, as well as hamstring and adductor strength.
The second complementary way of avoiding injuries is to individualize and
manage the load imposed on players. This can be done by adapting the training
workload to the individual and applying recovery strategies between training ses-
sions and matches.
Workload should be individualized
within the periodization model. The
coach has to create fatigue to allow
the body to adapt to the higher trai-
ning load (overload). During the same
microcycle, the coach has to ensure the
players are given adequate recovery
in order to produce an optimum level
of performance. To achieve this, the
accumulated fatigue of the training
week has to be reduced by applying
the right recovery strategies. The reco-
very time is different for each player.
Some players recover from a training
stimulus quickly, while others recover
very slowly. Factors that influence this
recovery include age of the player, and
aerobic fitness status..
Fig. 21.3: A
player’s injury risk profile based
on an injury-prevention screening of the
intrinsic risk factors. Body zones at risk are
highlighted (Screenshot TopSportsLab).
[email protected] 06 Aug 2018
FITNESS IN SOCCER
Injury prevention
403
Fig. 21.4: An example of a preventive exercise targeting a bodyzone at risk (knee and upperleg muscles)(screenshot TopSportsLab).
F
IT
N
E
SS
IN
S
O
C
C
E
R
In
ju
ry
p
reve
n
tio
n
40
4
[email protected] 06 Aug 2018
[email protected] 06 Aug 2018
FITNESS IN SOCCER
Injury prevention
405
21.7.1 Effectiveness of injury-prevention programs
Laursen et al. (2013) investigated the effectiveness of exercise interventions to pre-
vent sporting injuries. Their meta-analysis analyzed 25 trials, including 26,610 par-
ticipants with 3,464 injuries. The study showed no beneficial effects of stretching,
whereas studies with multiple exposures, proprioception training, and strength
training showed a tendency toward an increasing effect. Strength training redu-
ced sports injuries to less than a third, and overuse injuries were almost halved.
They concluded that both acute injuries and overuse injuries could be reduced
through the use of injury-prevention programs. Their findings were also confirmed
by Owen et al. (2013), who examined the effectiveness of a structured injury-pre-
vention program on the number of muscle injuries and the total number of injuries
within elite professional soccer. The study was conducted over two consecutive
seasons, of which the first (2008-2009) was the intervention season and the second
(2009-2010) was the control season. The training program was performed twice
weekly for the entirety of the season (58 prevention sessions). Significantly fewer
muscle injuries were observed in this study during the intervention season. The
researchers concluded that a multicomponent injury-prevention training program
may be appropriate for reducing the number of muscle injuries during a season,
but it may not be adequate to reduce all other injuries.
SUMMARY
It is highly important for soccer players to partake in a scientifically sound inju-
ry-prevention program throughout every season of their careers. The medical
staff of clubs should routinely screen their players in order to identify possible
injury risks and to put in place individual programs to help reduce the occur-
rence of injury. Most importantly, the coach has to periodize training load cor-
rectly throughout the season, because too much, or even too little, training can
predispose the players to injury. Accumulated fatigue should be avoided at all
cost in order to reduce the occurrence of non-contact soft tissue and joint injuries.
REFERENCES
•
Amaral De Noronha, M., Borges Jr., N.G., 2004. Lateral ankle sprain: isokinetic test reliability and comparison between invertors and
evertors. Clin Biomech (Bristol, Avon), 19, pp.868–871.
•
Anshel, M.T. and Sutarso T., 2007, Relationships between sources of acute stress and coping style in competitive sport as a function of
gender. Psychology of Sport and Exercise, 8, pp.1-24.
•
Árnason, Á, Gudmundsson, Á., Dahl, H.A., Johannsson, E., 1996. Soccer injuries in Iceland. Scand J Med Sci Sports, 6(1), pp.40-5.
•
Arnason, A., Sigurdsson, S.B., Gudmundsson, A., Holme, I., Engebretsen, L. and Bahr, R. 2004. Risk factors for injuries in football. Am J
Sports Med, 32(1 supp.), pp.5S–16S.
•
Bahr, R. and Krosshaug, T. 2005. Understanding the injury mechanisms – a key component to prevent injuries in sport. Br J Sports Med,
39, pp.324–329.
•
Barker, H.B., Beynnon, B.D. and Renstrom, A.F.H., 1997. Ankle injury risk factors in sports. Sports Medicine, 23, pp.69-74.
•
Baumhauer, J.F., Alosa, D.M., Renström, P.A., Trevino, S. and Beynnon, B., 1995. A prospective study of ankle injury risk factors. Am J
Sports Med, 23, pp.564–570.
•
Bennell, K.L., Talbot, R., Wajswelner, H., Techovanich, W. and Kelly, D., 1998. Intra-rater and Inter-tester reliability of a weight bearing
lunge measure of ankle dorsiflexion. Australian Physiotherapy, 24(2), pp.211-217.
•
Bompa, T.O., 1999. Periodization: theory and methodology of training 4th ed. Champaign, IL: Human Kinetics.
•
Bradley, P.S., Olsen, P.D. and Portas, M.D., 2007. The effect of static, ballistic, and proprioceptive neuromuscular facilitation stretching on
vertical jump performance. J Strength Cond Res, 21, pp.223–226.
•
Chomiak, J., Junge, A., Peterson, L. and Dvorak, J., 2000. Severe injuries in football players. Influencing factors. Am J Sports Med,
28(suppl 5), pp.S58–68.
•
Croisier, J.L., Ganteaume, S., Binet, J., Genty, M., Ferret, J.M., 2008. Strength imbalances and prevention of hamstring injury in professio-
nal soccer players: a prospective study. Am. J. Sports Med., 36, pp.1469–1475.
[email protected] 06 Aug 2018
406
FITNESS IN SOCCER
Injury prevention
•
Dallinga, J.M., Benjaminse, A. and Lemmink, K., 2012. Which Screening Tools Can Predict Injury to the Lower Extremities in Team
Sports? A Systematic Review. Sports Med, 42(9), pp.791-815.
•
Drawer, S. and Fuller, C., 2002. Evaluating the level of injury in English professional football using a risk based assessment process. Br
J Sports Med., 36(6), pp.446–451.
•
Drezner, J.A., 2003. Practical management: hamstring muscle injuries. Clinical Journal of Sport Medicine, 13, pp.48–52.
•
Ekstrand, J. and Gillquist, J., 1983. The avoidability of soccer injuries. Int J Sports Med, 4, pp.124–8.
•
Ekstrand, J., Gillquist, J., Moller, M., Oberg, B. and Liljedahl, S.O., 1983. Incidence of soccer injuries and their relation to training and team
success. Am J Sports Med, 11(2), pp.63–7.
•
Ekstrand, J., Hagglund, M. and Walden, M., 2011. Epidemiology of muscle injuries in professional football (soccer). Am J Sports Med,
39(6), pp.1226-1232.
•
Emery, C. A., 2003. Risk factors for injury in child and adolescent sport: a systematic review of the literature. Clinical Journal of Sports
Medicine, 13, pp.256-268.
•
Engebretsen, A.H., Myklebust, G., Holme, I., Engebretsen, L. and Bahr R., 2010. Intrinsic risk factors for hamstring injuries among male
soccer players: a prospective cohort study. Am J Sports Med, 38, pp.1147–1153.
•
Engstrom, B.K. and Renstrom, P.A., 1998. How can injuries be prevented in the World Cup soccer athlete? Clin Sports Med, 17, pp.755–68.
•
Estwanik, J., Sloane, B. and Rosenberg, M., 1990. Causes of groin strain. Phys Sportsmed, 18, pp.55-60.
•
Fong, C.M., Blackburn, J.T., Norcross, M.F., McGrath, M. and Padua, D.A., 2011. Ankle dorsiflexion ROM and landing biomechanics.
Journal of Athletic training, 46(1), pp.5-10.
•
Fousekis, K., Tsepis, E. and Vagenas, G., 2012. Intrinsic risk factors of noncontact ankle sprains in soccer. A prospective study on 100
professional players. Am J Sports Med, 40, pp.1842–50.
•
Fox, M., 2006. Effect on hamstring flexibility of hamstring stretching compared to hamstring stretching and sacroiliac joint manipulation.
Clinical Chiropractic, 9, pp.21—32.
•
Freckleton, G. and Pizzari, T., 2013. Risk factors for hamstring muscle strain injury in sport: a systematic review and meta-analysis. Br J
Sports Med, 47(6), pp.351–358.
•
Gabbe, B.J., Bennell, K.L., Finch, C.F., Wajswelner, H. and Orchard, J.W., .2006. Predictors of hamstring injury at the elite level of Austra-
lian football. Scand J Sci Med Sport, 16, pp.7–13.
•
Gabbe, B.J., Finch, C.F., Wajswelner, H. and Bennell, K.L., 2004. Predictors of lower extremity injuries at the community level of Austra-
lian football. Clin J Sport Med, 14(2), pp.56-63.
•
Galbusera, F., Tornese, D.Z., Anasetti, F., Bersini, S., Volpi, P., La Barbera, L. and Villa T., 2013. Does soccer cleat design influence the
rotational interaction with the playing surface? Sports Biomechanics, 12(3), pp.293–301.
•
Garrett Jr., W.E., Rich, F.R., Nikolaou, P.K., Vogler III, J.B., 1989. Computed tomography of hamstring muscle strains. Med. Sci. Sports
Exerc. 21, 506–514.
•
Gehring, D., Rott, F., Stapelfeldt, B. and Gollhofer, A., 2007. Effect of soccer shoe cleats on knee joint loads. Int J Sports Med, 28(12),
pp.1030-4.
•
Gottschall, J.S., Mills, J. and Hastings, B., 2013. Integration core exercises elicit greater muscle activation than isolation exercises. J
Strength Cond Res, 27(3), pp.590-6.
•
Hägglund, M., Waldén, M. and Ekstrand, J., 2006. Previous injury as a risk factor for injury in elite football: A prospective study over two
consecutive seasons. Br J Sports Med, 40, pp.767-772.
•
Hägglund, M., Waldén, M. and Ekstrand, J., 2013. Risk factors for lower extremity muscle injury in professional soccer: the UEFA Injury
Study. Am J Sports Med., 41(2), pp.327-35.
•
Hawkins, R.D. and Fuller, C.W., 1996. Risk assessment in professional football: an examination of accidents and incidents in the 1994
World Cup finals. Br J Sport Med, 30, pp.165-170.
•
Hawkins, R.D. and Fuller, C.W., 1996.Risk assessment in professional football: an examination of accidents and incidents in the 1994
World Cup finals. Br J Sport Med, 30, pp.165-170.
•
Henderson, G., Barnes, C.A. and Portas, M.D., 2010. Factors associated with increased propensity for hamstring injury in English Premier
League soccer players. J Sci Med Sport, 13(4), pp.397–402.
•
Hewitt, T.E., 2000. Neuromuscular and hormonal factors associated with knee injuries in female athletes: strategies for intervention.
Sports Med, 29, pp.313–27.
•
Hoskins, W.T. and Pollard, H.P., 2005. Successful management of hamstring injuries in Australian Rules footballers: two case reports.
Chiropractic & Osteopathy, 13:4.
•
Hübscher, M. and Refshauge, K.M, 2013. Neuromuscular training strategies for preventing lower limb injuries: what’s new and what are
the practical implications of what we already know? Br J Sports Med, 47, pp.939-940.
•
Hughes, M.G., Birdsey, L., Meyers, R., Newcombe, D., Oliver, J.L., Smith, P.M., Stembridge, M., Stone, K. and Kerwin, D.G., 2013. Effects
of playing surface on physiological responses and performance variables in a controlled football simulation. J Sports Sci, 31(8), pp.878-86.
•
Ibrahim, A., Murrell, G.A. and Knapman, P. 2007. Adductor strain and hip range of movement in male professional soccer players. J
Orthop Surg, 15, pp.46-49.
•
Ivarsson, A., Johnson, U., Lindwall, M., Gustafsson, H. and Altemyr, M., 2013. Psychosocial stress as a predictor of injury in elite junior
soccer: A latent growth curve analysis. J Sci Med Sport, pii: S1440-2440(13)00473-8. doi: 10.1016/j.jsams.2013.10.242. [Epub ahead of print]
•
Johnson, F.B., Sinclair, D.A. and Guarente, L., 1999. Molecular biology of aging. Cell, 96, pp.291–302.
•
Junge, A., Chomiak, J. and Dvorak, J., 2000. Incidence of football injuries in youth players – Comparison of players from two European
regions. American Journal of Sports Medicine, 28(5), pp.S47-50.
•
Kofotolis N. and Kellis E., 2007. Ankle Sprain Injuries: A 2-Year Prospective Cohort Study in Female Greek Professional Basketball Play-
ers. Journal of athletic training, 42(3), pp.388-94.
•
Lane, A.M., Hall, R. and Lane, J., 2004. Self-efficacy and statistics performance among sport studies students. Teaching in Higher Edu-
cation, 9, pp.435-448.
•
Lauersen, J.B., Bertelsen, D.M. and Andersen, L.B., 2013. The effectiveness of exercise interventions to prevent sports injuries: a systema-
tic review and meta-analysis of randomised controlled trials. Br J Sports Med, [Epub ahead of print].
•
Leetun, D.T., Ireland, M.L., Willson, J.D., Ballantyne, B.T. and Davis IM., 2004. Core stability measures as risk factors for lower extremity
injury in athletes. Med Sci Sports Exerc, 36(6), pp.926-34.
•
McKay, G.D., Goldie, P.A., Payne, W.R. and Oakes, B., 2001. Ankle injuries in basketball: injury rate and risk factors. Br J Sports Med,
35, pp.103–8.
•
Meeuwisse, W., 1994. Assessing causation in sport injury: A multifactorial model. Clin J Sport Med., 4, pp.66–170.
•
Meeuwisse, W.H., 1991. Predictability of sports injuries: What is the epidemiological evidence? Sports Medicine, 12(1), pp.8-15.
•
Myer, G.D., Ford, K.R., Paterno, M.V., Nick, T.G. and Hewett, T.E., 2008. The effects of generalized joint laxity on risk of anterior cruciate
ligament injury in young female athletes. Am J Sports Med., 36(6), pp.1073-80.
•
Myklebust, G., Haehlum, S., Holm, I. and Bahr R., 1998. A prospective cohort study of anterior cruciate ligament injuries in elite Norwe-
gian team handball. Scand J Med Sci Sports, 8, pp.149–53.
•
Nielsen, A.B. and Yde, J., 1989. Epidemiology and traumatology of injuries in soccer. Am J Sports Med, 17, pp.803–7.
•
Orchard, J. and Seward, H., 2002. Epidemiology of injuries in the Australian Football League, seasons 1997-2000. British Journal of Sports
Medicine, 36(1), pp.39-44.
•
Orchard, J., Marsden, J., Lord, S. and Garlick, D., 1997. Preseason hamstring muscle weakness associated with hamstring muscle injury
in Australian soccer players. Am J Sports Med, 25, pp.81-5.
•
Owen, A.L., Wong del, P., Dellal, A., Paul, D.J., Orhant, E. and Collie, S., 2013. Effect of an injury prevention program on muscle injuries
in elite professional soccer. J Strength Cond Res, 27(12), pp.3275-85.
•
Panayi, S., 2010. The need for lumbar-pelvic assessment in the resolution of chronic hamstring strain. Journal of Body work & Movement
Therapies, 14, pp.294–298.
•
Peterson, L., Junge, A., Chomiak, J., Graf-Baumann, T. and Dvorak, J., 2000. Incidence of football injuries and complaints in different age
groups and skill-level groups. Am J Sports Med, 28(suppl 5), pp.S51–7.
[email protected] 06 Aug 2018
407
•
Peterson, L., Junge, A., Chomiak, J., Graf-Baumann, T. and Dvorak, J., 2000. Incidence of football injuries and complaints in different age
groups and skill-level groups. Am J Sports Med, 28(suppl 5), pp.S51–7.
•
Rahnama, N., Lees, A. and Bambaecichi, E., 2005. A comparison of muscle strength and flexibility between the dominant and non-domi-
nant leg in English soccer players. Ergonomics, 48(11–14), pp.1568–1575.
•
Ramesh, R., Von Arx, O., Azzopardi, T. and Schranz, P.J., 2005. The risk of anterior cruciate ligament rupture with generalised joint laxity.
J Bone Joint Surg Br., 87(6), pp.800-3.
•
Ryynänen, J., Dvorak, J., Peterson, L., Kautiainen, H., Karlsson, J., Junge, A. and Börjesson, M., 2013. Increased risk of injury following
red and yellow cards, injuries and goals in FIFA World Cups. Br J Sports Med, 47, pp.970-973.
•
Ryynänen, J., Junge, A., Dvorak, J., Peterson, L., Karlsson, J. and Börjesson, M., 2013. The effect of changes in the score on injury incidence
during three FIFA World Cups. Br J Sports Med, 47, pp.960-964.
•
Ryynänen, J., Junge, A., Dvorak, J., Peterson, L., Kautiainen, H., Karlsson, J. and Börjesson, M., 2013. Foul play is associated with injury
incidence: an epidemiological study of three FIFA World Cups (2002–2010). Br J Sports Med, 47, pp.986–991.
•
Sitler, M., Ryan, J., Wheeler, B., McBride, J., Arciero, R., Anderson, J., Horodyski, M., 1994. The efficacy of a semirigid ankle stabilizer to
reduce acute ankle injuries in basketball. A randomized clinical study at West Point. Am J Sports Med, 22, pp.454–61.
•
Smith, A.M., Stuart, M.J., Wiese-Bjornstal, D.M., Milliner, E.K., O’Fallon, W.M., Crowson, C.S., 1993. Competitive athletes: Pre- and
post-injury mood state and self-esteem. Mayo Clinic Proceedings, 68, pp.939–949.
•
Smodlaka, V., 1980. Groin pain in soccer players. Phys Sportsmed, 8, pp.57-61.
•
Soderman, K., Alfredson, H., Pietila, T., et al., 2001. Risk factors for leg injuries in female soccer players: a prospective investigation
during one out-door season. Knee Surg Sports Traumatol Arthrosc, 9, pp.313–21.
•
Stevenson, M.R., Hamer, P., Finch, C.F., Elliot, B. and Kresnow, M., 2000. Sport, age, and sex specific incidence of sports injuries in Wes-
tern Australia. Br J Sports Med, 34(3), pp.188–94.
•
Sutton, K.M. and Bullock, J.M., 2013. Anterior cruciate ligament rupture: differences between males and females. J Am Acad Orthop
Surg, 21(1), pp.41-50.
•
Thacker, S.B., Gilchrist, J., Stroup, D.F. and Dexter, K.C., 2004. The impact of stretching on sports injury risk: a systematic review of the
literature. Med Sci Sports Exerc, 36(3), pp.371-8.
•
Trojan, T.H. and McKeag, D.B., 2006. Single leg balance test to identify risk of ankle sprains. Br J Sports Med, 40, pp.610-614.
•
Tropp, H., Askling, C. and Gillquist J., 1985. Prevention of ankle sprains. Am J Sports Med, 13, pp.259–62.
•
Tropp, H., Ekstrand, J. and Gillquist, J., 1984. Stabilometry in functional instability of the ankle and its value in predicting injury. Med
Sci Sports Exerc, 16(1), pp.64–66.
•
Tyler, T.F., McHugh, M.P., Mirabella, M.R., Mullaney, M.J. and Nicholas, S.J., 2006. Risk factors for noncontact ankle sprains in high school
football players: the role of previous ankle sprains and body mass index. American Journal of Sports Medicine, 34, pp.471–5.
•
van Mechelen, W., Hlobil, H. and Kemper, H., 1992. Incidence, severity, etiology and prevention of sports injuries - a review of concepts.
Sports Medicine, 14, pp.82–99.
•
Verhagen, E.A., 2013. Costing an injury prevention program in amateur adult soccer. Clin J Sport Med, 23(6), pp.500-1.
•
Verrall, G.M., Slavotinek, J.P., Barnes P.G., Fon, G.T. and Esterman, A., 2006. Assessment of physical examination and magnetic resonance
imaging findings of hamstring injury as predictors for recurrent injury. J Orthop Sports Phys Ther, 36, pp.215-24.
•
Verrall, G.M., Slavotinek, J.P., Barnes, P.G., Fon, G. and Spriggins, A., 2001. Clinical risk factors for hamstring muscle strain injury: a pros-
pective study with correlation of injury by magnetic resonance imaging. Br J Sports Med, 35(6), pp.435–40.
•
Wagner, D.R. and Heyward, V.H., 1999. Techniques of body composition assessment: a review of laboratory and field methods. Res Q
Exerc Sport, 70(2), pp.135–49.
•
Wang, L., Huddleston, S. and Peng, L., 2003. Psychological skill use by Chinese swimmers. International Sports Journal, 7, pp.48-55.
•
Watsford, M.L., Murphy, A.J., McLachlan, K.A., Bryant, A.L., Cameron, M.L., Crossley, K.M. and Makdissi, M., 2010. A prospective study
ofthe relationship between lower body stiffness and hamstring injury in professional Australian rules footballers. American Journal of
Sports Medicine, 38, pp.2058–2064.
•
Willems, T.M., Witvrouw, E., Delbaere, K., Mahieu, N., De, B.I. and De, C.D., 2005. Intrinsic risk factors for inversion ankle sprains in male
subjects: a prospective study. Am J Sports Med, 33, pp.415–423.
•
Williams, J.M. and Andersen, M.B., 1998. Psychosocial antecedents of sport injury: Review and critique of the stress and injury model.
Journal of Applied Sport Psychology, 10, pp.5-25.
•
Windsor Insurance Brokers Limited, 1997. Investigation into career ending incidents to professional footballers in England and Wales,
from 1987/88 to 1994/95. London: Windsor Insurance,.
•
Witvrouw, E., Danneels, L., Asselman, P., D’have, T. and Cambier, D., 2003. Muscle flexibility as a risk factor for developing muscle inju-
ries in male professional soccer players: A prospective study. Am. J. Sports Med., 31(1), pp.41-46.
•
Woods, C., Hawkins, R.D., Maltby, S., Hulse, M., Thomas, A. and Hodson, A., 2004. The Football Association Medical Research Pro-
gramme: an audit of injuries in professional football – analysis of hamstring injuries. Br J Sports Med, 38(1), pp.36-41.
•
Worrell, T.W., 1994. Factors associated with hamstring injuries. An approach to treatment and preventative measures. Sports Med, 17,
pp.338-345.
•
Yde, J. and Nielsen, A.B., 1990. Sports injuries in adolescents’ ball games: soccer, handball, and basketball. British Journal of Sports
Medicine, 24, pp.51-54.
•
Yeung, S.S., Suen, A.M. and Yeung, E.W., 2009. A prospective cohort study of hamstring injuries in competitive sprinters: preseason mus-
cle imbalance as a possible risk factor. Br.J.Sports Med., 43, pp.589-94.
•
Zanetti, E.M., Bignardi, C., Franceschini, G. and Audenino, A.L., 2013. Amateur football pitches: mechanical properties of the natural
ground and of different artificial turf infills and their biomechanical implications. J Sports Sci, 31(7), pp.767-78.
[email protected] 06 Aug 2018
TESTIMONIALS ABOUT JAN VAN WINCKEL
“In the four years we worked together at Club, I got to know Jan to be a true professional,
perhaps the best in Belgium in his field”- Luc Devroe, former Technical Director at Club
Brugge KV.
“As instructor at the Belgian UEFA-Pro license course, Jan made an impression by transla-
ting difficult theoretical fitness-training concepts into plain footballing language and prac-
tical exercise material. This enabled our UEFA-Pro course participants to acquire the ability
to get their players physically ready to deliver top-level football performances” - Bob Bro-
waeys, Director of the Federal Trainers’ School.
“Due to, and thanks to, Jan’s vision, expertise and professionalism, the team stood out
through its fantastic general fitness and extremely low injury rate.” - Adrie Koster,
ex-coach of Ajax Amsterdam and Club Brugge KV
“During his period as assistant coach at Club Brugge, Jan Van Winckel proved that his
solid scientific approach leads to strong results. He also gave our club’s training approach
a new dimension, supported not by intuition but rather on the basis of physiological and
biomechanical criteria.” - Dr. M. D’Hooghe, Honorary Chairman of Club Brugge and
Chairman of the FIFA Medical Committee
“Due to, and thanks to, Jan’s vision, expertise and professionalism, the team stood out
through its fantastic general fitness and extremely low injury rate.” - Adrie Koster,
ex-coach of Ajax Amsterdam and Club Brugge KV
“I have seldom seen a coach who can translate science into practical football application so
well.” - Aad de Mos, ex-coach of (among others) Ajax Amsterdam, PSV Eindhoven,
Werder Bremen, RSC Anderlecht
“Jan is one of the best in his field, probably one of the best in the world.” - Carl Hoefkens,
former player of the Belgian national team, West Bromwich Albion and Stoke City
“Jan’s work is characterized by professionalism, precision and the systemic use of modern
training principles. His scientific work has had a direct impact on the success of the club in
recent years.” - Prof. Ahmed El-Shafee, general manager of Al-Ahli Saudi Football
Club
«Jan Van Winckel was the best coach to have taken charge of the senior national team by
far.” Polycarp Lwazi (Times)
“My special acknowledgement goes to our coach Mr. Van Winckel for molding a
formidable national team that has been able to restore the country’s dented image in
international competitions” Themba Dlamini, Prime minister of Swaziland
“Olympique de Marseille will remember a great professional who, beyond his pioneering
work in the field of sports science, will have contributed greatly to the structural reform of
the technical department undertaken by the management.”
[email protected] 06 Aug 2018
409
Vincent Labrune, president of Olympique de Marseille
“Jan’s vision and professionalism has contributed a lot to the success of Al-Ahli
Saudi in recent years.”
HRH Prince Khaled Bin Adullah Bin Abdulaziz, President of Al-Ahli Saudi
[email protected] 06 Aug 2018


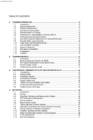
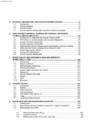

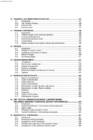


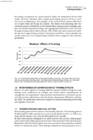

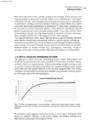

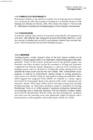
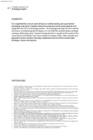

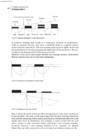
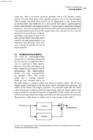
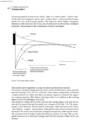
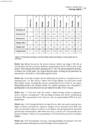
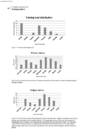
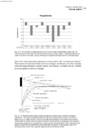
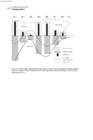

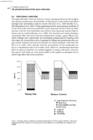
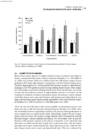
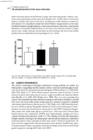
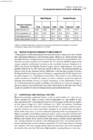
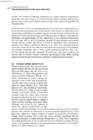
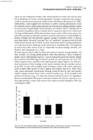


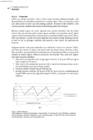
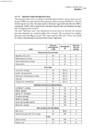
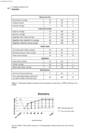


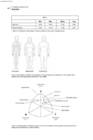
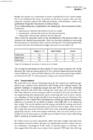


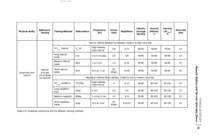

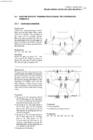
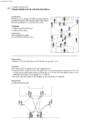
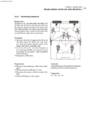
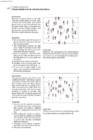
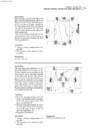


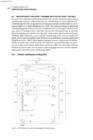
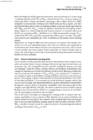


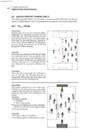
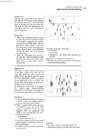

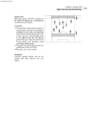
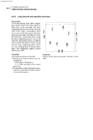
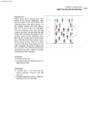


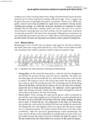


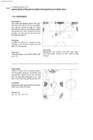
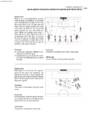
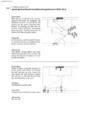


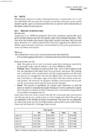
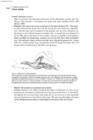

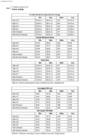

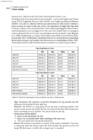

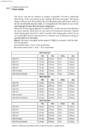
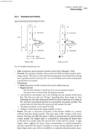
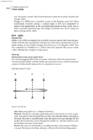
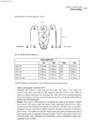
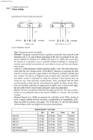
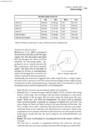
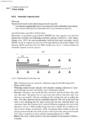
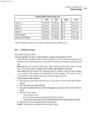
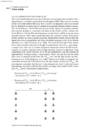

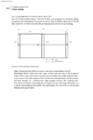


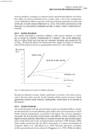
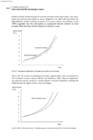
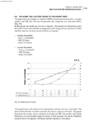
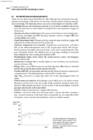
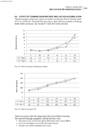

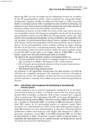

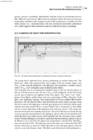

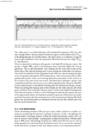

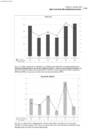

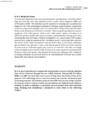

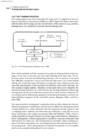


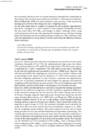
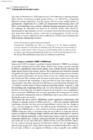
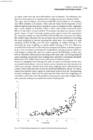
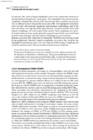

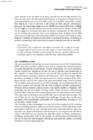


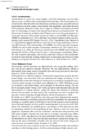
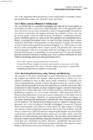


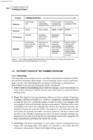


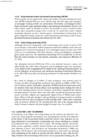

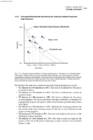
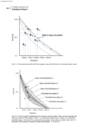


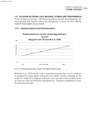
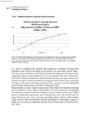
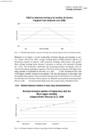
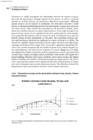


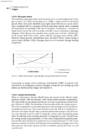
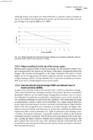

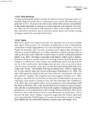


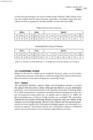


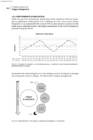
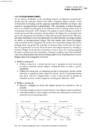
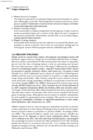


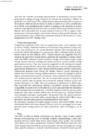

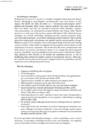
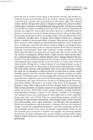
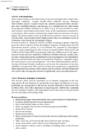

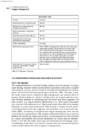
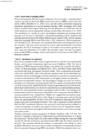
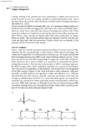
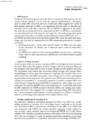
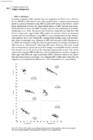
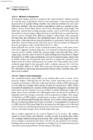


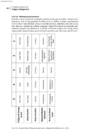
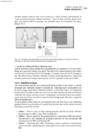
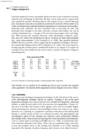


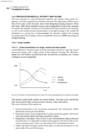
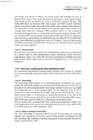
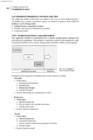
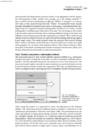
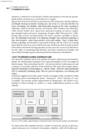


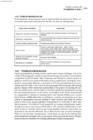
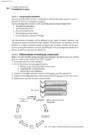


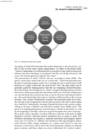
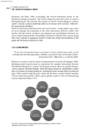


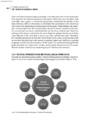
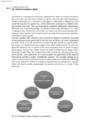
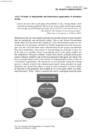
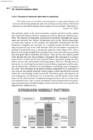
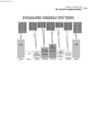


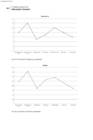
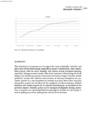

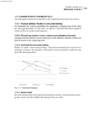


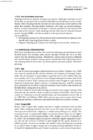


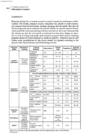


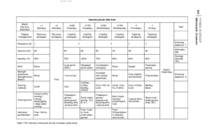


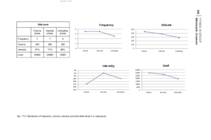
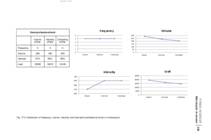
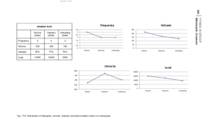


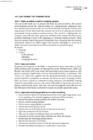
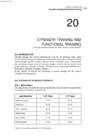

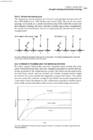
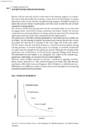
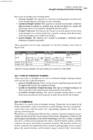
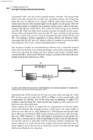


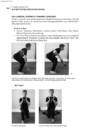

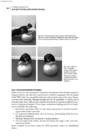
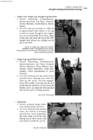


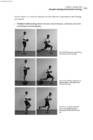


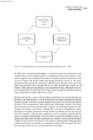
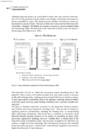


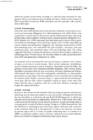

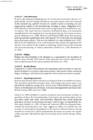

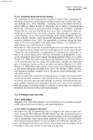
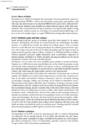


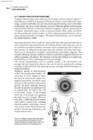
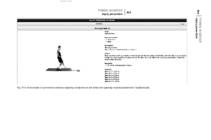


Kõik kommentaarid