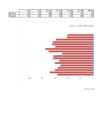
0-4 5-9 10-14 15-19 20-24 25-29 30-34 Mehed 45 75 60 63 72 74 73 Naised -56 -68 -60 -55 -51 -60 -53 Koeru Valla Rahvastikupüramiid -100 -80 -60 -40 -20 0 20 Mehed Naised 35-39 40-44 45-49 50-54 55-59 60-64 65-69 70-74 81 75 65 68 83 63 52 44 -63 -62 -48 -70 -75 -59 -64 -63 Rahvastikupüramiid 2016
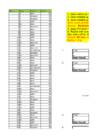
JKN Sugu Haridus Vanus 1n kesk 55 1. Leia naiste ja meeste arv 2n kõrgem 42 2. Leia meeste ja naiste osatähts 3n kõrgem 46 4. Leia meeste ja naiste kesmine 4n põhi 37 5m kesk 39 Mida saab järeldada? 6m kesk-eri 42 Vastus: Keskmine vanus on ho 7n kesk 41 5. Jaga töötajad hariduse järgi gru 8n kesk 44 6. Kujuta see graafiliselt diagram 9n põhi 48 Kas saab väita, et mida vanem in 10 m põhi 32 Vastus: Ei saa, sest lähteülesa 11 n kesk 48 Kokku: 15 p 12 m kesk-eri 38 13 n põhi
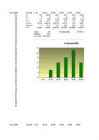
Aasta 2008 vahemik 0-19 20-29 30-39 40-49 50-59 60-69 22 Xi 9,5 14,50 34,5 44,5 54,5 64,5 24 Fi 0 3 6 8 11 6 28 Pi 0 0,06 0,14 0,18 0,25 0,14 30 Xi-X -9,5 -41,1 -21,1 -11,1 -1,1 8,9 34 (Xi-X)2 90,25 1690,31 445,79 123,51 1,24 78,97 36 Pi*(Xi-X) 0 6,15 12,3 16,4 22,6 12,3 38 Pi% 0,00% 6,00% 14,00% 18,00% 25,00% 14,00% 38 39 Mood 54 Standardhälve 17,79711 40 Mediaan 55,5 40 keskmine 55,61364 41 43 44
21,325 France Average 14,4 Germany 9,8 Germany 25,5 Germany 10 Germany 9,8 Germany 9,8 Germany 16,6 Germany 10,7 Germany 14,6 Germany 13,4667 Germany Average 9 Hong Kong 20 Hong Kong 19 Hong Kong 26 Hong Kong 18,5 Hong Kong Average 16,8 India 10 India 9,2 India 31,1 India 27 India 13,2 India 15,5 India 17,5429 India Average 10,3 Israel 10,3 Israel Average 11 Italy 18 Italy 14,5 Italy Average 10,4 Kuwait 10,4 Kuwait Average 9,5 Malaysia 12,5 Malaysia 11 Malaysia Average 11,9 Mexico 74 Mexico 16 Mexico 33,9667 Mexico Average 13,8 Nigeria 13,8 Nigeria Average 18,5 Russia 17,7 Russia 9,5 Russia 9,6 Russia 9,9 Russia 9,1 Russia 15,1 Russia 18 Russia
16,6 Germany 14,6 Germany 14,4 Germany 10,7 Germany 10 Germany 9,8 Germany 9,8 Germany 9,8 Germany 13,4666666667 Germany Average 26 Hong Kong 20 Hong Kong 19 Hong Kong 9 Hong Kong 18,5 Hong Kong Average 31,1 India 27 India 16,8 India 15,5 India 13,2 India 10 India 9,2 India 17,5428571429 India Average 10,3 Israel 10,3 Israel Average 18 Italy 11 Italy 14,5 Italy Average 10,4 Kuwait 10,4 Kuwait Average 12,5 Malaysia 9,5 Malaysia 11 Malaysia Average 74 Mexico 16 Mexico 11,9 Mexico 33,9666666667 Mexico Average 13,8 Nigeria 13,8 Nigeria Average
N N (variatsioonrida) Keskväärtus Dispersioon Standardhälve 12 1 45.12 1165.026667 34.1324869687 6 4 11 6 ÜL 4 62 7 Vahemikud Tõenäosus/laius 21 10 0-20 0.016 62 11 21-40 0.01 7 12 41-60 0.004 98 15 61-80 0.008 10 21 81-100 0.012 1 25 52 27 Normaaljaotus 27 33 Vahemikud Tõenäosus/laius 81 38 0-20 0.01
# A N 25 xi F0(xi) 1 62 keskväärtus 53,24 77 9 0,09 2 37 dispersioon 705,69 264 15 0,15 3 81 standardhälve 26,56 771 18 0,18 4 54 mediaan 51 1 19 0,19 5 18 haare 85 1242 30 0,30 6 9 1957 32 0,32 7 43 T-qvantiil 1,711 105 33 0,33 8 89 delta mu 9,1 1279 37 0,37 9 19 1172 41 0,41 10 15 keskväärtuse usaldusv.
Lääne-Virumaa Sidorova Ekaterina 9A · - . . - , . -- . 2 13 . · (2012) 61 154 (5- ) · 16,86 ./² (5- ) · 3627,8 ² (3- ) · , , . · 2006 . 9,5 , 13,8 , - 4,3 . 85 ja vanemad 80-84 75-79 70-74 65-69 60-64 55-59 50-54 45-49 Mehed 40-44 Naised 35-39 30-34 25-29 20-24 15-19 10-14 5-9 0-4


Kõik kommentaarid