REPORT Young people's activities in Simuvere Gymnasium in 1996, 1998 and 2000 Introduction The aim of this report is to describe, how are young people's favourite pastimes changed between 1996 and 2000. The survey is carried out in Simuvere Gymnasium in 1996, 1998 and 2000. Students who were questioned were 16-18 years old. My findings are presented below. Numbers have given in precentages. Changes among pastime activities. At graph we can see big changes. 1. Before 1996 students mostly watched television but in 1998 it was already ten percent less. In 2000 it was only twenty five percent. 2. Before students loved to read books, but in 2000 this number was only fifteen percent. This is not good anymore. 3. In 1996 students did not know what is computer or what we can do with that. In 2000 everyone can use computer
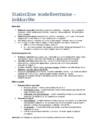
1.31 H_Q03d 2.491 0.881 0.047 2.827 0.005 0.763 0 Lineaarne regressioon näitas, et kuludega arveldamine (calculating costs or budgets; β = - 0.128, p < .001), murdude ja protsentide arvutamine (use or calculate fractions or precentages; β = 0.299, p < .001), kalkulaatori kasutamine (use a calculator; β = 0.047, p < .05) ennustasid numbrilist võimekust statistiliselt olulisel määral. Mudel seletas 7.7% variatiivsusest numbrilise võimekuse tulemusest, kohandatud R 2 = 0.077, F(3, 4458) = 125.088, p < .001. Regressioon binaarse muutujaga Regressioon, kus sõltumatu muutuja on binaarne väärtus (nt sugu) Muutujad tähistatakse kui 0 ja 1, 0 on referentsmuutuja