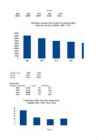
Sheet1 1990 2000 2010 2020 2030 45289 39988 34870 33165 30831 Rahvaarvu muutus Võru maakonnas pessimistliku stsenaariumi järgi aastatel 1990 - 2030 50000 45000 40000 35000 30000 25000 20000 15000 10000 5000 0 1990 2000 2010 2020 2030 oodatav eluiga 1990 2010
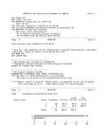
Regression 3 5.96197 1.98732 Residual 29 18.28046 .63036 F = 3.15268 Signif F = .0398 ------------------ Variables in the Equation ------------------ Variable B SE B Beta T Sig T T11 -.30526 .17483 -.33682 -1.746 .0914 T9 -.33646 .14191 -.39988 -2.371 .0246 T10 -.13837 .15698 -.17625 -.881 .3853 (Constant) 3.67551 .66999 5.486 .0000 End Block Number 1 All requested variables entered. ------------------------------------------------------------------------------- Page 12 SPSS/PC+ 6/12/ 2 This procedure was completed at 10:26:32 * Sama, aga mudeli automaatne formeerimine.