Graafiku kirjeldus, inglise keeles
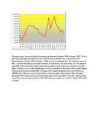
The graph shows how much profit did company get between September 2005 to August 2007. At first
there was remarkable fall. Profit fell from 1 100.00 euros to 900.00 euros, a decrease of 19%.
Beginning from October 2005 to February 2006 income rose dramatically. The company soared by
66%. Income were floating for antoher 4 months. One month fell, the other month rise. This lasted to
June 2006. After that income remain stable for one month- to July. In July was came down, by 14%.
Then, in August,it was a stable period again, but from September till November profit slipped sharply.
The income between November 2006 to January 2007 soared dramatically from 1050.00 euros to
1850.00 euros. This was an quick improvement, which was made with 2 months. After that profit
plummeted 73% within a month. Income reached a peak in February 2007. Since then, there has been
a significant downturn for 4 months. In July 2007 there was a slight rise. Finally...