of these decisions. Since the objectives are often pecuniary, it is often necessary to relate the decisions about the physical units of inputs and outputs to the costs of production. · If the prices of the inputs and the production relationships are known (or understood), it is possible to calculate or estimate all the cost relationships for each level of output. In practice however, the decision maker will probably have partial
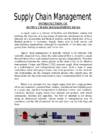
industry and firm to firm. Unlike commercial manufacturing supplies, services such as clinical supplies planning are very dynamic and can often have last minute changes. Availability of patient kit when patient arrives at investigator site is very important for clinical trial success. This results in overproduction of drug products to take care of last minute change in demand. R&D manufacturing is very expensive and overproduction of patient kits adds significant cost to the total cost of clinical trials. An integrated supply chain can reduce the overproduction of drug products by efficient demand management, planning, and inventory management. Traditionally, marketing, distribution, planning, manufacturing, and the purchasing organizations along the supply chain operated independently. These organizations have their own objectives and these are often conflicting. Marketing's objective of high customer service and maximum sales dollars
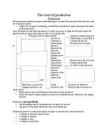
Strategy how we get there? How do we want to achieve our vision, given our current mission`? Steps: 1. Situation appraisal 2. Choice of the best strategy 3. Operationalisation 4. Organisation, budgets and control Internal analysis: strengths and weaknesses External analysis: opportunities and threats, the environment (CCC analysis: consumer, channel, competition). Lecture 3: Finance and accounting Turnover (sales) in numbers = total number of units sold Turnover in money = sales level, average sales price per unit x total number of units sold. VAT (Value Added Tax) 9%. Landed cost: a special case The total of: purchase price, shipment costs, insurance, customs clearance costs. Break even point gives the relationship between costs, turnover and profit/margin. Costs:
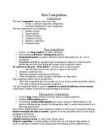
Total-revenue-total-cost approach Marginal-revenue-marginal-cost approach Both apply to pure competition, pure monopoly, monopolistic competition, oligopoly Short Run Profit Maximization · Profits (p) = TR - TC. - p are often the objective or goal of firm. · The firm will choose to produce and offer for sale all additional units of output that they can produce for a cost (MC) that is less than the additional revenue (MR) that they collect. · Maximum profits (or minimum loses) for a firm occur when MR = MC. Ideally, the market will "signal" the costs of sellers and benefits to buyers with the market price; P = MR = MC Total-revenue-total-cost approach Should we produce this product? Profit Yes; Loss No In what amount? Output level where economic profit is maximized
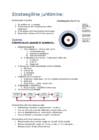
Swichboard model Efficiency model Blockbuster model Profit multiplier model Entrepreneurial model De Facto Industry standard model Business model generation Osterwalderi ärimudel: 4 valdkonda ja 9 bulding blocki 1. How a. Capabilities, Key resources, Partner network 2. What a. offer 3. Who a. Distribution channels, customer relations, customer segments 4. Cost/income ($, ) cost structure, revenue flows Korporatsiooni väärtusahel: Strategic operations issues: Intermittment systems item is normally processed seqentally, but the work and sequence of the process vary Continuous systems work is laid out in lines on which products can be continuously assambled or processed Operating leverage impact of a specific change in sales volume on net operation income
institutional development and policy. Economically, Ukraine has grown along with the region. As such, growth rates have not been low, but they come after the economically devastating 1990s and are not built on a 6 sustainable foundation. For years Russia provided Ukraine with underpriced gas while Ukraine's export prices increased rapidly. Over the decades Ukraine, however, grew dependent on oil and gas coming from Russia, at almost no cost. Today, 70 percent of gas consumed in the country is imported. In 1991 Ukraine was one of the poorest Soviet republics. Statistics for the time are notoriously uncertain, but the best ones available show Ukraine's GDP at just $1,307 per capita. Only Azerbaijan, Georgia, Kyrgyzstan, Tajikistan, and Uzbekistan lagged behind Ukraine; even Moldova and Turkmenistan, generally regarded as very poor Soviet republics, were ahead of Ukraine. Ukraine's economy contracted annually between 9.7 and 22
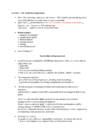
Barriers to Entry (BTE) Social or political institutions or economic conditions that prevent firms from entry into a market. There are three major types of barriers to entry: economic, legal and deliberate. laws, regulations, patents, copyrights, trademarks, . . . location, natural ability, information, economics of scale (natural monopolies) Economic Barriers:Economic barriers include economies of scale, capital requirements, cost advantages and technological superiority Economic Barriers Economies of scale: Monopolies are characterized by declining costs over a relatively large range of production. Declining costs coupled with large start up costs give monopolies an advantage over would be competitors. · Monopolies are often in a position to cut prices below a new entrant's operating costs and drive them out of the industry.
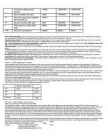
....................................................................................................... 42 6. ALLOWANCES/ PERMISSIONS NEEDED, PROCEDURES TO ACQUIRE ........................................ 43 6.1. The privileges granted to foreign investors ............................................................................... 43 6.2. Excise duties ............................................................................................................................... 45 7. ACCOUNTING ............................................................................................................................ 49 7.1 Levels of the system of accounting regulation in the Russian Federation ................................ 49 7.2. The Federal Law "On Accounting" ............................................................................................ 51 7.3. Chart of accounts and other documents .............................................................................


Kõik kommentaarid