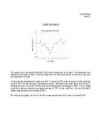
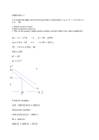
Päivi Margna Form 11 Graph description The graph shows the growth and fall of the water temperature in 14 days. The horizontal axes represents the number of days, when the temperature was measured and the vertical axes represents the temperature of water. On first day the temperature of water was 25ºC. It raised to 26ºC in the secon day. By the third day it fell to 24ºC. For the next day it raised by one degree. After that, since forth day to seventh day, it fell dramatically to only 20ºC. By the ninth day the tepmerature raised again to 25ºC. Then it stayed satble for a day and raised by one degree per day to 27ºC on the twelft day. On day 13 it fell 2 degrees and on tha last day it raised to 26ºC. By stud...
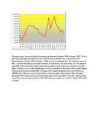
The graph shows how much profit did company get between September 2005 to August 2007. At first there was remarkable fall. Profit fell from 1 100.00 euros to 900.00 euros, a decrease of 19%. Beginning from October 2005 to February 2006 income rose dramatically. The company soared by 66%. Income were floating for antoher 4 months. One month fell, the other month rise. This lasted to June 2006. After that income remain stable for one month- to July. In July was came down, by 14%. Then, in August,it was a stable period again, but from September till November profit slipped sharply. The income between November 2006 to January 2007 soared dramatically from 1050.00 euros to 1850.00 euros. This was an quick improvement, which was made with 2 months. After that profit plummeted 73% within a month. Income reached a peak in February 2007. Since then, there has been a significant downturn for 4 months. In July 2007 there was a slight rise. Finally...
Births in Estonia in January 2009 and December 2008. This graph shows how many children were born in December 2008 and January 2009 in each county. The horizontal axis represents the counties and vertical axis represents the number of children. Most children born in January 2009 and December 2008 were born in Harjumaa and second popular place was Tartu. In December there were 644 births in Harjumaa and in January there was a plunge to 582. In Tartu there was a decrease too. In January there were 37 births less than in December. In Pärnumaa, Ida-Virumaa, Viljandimaa, Jõgevamaa, Võrumaa, Valgamaa and Hiiumaa there was a recovering and the number of births was bigger than a month ago. According to that in Tartu, Harjumaa, Lääne-Virumaa, Raplamaa, Jõrvamaa, Saaremaa, Põlvamaa and Läänemaa the number of births decreased. Viljandimaa, Raplamaa, Järvamaa, Saaremaa, Võrumaa, Valgamaa, Põlvamaa, Läänemaa and Hiiumaa's variations were v...
Occupational diseases Report Introduction: This report is about occupational diseases. The report is based on two graphs. The first one describes the number of diseases from the year 1998 to the year 2000. The second one describes the occupations, which have shown to be the most alarming. The report will also give some pointers for the people, who have some kind of occupational diseases. Number of diseases: On the first graph is shown the number of occupational diseases. From the first half of the year 1998 to the middle of the year 1999 the number of occupational diseases grew from 169 to 180. The numbers started to grew rapidly in the middle of the year 1999 and it grew from 180 to 205 within just 1 year. So it is clearly shown that the number of diseases keeps growing. It is not shown on the graph, but the number of occupational diseases in the year 2013 can be risen to thousands considering the growth that has be...
Output of non-deterministic algorithm may be different for different runs with the same input data Mittedetermineeritud algoritmi tulemus samade lähteandmete korral võib erinevatel lahenduskordadel olla erinev. Tõene Partial algorithm terminates for any set of input data. Osaline algoritm peatub mistahes sisendandmete korral. Väär Average time complexity of binary search is O(log n). Kahendotsimise keskmine ajaline keerukus on O(log n). Tõene Worst case time complexity of merge sort is O(n). Ühildusmeetodi (merge sort) halvima juhu ajaline keerukus on O(n). Väär (it is O(n log n)) Sorting method is quick if it has average time complexity O(n lon n). Järjestamismeetod on kiire, kui selle keskmine ajaline keerukus on O(n log n). Tõene Jah, üldjuhul ei saa kiiremini Last element added to the stack is removed first. Magasini (stack) viimati lisatud element eemaldatakse esimesena. Tõene LIFO=Last In First Out Set of possible value...
REPORT This report compares different types of injuries. Reading this report you will get to know what are the parts of the body that get injured most frequently. The first parts of the body are fingers. According to the graph fingers are most commonly injured 13, 4 %.I think that is normal, because we use our fingers all the time and it is easy to cut into yourself . If you have injured yourself with a knife , then you should try to stop the bleeding and use a plaster. The second most common injuries happen to your skulls 6,5 %. You might hurt your skull by falling or getting hit by something. If you do injure your skull then it is better to see a doctor, who will tell you what to do. This graph shows that eyes are injured also quite commonly-6,1 %. Your eyes might get hurt because of wind or something might fall into them. If your eyes are, hurt then you should use eye drops, and if t...
Games Programming with Java and Java 3D Andrew Davison Dept. of Computer Engineering Prince of Songkla University HatYai, Songkhla 90112 E-mail: [email protected] Draft: 14th January 2003, #2 Abstract This article looks at the advantages and disadvantages of using Java and Java 3D for games programming. It assumes the reader is familiar with Java, but presents short overviews of gaming, the low-level APIs OpenGL and DirectX, and Java 3D. No programming examples are included here, although links to online code are supplied. 1. Background to Gaming Giving a definition for `computer game' is problematic, due to the wide range of game types. For example, the ArcadePod site (http://www.arcadePod.com) divides its hundreds of Java games into more ...
Tallinn University of Technology Department of Electrical Engineering Report on laboratory work 4 on General Course of Electrical Drive INDUCTION MOTOR DRIVE (LUCAS-NÜLLE) Jüri Lina 666BMW Group M16 Variant 2 Tallinn 2014 1. Functional Diagram Nameplate data: Loading Machine SO3636- VDE 0530 IP:5 Is.KL: 6V 4 F U: 390V I: 4,4 A 4Nm/1.7k cos: W 4050 1/min f: 140 Hz Induction motor: SE2663-1K VDE 0530 IP: 20 Is.KL: F /Y U: 230/400V I: 1,7 / 1,0A Mot.DS 0,30 kW cos: 0.76 ...
Read Chapter_5_Output_Control_Methods.pdf Question 1 (10 marks) Draw a PID control scheme and write down an equation to describe the PID control. Compare the differences between the “bang-bang“ control and proportional control. What are the functions of Integral and Derivative terms in the PID equation. Solution: Draw a PID control system: (Figure 5.5, page 111) Write down an equation to describe the PID control: (page 111) Compare the differences and the advantages between the “bang-bang“ control and Proportional control: (page 105) “Bang-Bang“ control or ON-OFF control is the simplest control system. It turns ON when the system needs more INPUT and tuns OFF if the system doesn’t need INPUT any more. The INPUT is similar to the PWM square wave (running ON and OFF during the length of the needed INPUT). Bang-Bang control is similar to the PWM input signal Proportional control: Bang-Bang con...
Tallinn University of Technology Department of Electricl Power Engineering and Mechatronics Report on Exercises 4 on Power Electronics AC Voltage Regulators Tallinn 2017 Given parameters: Output voltage, Ud = 20 V Input frequency, fin = 50 Hz Load resistance, Rload = 70 kOhm Calculations: U ¿ =2∗U out =2∗20=40V U max U rms = =17.09 V √2 Period = pulse width + delay => 10 ms = 5 ms + 5 ms Table 1. Control curve data. Delay time, Pulse with, Alpha, firing Switch SCR ms ms angle Uout, V Iout, mA Uout, V Iout, mA 0 10 0 28.14 ...
1 System development • Modelling in early system development stage corrects design errors before construction. • Beneficial modelling reasons (– Insight: in the design and operation of a system – Completeness: detection of missing parts for simulation and a better understanding of the system requirements – Correctness: errors and flaws are usually detected, problematic scenarios can be reproduced, systematic error investigation) 2 Introduction CPN • CPN is a graphical language for concurrent system design and analysis and also general-purpose modelling environment and also applicable for industrial projects and high level programming. • Petri nets provide(– graphical notation– modelling concurrency, communication, synchronisation) • CPN application domains that are typical(– communication protocols, data networks, distributed algorithms) • ...
Pivot diagrammi moodustamine Diagramm - /diagram, chart/ - arvjoonis, millel arvusid kujutatakse nendega võrdelise pindalaga kujundite, nagu sektorite, tulpade vms. abil. Inglise keeles nimetatakse neid ka "graph", Vahendit, mis diagramme Excelis moodustab nimetatakse "Microsoft Graph". Mõnikord on kasulik enne diagrammi tegemist andmed tabelis summeerida. Üks võimalus selleks on moodustada tabelis uus veerg, kuhu saab sisestada soovitud valemi. Edasi moodustada selle veeru alusel diagramm. Teine võimalus on kasutada niisugustel juhtudel Pivot' diagrammi. Pivot' diagramm on spetsiaalne diagrammitüüp, mis võimaldab summeerida andmeid. Pivot' diagramm on seotud Pivot' tabeliga. P. tabel võimaldab olemasolevaid andmeid esitada kokkuvõtvalt. P. diagramm sobib kõige paremini siis, kui on olemas palju üksikandmeid, mida soovid grupeerida ja summeerida. P diagrammi ei ole mõtet asutada, kui andmed on juba summeeritud või koondatud. Näide Pi...
INSTITUTO POLITECNICO DO PORTO INSTITUTO SUPERIOR DE ENGENHARIA DO PORTO CHEMICAL ENGINEERING DEPARTMENT PORTUGAL Marvin Üürike Tallinn University of Technology Faculty of Chemical and Materials Technology Department of Chemical Engineering Estonia ERASMUS PROJECT STUDY OF THE HEAT TRANSFER COEFFICIENT IN A HELICAL COIL Supervisor: Albina Ribeiro Porto 2015 2 Abstract The following work investigates overall heat transfer coefficient of a helical coil and how it changes in different situations. The variables investigated were flow rate inside a submerged helical coil and agitation of the bath. To investigate the change in heat transfer coefficient in different situations, a simple experiment was set up. It consisted of a rectangular isolated ...
MAINORI KÕRGKOOL Rakenduspsühholoogia õppesuund Personalijuhtimise eriala Liis Peet VAHETUSTEGA TÖÖ MÕJUD TERVISELE Referaat Tallinn, 2008 Vahetustega töö mõjud tervisele- 2- SISUKORD SISUKORD............................................................................................................................2 SISSEJUHATUS....................................................................................................................3 MEETODID........................................................................................................................... 5 TULEMUSED........................................................................................................................7 VIITED.............................................
PASCO scientific 1 P16: Impulsi jäävuse uurimine I Science Workshop Katse P16: Impulsi jäävuse uurimine I SW lnterfeis: 700 Windows® fail: c:sciwkshplibraryphysicsp16_con1.sws Töövahendid Science WorkshopTM interfeis, kaks statiivi, kaks liikumissensorit (Motion Sensor), kaks vankrikest, 2,2 m pikkune relss, kaal ja kaaluvihid. Eesmärk Laboratoorse töö eesmärgiks on uurida impulsi jäävuse seadust kahe vankrikese abil. (lmpulsi jäävuse seaduse eksperimentaalne kontroll.) TEOORIA Keha impulss on keha massi ja kiiruse korrutis. Kuivörd kiirus on vektoriaalne suurus (tal on alati suund), siis on ka impulss vektoriaalne suurus. Suletud süsteemi kuuluvate kehade süsteemi impulss on jääv suurus -- süsteemi kuuluvate kehade impulsside vektoriaalne summa on kehadevahelise kokkupörke käigus konstantne. See kehtib vaid juhul, kui süsteemile ei möju höördejöud vöi (öhu...
REPORT Young people's activities in Simuvere Gymnasium in 1996, 1998 and 2000 Introduction The aim of this report is to describe, how are young people's favourite pastimes changed between 1996 and 2000. The survey is carried out in Simuvere Gymnasium in 1996, 1998 and 2000. Students who were questioned were 16-18 years old. My findings are presented below. Numbers have given in precentages. Changes among pastime activities. At graph we can see big changes. 1. Before 1996 students mostly watched television but in 1998 it was already ten percent less. In 2000 it was only twenty five percent. 2. Before students loved to read books, but in 2000 this number was only fifteen percent. This is not good anymore. 3. In 1996 students did not know what is computer or what we can do with that. In 2000 everyone can use computer. The most studen...
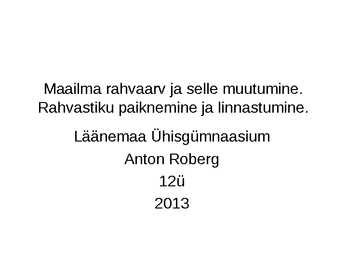
Maailma rahvaarv ja selle muutumine. Rahvastiku paiknemine ja linnastumine. Läänemaa Ühisgümnaasium Anton Roberg 12ü 2013 Maailma rahvaarv ja selle muutumine · Maailma rahvaarv on kõikide maailmas elavate inimeste summa. · 1950. elas maailmas 2.5 miljardit inimest. · 2013. aastaks on see tõusnud üle 7 miljardi. · 2050. aastaks ennustatakse rahvastiku kasvu kuni 9 miljardi elanikuni. · Kõige kõrgem oli rahvastiku kasv 1963. aastal, mil rahvastik kasvas 2.2% aastas. https://www.google.ee/search?q=maailma+rahvaarv+ja+selle+muutumine&sour Maailma rahvaarvu kasvu prognoos http://et.wikipedia.org/wiki/Pilt:Maailma_elanikkond(UN)-ee.svg Suurima rahvaarvuga riigid https://www.google.ee/search?q=most+populous+countries+2011+and+2050&source=lnms&tbm=isch&sa=X&ei=1a50UqK Rahvaarvu kasv ja kasvutempo erinevad terminid...
Green Technologies - innovation and climate change sustainagility Scientists can examine ice, but they cannot tell out anything about our future. Even if scientist has lived thousand years he won't be able to do it. The graph in video shows that the amount on carbon dioxide rises and then rises the temperature, but it is not so, it is exactly the opposite. One way to save energy is to build better buildings, because big headquarters are built to last only for 30-35 years. Building them up and pulling them down needs a lot of energy and about 30% of building energy is spent on it. It is thought that if in Tokyo 50% of all roofs are green it will save 1 million dollars a day of Tokyo businesses in cooling costs. Street light use 5% of energy, but it can be reduced to 2%. Usual TVs should be replaced with Plasma TV, because it saves energy more. By driving electic-car, it is possible to save energy a...
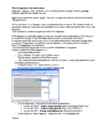
Tabel (4. osa) – MS Word 2003 Jüri Kormik Tabel (4. osa) Kui tabel on valmis (andmed lisatud, vormindamine ja arvutused tehtud), siis oleks hea selle sisu ilmestamiseks lisada diagramm („üks pilt räägib rohkem kui tuhat sõna“). Kõige lihtsam viis diagrammi lisamiseks oleks eelnevalt Excel’is tabel ja diagramm valmis teha ning siis kopeerida Word’i (kas pildina või luues link lähtediagrammiga klõpsates käsuga Redigeeri > Kleebi teisiti… (ingl. Edit > Paste Special…) avanevas dialoogiaknas valiku- nupul Kleebi link). Aga siinkohal sellel me ei peatu, vaid õpime looma diagrammi Word’is juba loodud tabeli põhjal. Word’i koosseisu kuuluva programmiga Microsoft Graph saab dokumendis oleva tabeli põhjal koostada diagrammi. Diagrammi lisamiseks tuleb andmetabel eelnevalt esile tõsta ja valida menüükäsk Lisa > Pilt > Diagramm (ingl. Insert > Picture > Chart) või Lisa > Objekt… (ingl. ...
Formal transactional letter Complaining: I am writing to you about (several problems related to my city break in June). I have been waiting for (two weeks for replay to my letter). To make matters worse, (we were informed that there was no record of our cheque being cashed). I am writing to complain about... I am sorry to inform you that... I was very disappointed with... I have some complaints about... I would be grateful if you could (refund the cost of the holiday as soon as possible.) Requesting: I am writing in response to (your advertisement in The Daily Standard on July 20th) I would be grateful if you could (send me further details about the position) I am writing to enquire whether (you colud let me have further details about the holiday) I would like to know more about (the arrangements for the evening meal) I am writing for information about... I would like to learn/ know more about... I would like to ask whether/ if... I w...
Uus - Meremaa Geograafiline asend Asub Okeaania edelaosas Märkimisväärne on just tema geograafiline eraldatus, olles eraldatud Austraaliast loodesse Tasmani mere poolt, üle 2000 kilomeetri Lähimad naabrid põhjas on Uus- Kaledoonia, Fidzi ja Tonga. Üldandmed Keel Inglise ja Maoori Pealinn Wellington Riigipea Elizabeth II Kindralkuberner Anand Satyanand Pindala 268 680 km² Rahvaarv 4 213 418 Rahaühik Dollar Looduslikud tingimused Valdavalt mägine maa Saared on seismilised, kuid vulkaanilist tegevust on praegu vaid Põhjasaarel Saarel on ka geisrid, mudavulkaanid ja kuumaveeallikad Kliima on mereline, ühtlane ja pehme Lõuna-Alpide kõrgeimaid mägesid katavad igijää ja lumi Ajalooline kujunemine · Polüneesia meresõitjad saabusid Uus- Meremaale 11. ja 13. sajandi · Esimesed eurooplased saabusid sinna 1642.a. · 1643. aastal tõestastati, et eeldatav Lõu...
ART 1. visuaalne(nägemise kaudu tajutav) kunst-visual arts 2. arhitektuur- architecture 3. esitus(ettekandev)kunst-performing arts 4. skulptuur-sculpture 5. skulptor-sculptor 6. tarbekunst(rakenduskunst)- applied arts 7. vitraaz-stained glass 8. pastell- pastel 9. maastikumaal-landscape 10. portree-portrait 11. portretist(portreekunstnik)- portrait 12. portreemaal-portrait painting 13. viirutamine, viirutamistehnika-streaking 14. emailimine, emailivärviga katmine-enameling ? 15. graveerimine-engraving 16. papp-cardboard 17. elevandiluu-ivory 18. papüürus-papyrus 19. miniatuurkunst, miniatuurmaal-miniature painting 20. lõuend-canvas 21. õlivärvid-oil paints, oil colours 22. meremaal-seascape, marine painting ? 23. värvigamma, koloriit-colour, coulouring ? 24. (joonistamis)süsi-charcoal 25. käsitöö-handicraft 26. keraamika ja pottsepatöö-pottery 27. ...
Summary This is the summary for the presentation about big data by xxx. The presentation was divided into four topics. Starting with what is big data and briefly about it’s history, secondly discussed about it’s characteristics, nextly what can one do with big data and lasty the 5 big data challenges. Firstly the author brought out what does the term big data mean. Big data is a term for data sets that are so large or complex that traditional data processing application software is inadequate to deal with them. In the article „Big Data For SMBs“ the author mentioned that big data could be described with the three V-s: volume, velocity and variety. This paragraph talked about the amount, speed and variety of the data gathered. The author continued with big data opportunities. She brought out that by dipping into and analyzing big data, one can find out who the most valuable customers are, analyze competito...
EXERCISE N. 1 The demand and supply curves for fixed gear bikes in Hipsterland are �� = 75 − 1.5� and �� = 1.5� − 30. a. Find the equilibrium price; b. Find the equilibrium quantity; c. What are the consumer surplus, producer surplus, and total welfare at the market equilibrium? qD = 75 – 1,5*p => p = 50 – 2/3*q qS = 1,5*p – 30 => p = 20 + 2/3*q 75 – 1,5*p = 1,5*p – 30 3*p = 105 p* = 35 q* = 22,5 p S 50 35 2 0 D 22, 75 q 5 Producer surplus: ((35 – 20)*22,5)/2 = 168,75 Consumer surplus: ((50-35)*22,5)/2 = 168,75 Total welfare: 168,75 + 168,75 = 337,5 EXERCISE N. 2 When the price of apple juice rises by 3%, the quantity demanded drops by 8%. Then, demand of for apple juice is elastici? E...
Litograafia ehk kivitrükk (kreeka keeles lithos 'kivi' + graph 'kirjutan') on lametrükitehnika, mis põhineb rasva ja vee vastastikuse tõukumise printsiibil ja mille puhul kasutatakse trükkimiseks kiviplaati. (Lametrükk on trükitehnika, mille puhul trükiplaadi pind on täiesti tasane. Värvi kinnitamiseks kasutatakse mitmeid keemilisi ja fotokeemilisi võtteid. Tuntuim tehnika on litograafia ehk kivitrükk.) Trükkimiseks on vaja litokivi. Litokivi ehk litograafiakivi on peeneteraline ja savikas lubjakiviplaat, mida kasutatakse litograafias. Litokivi lihvitakse tavaliselt 812 cm paksuseks. Seejärel joonistatakse kivile rasvase kriidi ja/või tussi abil kujutis, mida söövitatakse nõrga lämmastikhappe lahusega. Happe toimel ühineb värvis sisalduv rasv keemiliselt kiviga (joonisevabadel pindadel laiendab hape kivi poore ja muudab pinna vastuvõtlikuks vee toimele). Pärast seda kaetakse plaat kummiaraabikuga, et kaitsta sinna peale tehtud kujutist...
REPORT What´s the purpose of the report? A report is usually written to give information to somebody who needs it. This means that the writer knows more about the subject than the reader. You may be asked to give information, evaluate something, or make suggestions and recommendations. MAKE YOUR REPORT CLEAR AND SIMPLE. What style should I use? A report is based on facts and/ or data. Think carefully about the best way to present the facts. Be clear and avoid unnecessary detail. Give essential information and recommendations. A report is a formal piece of writing and it is impersonal (avoid using the pronoun " I "). Say what you have to say in as few words as possible. How should I structure a report? Every report, like an essay, should have the following parts: A. INTRODUCTION- state what you are going to write about. If the report is based on a survey, state when and by whom the survey...
Häädemeeste Keskkool Lametrükk - litograafia Koostaja: Tiiu Hanson Juhendaja: Marika Ristmäe Häädemeeste 2009 Sisukord Sissejuhatus.................................................................................................................................3 Graafika.......................................................................................................................................4 Lametrükk...........................................................................................
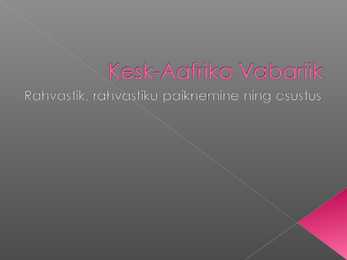
KeskAafrika Vabariigis elab ligikaudu 5 166 510 miljonit inimest Riigid, kus on enamvähem sama rahvaarv on Norra, Liibanon, Costa Rica Rahvaarv võrreldes teiste riikidega, on selle riigi oma keskmine Rahvaarv on iga viie aastaga suurenenud ühtlaselt. Aastast 19502025 Kasvutempo 1950 kuni käesoleva aastani Kasvutempo prognoos aastani 2025. 2015-2020: 2.11% 2020-2025: 2.05% A) Sündimuse üldkordaja on läinud madalamaks ning tulevikus läheb veelgi. Sündide üldarv on aga tõusuteel. B) Keskmiselt lapsi naise kohta: läinud madalamaks ning tulevikus läheb veelgi. C) Antud regiooni riikidega võrreldes on näitajad kõrged, sest Kesk Aafrika Vabariik on väga vaene maa Minevikus on suremuse üldkordaja tõusnud, kuid prognoosi kohaselt hakkab see näitaja langema. Surmasid on hakanud tulema rohkem. Minevikus oli imikusuremuse näitaja kõrge kuid nüüd on ha...
A B C D E F G H I J K L M N O P Q R 1 Advertising model 2 Note: All monetary values are in $1000s, and all exposures to ads are in millions of exposures. 3 Inputs 4 Exposures to various groups per ad 1. Suppose, as a matter of corporate policy, that the company 5 Friends MNF Malcolm in Middle Sports Center TRL Live Lifetime movie ...
SLAID 1 I am going to talk about wooden pallets. After I am finished I will answer any question you might have about my presentation. SLAID 2 Lets start with history. Wooden pallets date back to 1000 B.C. Egiptians used sheets of wood for transport and storage. These wooden sheets are called skids or sleads. They are still in use but their shape and durability has changed a lot. It was the during the early 1920’s, shortly after the modern forklift was invented, when skids evolved into pallets, revolutionizing the way merchandise was stored and transported. The new design of pallets allowed goods to be moved, stored and stacked with extraordinary speed and versatility. During the WWII the allied countries established a standard size pallet to ease shipment and transportation. This agreement skyrocketed the production and popularity of wooden pallets during the war After the war variety of sizes and designs were produced and used. The tra...
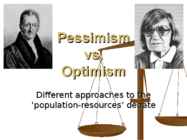
Pessimism vs. Optimism Different approaches to the ‘population-resources’ debate Malthus Task: View figure 13.57 (page 378 of Waugh). Draw the graph and discuss. Malthus believed that there was a finite optimum population in relation to food supply and that an increase beyond that point would lead to a decline in living standards and to war, famine and disease. An increase in the population above the optimum limit would therefore lead to war, famine and disease. A PESSIMISTIC approach Thomas Malthus (1798) proposed his work during the early stages of the industrial revolution when inadequate food and clothing were common features in England. His argument was that population increases (geometrically) or at an exponential rate if unchecked i.e. 1-2-4-8- 16-32 etc Food supply at best increases at an arithmetic rate i.e.1-2-3-4-5-6 etc ...
Graafid Graaf koosneb tippudest(sõlmedest) ja neid ühendavatest kaartest. Kaarega võib ühendada suvalisi graafi tippe, sealhulgas on võimalik kaar samale tipule (iseendale). Iga kaar on määratud kahe tipuga. Orienteeritud graaf: kaared on järjestatud tipupaarid. Def: Graaf on paar (V,E), kus V on mittetühi hulk ning E hulk, mille elementideks on hulga V kaheelemendilised alamhulgad. Näide lk 47 (Palm) Tipu aste tipust väljuvate servade arv. Teoreem: Igas graafis on kõigi tippude astmete summa võrdne servade arvu kahekordsega. Järeldus: Igas graafis on paaritu astemga tippe paarisarv. Ahel graafis tippude järjend, kus iga kaks järjestikust tippu on servaga ühendatud (esimene ja viimane on otstipud vahepeal sisetipud). Ahela pikkus on k kui selles on k+1 tippu. Ahel võib läbida mõnda tippu mitu korda. Lihtahel kõik tipud läbitakse üks kord. Tippude u ja v vaheline kaugus - tippude u ja v vahelise lihtahela pikkus Tsükkel ...
Pure Competition Competition The word "competition" may be used in two ways: rivalry (synonym; opposition, antagonism) structural competition or "pure competition" The main characteristics of competition: 1. Number of firms 2. Type of product 3. Control over price 4. Conditions of entry 5. Nonprice competition 6. Information flow Pure Competition · Involves very large numbers of sellers and buyers. · Firms producing identical or homogeneous products. · Standardized product (a product identical to that of other producers). (ex. corn or cucumbers). · Free Entry and Exit: no significant legal, technological, financial, or other obstacles prohibiting new firms from selling their output in any competitive market N...
MARKET Market system is an interrelated set of markets for goods, services and inputs. A market is defined as the interaction of all potential buyers and sellers of a good or class of goods that are close substitutes. · The markets provide information to agents that may be used to identify and evaluate alternative choices that might be used to achieve objectives. · Each agent acting in a market has incentives to react to the information provided. · Given the information and incentives, agents within markets can adjust to changes. The process of market adjustment can be visualized as changes in demand and/or supply. · Markets include all potential buyers and sellers geographic boundaries of market markets defined by nature of product and characteristics of buyers conditions of entry into market markets, competit...
Tallinna Prantsuse Lütseum Austraalia Joosep Tiismus 11A Tallinn 2012 SISUKORD Sissejuhatus...............................................................................2 Rahvastik..................................................................................3 Rahvastiku soolis-vanuseline koosseis.................................................4 Linnastumine..............................................................................5 Energiamajandus.........................................................................6 Tööstuse areng............................................................................7 Austraalia põllumajandus.................
MIINA HÄRMA GÜMNAASIUM GEOGRAAFIA Filipiinid Nimi Referaat Juhendaja: Tartu 2014 Sisukord 1 Sissejuhatus 3 Geograafia 4 Riigi kuulumine suurregiooni 5 Riigi arengutase 6 Majandusorganisatsioonidesse kuulumine 6 Rahvastik 7-8 Linnastumine 8 Energiamajandus 9 Põllumajandus 9-11 Metsamajandus 11 Tööstus 12 Transport 12 Turism 13 Kasutatud materjalid 14-15 Sissejuhatus 2 Filipiinid on riik, mille leidsid esimesed asukad 30000 aastat tagasi ja oli esimene Kagu-Aasia riik, mis sai iseseisvaks peale Teist maailmasõda(1946). See saarterikas riik on ka ainus riik maailmas, mis heiskab lipu tagurpidi, kui on sõjaolukord. Tegemist on maailma suurima sõnumite saatjate riigiga (350-4...
TALLINNA TEHNIKAÜLIKOOL Majandusteaduskond Ärikorralduse instituut Ettevõtluse õppetool Siim Aru GLOBAALSED NAFTARESERVID, NAFTA TARBIMINE JA TULEVIKUSTSENAARIUMID Referaat aines Ärilogistika Õppejõud: dotsent Tarvo Niine Tallinn 2016 SISUKORD SISSEJUHATUS ............................................................................................................ 4 1. NAFTA KUI RESSURSS .......................................................................................... 5 1.1 Nafta definitsioon ................................................................................................. 5 1.2. Nafta ajalugu ........................................................................................................ 5 1.3. Nafta olulisu...
Maastikupõhise graafilise ühenduvusanalüüsi integreeriv kasutamine. Juhtumiuuring: rohukonn inimdominatsiooniga maastikel referaat õppeaines XXX Koostas : XXXX Juhendaja : XXXX Tartu 2013 Sissejuhatus Rahvastiku arv maailmas aina kasvab, kuid maailmaruum jääb ikka samaks. Inimtegevus mõjutab kõike siin maakeral, kuid üha suuremas ohus on praegu meie jaoks väga tavaliste taime- ja loomaliikide hävinemine. Erinevad liigid on muutunud haavatavaks, kuna nende elupaigaks sobivat maad on järjest vähem ja elupaigad on killustunud. Allesjäänud elupaikade vahelist liikumist pidurdavad maastiku läbitavuse vähenemine ja inimtekkelised takistused. Võimalus maastikul liikuda on liikide jaoks aga ellujäämiseks vajalik protsess, mida tuleb erinevatel inimmõjutustega maastikel uurida. Üheks selliseks ...
Monopoly Market Power In pure competition sellers are "price takers." No seller (or buyer) has the ability to influence the market price. In most markets, at least one or more of the conditions required for pure competition are violated. This gives sellers or buyers the ability to influence the market price and allocation of resources Pure competition results in an optimal allocation or resources given the objective of an economic system to allocate resources to their highest valued uses or to allocate relative scarce resource to maximize the satisfaction of (unlimited) wants in a cultural context. Pure competition is the ideal that is be benchmark to evaluate the performance markets. The economic theory of · monopolistic competitive markets, · oligopoly and · monopoly is used to suggest the nature of problems that may exist wh...
1. Milles seisneb static typing ja dynamic typing erinevus? Static- Muutuja tüüpi on teada kompileerimise ajal ning seda muuta ei saa. See vähendab vigade hulka programmi töö ajal. Dynamic – Muutuja tüüp selgub programmi töö ajal. 2. Milliseid piiranguid seavad nähtavusele proteced ja package-private (default) nähtavused? Public – nähtav kõigile Package private- nähtav paketi sees Private – nähtav klassi sees Protected – nähtav paketi sees ja alamklassidele 3. Mis on Oracle Java virtuaalmasina (JVM) nimi? Kes ei tea, kukub ainest läbi :) JRE Java Runtime Environment – java programmi käivitamiseks JDK – Java Development Kit - arendusvahend java programmi arendamiseks 4. Tüübiteisendus - milleks vajalik, kuidas kasutatakse? Fruit a = new Apple(); Alamtüüp. Deklareeritud tüüp -- Loodud tüüp.Millist tüüpi deklareerida? - Eelistada alati üldisemat tüüpi Alamtüüpi objekti same alati kasutada ülemtüübina(implicit casting). Apple b = new Appl...
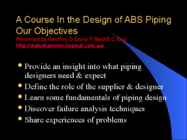
A Course In the Design of ABS Piping Our Objectives Presented by Geoffrey D Stone FIMechE C.Eng http://waterhammer.hopout.com.au/ Provide an insight into what piping designers need & expect Define the role of the supplier & designer Learn some fundamentals of piping design Discover failure analysis techniques Share experiences of problems A Course In the Design of ABS Piping What We Shall Look at This Week ABS Material Properties Thermoplastic Pipe Design Waterhammer Analysis Typical Applications of ABS Pressure Pipe Some Anticipated Events Stages of the Design Process Representation-Drawings & Specification Calculation-Engineering & Assumptions Visualisation-Presentation of Information Validation-Testing & Commissioning Role of the ABS Pipe Supplier What the Customer Expects Avoid the following: Material Properties Accept design risk for a sale Design Criteria Accept MTO risk Design Guid...
http://www.pewforum.org/2015/04/02/religious-projections-2010-2050/ APRIL 2, 2015 The Future of World Religions: Population Growth Projections, 2010-2050 Why Muslims Are Rising Fastest and the Unaffiliated Are Shrinking as a Share of the World’s Population The religious profile of the world is rapidly changing, driven primarily by differences in fertility rates and the size of youth populations among the world’s major religions, as well as by people switching faiths. Over the next four decades, Christians will remain the largest religious group, but Islam will grow faster than any other major religion. If current trends continue, by 2050 … The number of Muslims will nearly equal the number of Christians around the world. Atheists, agnostics and other people who do not affiliate with any religion – though increasing in countries such as the United States and Fra...
Sõnavara päritolu. Põlis, laen ja tehissõnad Põlis ehk genuiin ehk genuiinne tüvi on vana oma keele tüvi, mida pole ära tuntud kui laenu kuskilt mujalt. Soomeugri keeleteadus on põlis ehk genuiin ehk genuiinses tüvevaras eristanud järgmised päritolurühmad (kolmandas lahtris on H. Rätsepa arvutused, kus küsitava etümoloogiaga sõnad on eri hüpoteeside põhjal arvatud korraga mitmesse rühma): Päritolurühm Aeg Arv Näiteid uurali tüvevara (kaugeimad vasted vähemalt uurali algkeelest (aegade 104119 tüve ela, ema, jõgi, kaks, kala, ühes samojeedi keeles) hämarusest IV aastatuhan keel, kõiv, nimi, ole, puu, deni e.m.a) päev, vesi so...
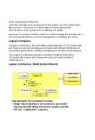
1.The Conceptual Architecture identifies the high-level components of the system, and the relationships among them. Its purpose is to direct attention at an appropriate decomposition other system without delving into details. Moreover, it provides a useful vehicle for communicating the architecture to non-technical audiences, such as management, marketing, and users. Logical Architecture In Logical Architecture, the externally visible properties of the components are made precise and unambiguous through well-defined interfaces and component specifications, and key architectural mechanisms are detailed. The Logical Architecture provides a detailed "blueprint" from which component developers and component users can work in relative independence. Logical Architecture. Model System Behavior Execution Architecture An Execution Architecture is created for distributed or concurrent systems. The process view shows the mapping of components on...
Economic Country Review: Finland, Estonia and Hungary Girli Vasiljev Report Business Economics, RB1X 06.05.2012 Abstract 06.05.2012 Experience and Wellness management Author Group Girli Vasiljev RB1X Title of report Number of pages Economic Country Review: Finland, Estonia 20 and Hungary Teacher Kalevi Torunen The goal of this paper is to compare the economic performance of Finland, Estonia and Hungary. First, a general overview on the countries will be given. After, economic indicators (real GDP growth rate, inflation, unemployment, household consumption, investment, current account, government budget and deficit) of the three countries will be compared to draw a conc...
Arvuti tark- ja riistvara Arvuti (PC, raal, kompuuter ...) on kahest osast koosnev süsteem, mis on määratud info töötlemiseks. Arvuti osad on: · tarkvara (software) kõik arvutis infot töötlevad programmid · riistvara (hardware) -nn. "käegakatsutav" osa : monitor, hiir, korpus jms ... Riistvara liigitakse otstarbe põhjal *sisendseadmed -> nendega sisestatakse andmed arvutisse klaviatuur, hiir, skänner, mikrofon *väljundseadmed -> nende kaudu väljastatakse andmed monitor/kuvar, printer, valjuhääldid *töötlusseadmeteks -> paiknevad tavaliselt arvuti korpuses ja tegelevad info töötlemisega keskseade, välismälud Töötlemine = mingi programmi täitmine Arvuti korpusest väljaspool paiknevaid seadmeid, mis on arvutiga mingil moel ühendatud ja mis on võimelised sellega suhtlema, nimetatakse arvuti välisseadmeteks. Ülesanne: 1. usb juhe 2. printer ...
1. Ökoloogiateaduse uurimisobjektid Ecology (from Greek: , "house"; -, "study of") is the scientificstudy of the relation of living organisms to each other and their surroundings.[1] Ecology includes the study of plant and animalpopulations, plant and animal communities and ecosystems. Ecologists study a range of living phenomena from the role of bacteria in nutrient recycling to the effects of tropical rain forest on the Earth's atmosphere. Autökoloogia on ökoloogia haru, mis tegeleb organismide keskkonnanõudluste ja keskkonna- suhete uurimise ja kirjeldamisega. Demökoloogia ehk populatsiooniökoloogia (Schwerdtfeger 1963: 1314) on ökoloogia haru, mis uurib organismide populatsioone ja nende keskkonnaoludest johtuvat dünaamikat. Sünökoloogia on ökoloogia haru, mis tegeleb liikidevaheliste suhetega ökosüsteemides, organismide mitmeliigiliste koosluste (ehk biotsönooside) ...
Margit Tepner k0848752 Sustainability aspects of biofuels 1. Introduction The literature review will discuss the sustainability aspects of biofuels. Food production will be the main concern as it is the most debated issue, but other aspects, such as land use change and water consumption will be also considered as they are essential aspects in the biofuels sustainability criteria. The review will discuss the viability of biofuels based on the current technologies. Second-generation biofuels are not yet commercially viable and therefore will not be discussed; although they could significantly improve the sustainability of biofuels when they break through to the industrial scale. 2. The scale of biofuels production 2.1. Drivers of biofuels production Lal (2010) stated that "three inter-connected challenges face humankind in the 21st century": food security, climate change, and energy security. The world...
1. (a) (i) gene length of DNA; codes for a (specific), polypeptide / protein / RNA; max 1 allele alternative form of a gene; found at a, locus / particular position on, a chromosome; max 1 (ii) assume allele refers to coat colour allele (coat colour) gene / alleles, only on X chromosome; A no (coat colour), gene / allele, on Y chromosome male cats, XY / only have one X chromosome; males have only one (coat colour) allele / cannot have two (coat colour) alleles; need black and orange alleles for tortoiseshell colour; 2 r r w w (b) parental genotypes C C × C C ; r w ...
Kordamisküsimused aines IAY0520 1. Mõisted arvuti, arvutisüsteem, arvuti riistvara iseloomustavad näitajad. Arvutit võib vaadelda kui süsteemi (arvutisüsteemi), mis töötleb programmimälus masinakeelset programmi ning teisendab andmemälus olevaid andmedi vastavalt sellele programmile. Arvuti riistavara iseloomustavad näitajad: Protsessor (keskprotsessor) Aritmeetika-loogikaüksus Juhtüksus Mälusüsteem Mälussüsteemi hierarhiline korraldus Infomahutavus Kiirus Maksumus Sisend-väljundsüsteem Info läbilaskevõime (reaktsiooniaeg) Struktuurne korraldus S/V-süsteemi talitluse korraldus: - Programselt juhitav - Katkestuste süsteemi rakendav - Otsemällupöördumise rakendamine - Kanalite (selektro, multipleks) rakendamine ...